BTC whales buy recent dips

Bitcoin price today: $98,300
- Bitcoin price trades in green on Monday after rallying almost 9% and hitting a new all-time high of $99,588 the previous week.
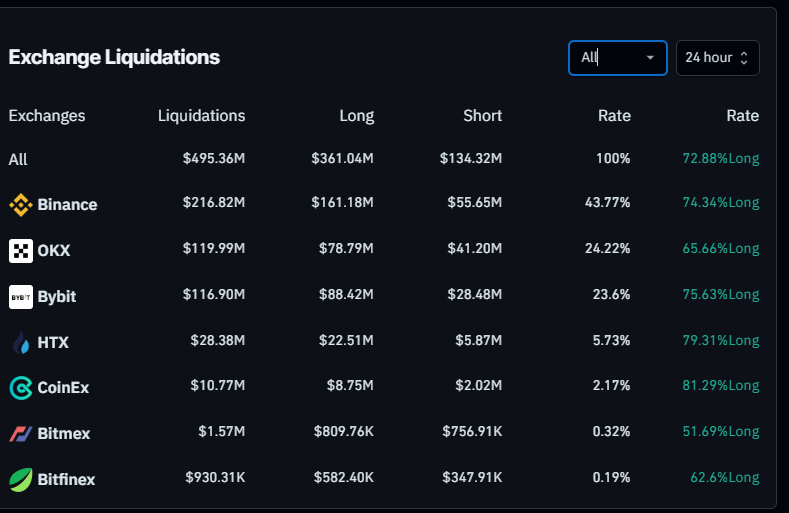
- Coinglass data shows the recent price drop on Sunday resulted in almost $500 million in total liquidations, more than $80 million specifically in BTC.
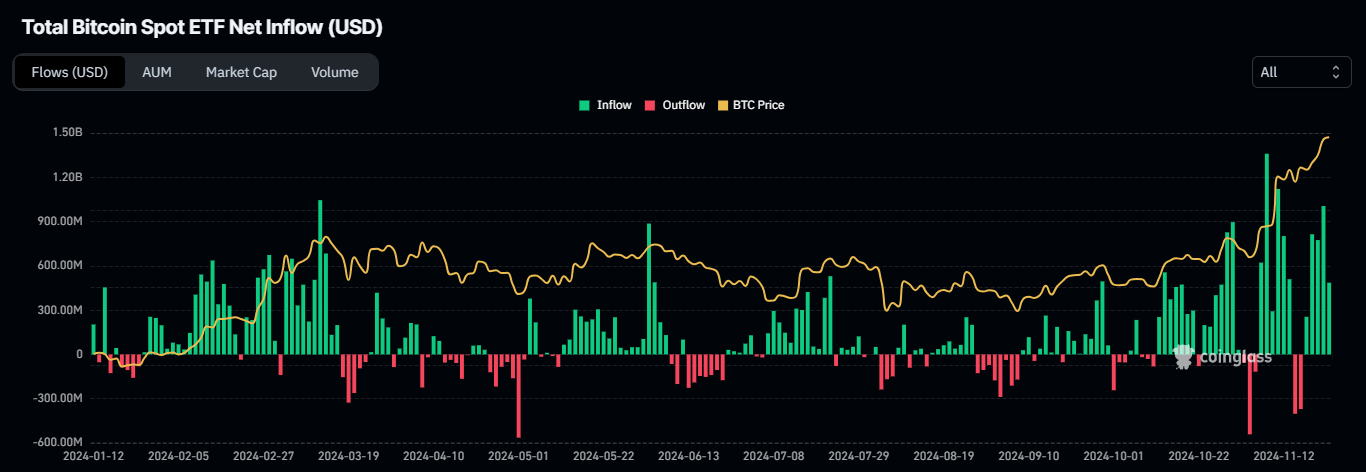
- On-chain data paints a bullish picture as US spot Bitcoin ETFs show a $3.34 billion net inflow last week and whales accumulating weekend dips.
Bitcoin (BTC) recovers from its weekend drop and trades higher above the $98,000 level on Monday after rallying almost 9% and hitting a new all-time high (ATH) of $99,588 last week. Coinglass data shows that the recent fall during the weekend wiped out almost $500 million in total liquidations, more than $80 million specifically in BTC. However, on-chain data projects a bullish outlook, as US spot Bitcoin Exchange Traded Funds (ETFs) show a $3.34 billion net inflow last week and whales accumulating weekend dips.
Bitcoin whales and institutional remain strong
Bitcoin price reached a new all-time high of $99,588 on Friday, just $412 away from the $100,000 milestone. However, during the weekend, BTC dipped 3.8%, reaching a low of $95,734 on Sunday, but quickly recovered and closed at $97,900.
BTC’s drop triggered a wave of liquidations across the crypto market, resulting in almost $500 million in total liquidations in the last 24 hours, more than $80 million specifically in BTC, according to data from CoinGlass.

Exchange Liquidations chart. Source: Coinglass
Despite the recent dip in Bitcoin, whales are still accumulating BTC. Lookonchain data shows that six fresh wallets withdrew 1,110 BTC worth $107.7 million from Binance on Sunday. Additionally, Data Nerd data also shows that three wallets accumulated 702.2 BTC worth $68.6 million from Binance on Saturday.
Moreover, institutional flows are also accumulating Bitcoin. According to Coinglass ETF data, US spot Bitcoin ETFs experienced a total net inflow of $3.34 billion last week, compared to $1.78 billion the previous week. If this inflow trend persists or accelerates, it could provide additional momentum to the ongoing Bitcoin price rally.


Total Bitcoin Spot ETF Net Inflow chart. Source: Coinglass
Traders should remain cautious as Bitcoin (BTC) approaches the $100,000 milestone. Profit-taking is a natural part of any price rally, and early signs of this are already emerging in the ongoing uptrend. According to CryptoQuant, the Short-Term Spent Output Profit Ratio (SOPR) indicator measures profits realized on coins held for more than 1 hour but less than 155 days. For this analysis, short-term investors hold Bitcoin for less than 155 days.
Historically, when using a 30-day moving average to the Short-Term SOPR, it has been observed that during bullish trends, the metric tends to reach around 1.02 before profit-taking occurs. Each time this level has been reached, Bitcoin’s price has experienced a pullback or correction.
On Monday, the metric stands at 1.02, suggesting that Bitcoin’s price could face a short-term correction. However, if capital inflows into the market continue and investors remain eager to buy Bitcoin, this historical pattern could be overridden, leading to a strong breakout beyond $100,000.
-638681354985638772.png)
Bitcoin Short Term Holder chart. Source: CryptoQuant
Bitcoin Price Forecast: Inches from $100,000 milestone
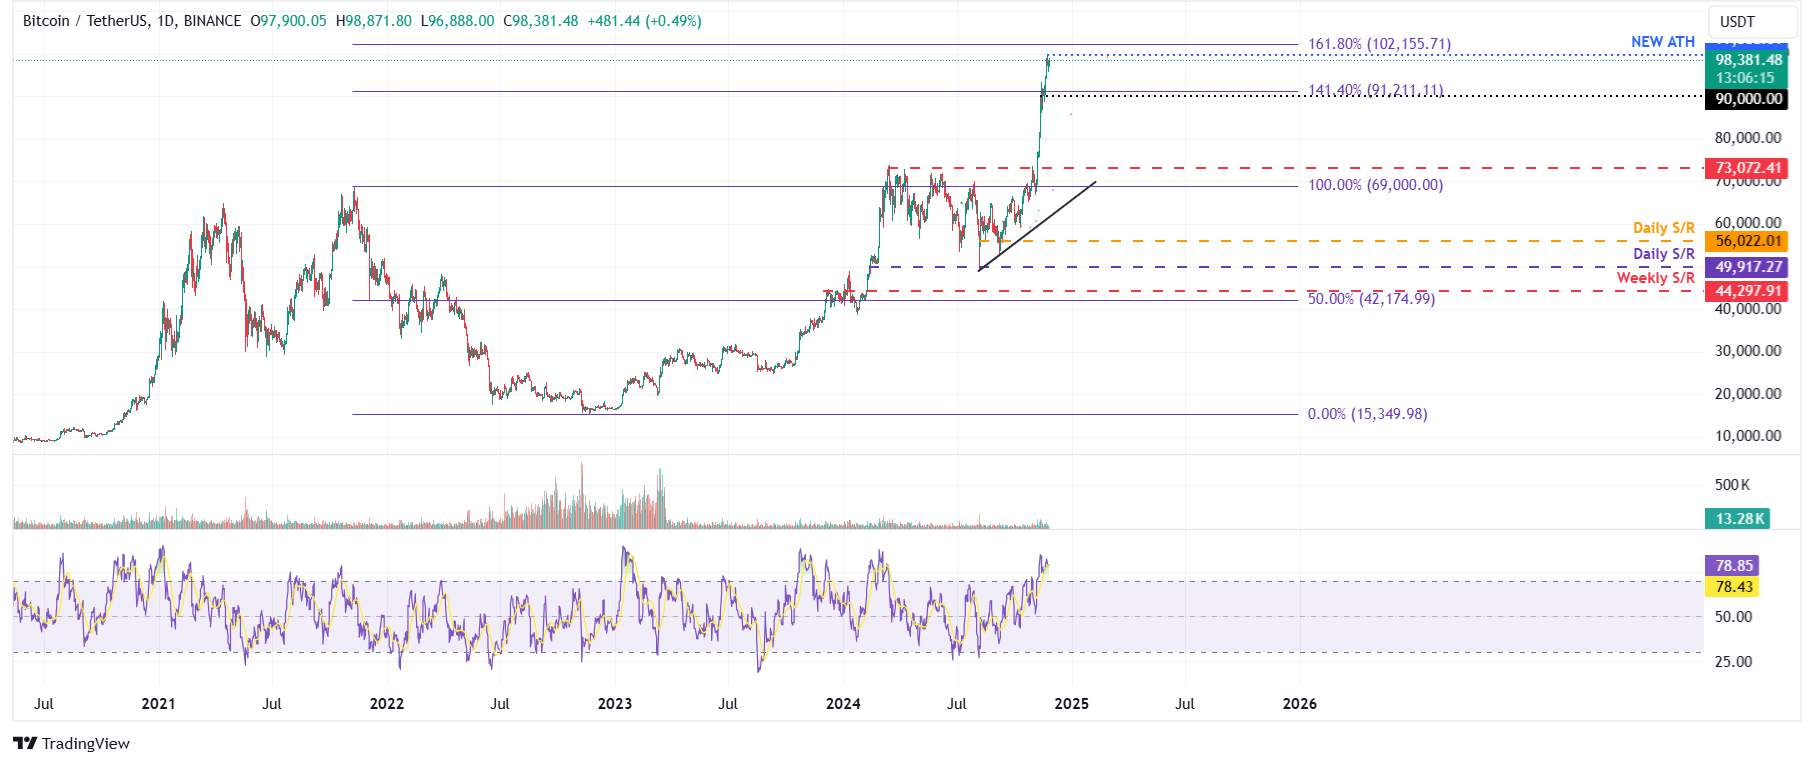
Bitcoin price rallied more than 40% in the last three weeks, hitting a new ATH of $99,588 on Friday. If BTC continues its upward momentum, it could extend the rally to retest the significant psychological level of $100,000.
However, the Relative Strength Index (RSI) momentum indicator stands at 78, signaling overbought conditions and suggesting an increasing risk of a correction. Traders should exercise caution when adding to their long positions, as the RSI’s move out of the overbought territory could provide a clear sign of a pullback.

BTC/USDT daily chart
If Bitcoin faces a pullback, it could decline to retest its key psychological level of $90,000.


