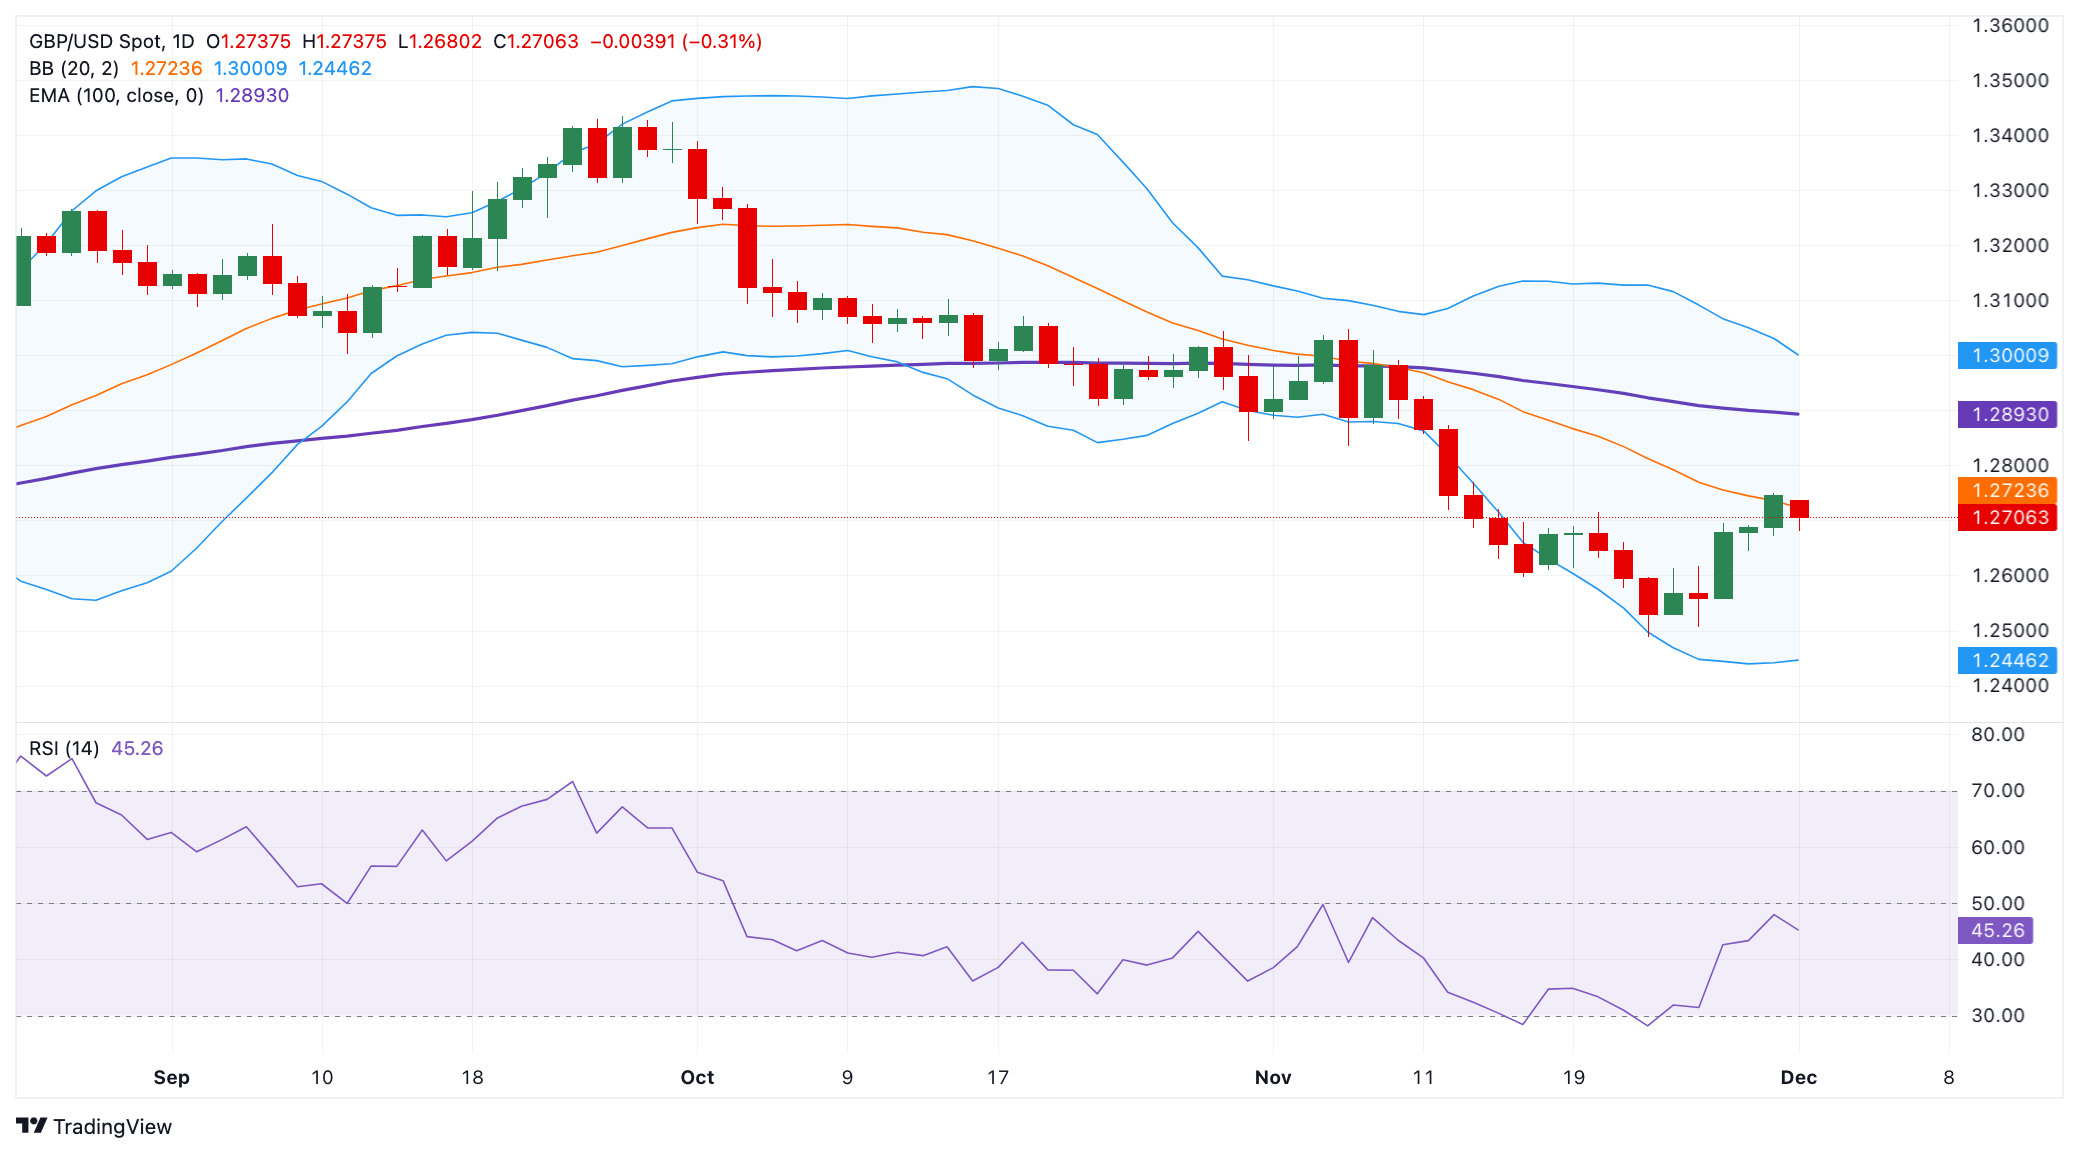
GBP/USD – The potential support level to watch is near 1.2600

- GBP/USD trades in the negative territory around 1.2700 in Monday’s early European session.
- The negative outlook of the pair remains intact below the 100-day EMA, with a bearish RSI indicator.
- The first downside target to watch is the 1.2600 psychological level; the immediate resistance level is seen at 1.2834.
The GBP/USD pair tumbles to near 1.2700 during the early European session on Monday, pressured by the firmer US Dollar (USD) broadly. The US President-elect Donald Trump’s tariff threats, the rising geopolitical tensions in West Asia and the rising expectation for less aggressive Fed rate cuts support the Greenback and act as a headwind for GBP/USD. The release of US ISM Manufacturing Purchasing Managers Index (PMI) data will be the highlight on Monday.
Technically, the negative view of GBP/USD prevails, with the price holding below the key 100-day Exponential Moving Average (EMA) on the daily chart. The downward momentum of the major pair is reinforced by the 14-day Relative Strength Index (RSI), which stands below the midline around 44.40.
The initial support level for GBP/USD emerges at the 1.2600 psychological level. Sustained bearish momentum could drag the major pair to the lower limit of the Bollinger Band at 1.2445. A break below this level could push prices lower toward 1.2331, the low of April 23.
On the bright side, the first upside barrier is located at 1.2834, the low of November 6. Extended gains above this level could pave the way for a test of the 1.2890-1.2900 zone, representing the round mark and the 100-day EMA. The psychological level and the upper boundary of the Bollinger Band of 1.3000 appear to be a tough nut to crack for bulls.
GBP/USD daily chart


