US Dollar sees PPI not make any difference while headline risks picks up

- The US Dollar trades a touch softer on Thursday against most major peers.
- Traders are quick to ignore the recent Producer Price Index (PPI) release.
- The US Dollar Index (DXY) resides below 108.00 and is flat for this week.
The US Dollar Index (DXY), which tracks the performance of the US Dollar (USD) against six major currencies, is not going anywhere as traders have issues balancing head- and tailwinds with a possible peace deal for Ukraine and Russia, US Producer Price Index (PPI) data and repicrocal tariffs to be imposed. The knee-jerk reaction comes after stronger-than-expected US Consumer Price Index (CPI) data for January was released on Wednesday, which pushed the US Dollar higher. However, the turnaround came in the US trading session when United States (US) President Donald Trump and Russian President Vladimir Putin agreed over the phone to start peace talks with Ukraine.
The economic calendar is done for this Thursday with traders now focussing on the US Retail Sales for Friday. The recent data points for this week are looking to be falling in line with what the Federal Reserve (Fed) is expecting. It remains too soon to say if the US economy will outperform again or will continue to roll over from here.
Daily digest market movers: Risks in the US session
- US President Trump issued a warning for Hamas and the Gaza region, demanding that Hamas releases all hostages by noon on Saturday or “all hell will break loose”, Reuters reports.
- US President Donald Trump communicated on this social network that this Thursday more info would be communicated on repicrocal tariffs.
- The possibility of a start in peace talks between Russia and Ukraine is spurring risk assets and the Euro (EUR) against the US Dollar (USD). This, in turn, triggers a softer US Dollar Index. The Euro accounts for 57.6% of the weight in the DXY.
- Nearly all important data for this Thursday has been released:
- US Jobless Claims for the week ending on February 7 came in at 213,000, below the consensus of 215,00 and coming from 219,000 in the previous week. Continuing Claims ending January 31 fell to 1.850 million, below the 1.880 million estimate and coming from the previous 1.886 million.
- The monthly headline PPI for January ticked up to 0.4%, above the 0.3% estimate and down from a revised 0.5% (previous 0.2%).
- The monthly core PPI for January came in at 0.3% as expected, coming from a revised 0.4% (previous 0%) in December.
- Equities are in a good mood. European indices outpace US futures, and all major indices and futures are trading in the green.
- After the stronger-than-expected January CPI reading, the CME FedWatch tool shows a 64.3% chance that interest rates will remain unchanged at current levels in June, compared to 50.3% before the release. This suggests that the Fed would keep rates unchanged for longer to fight against persistent inflation.
- The US 10-year yield is trading around 4.56%, sliding lower from this week’s high of 4.657%.
US Dollar Index Technical Analysis: A jigsaw puzzle
The US Dollar Index (DXY) is proving the thesis again that when all banks call for a specific direction or target level, the opposite will often materialize. At the start of this year, nearly all major banks predicted parity in EUR/USD as a given. With peace talks between Russia and Ukraine possibly underway and the tensions in Ukraine perhaps ending in 2025, a substantially weaker US Dollar might be a scenario only a few have kept as a possible outcome.
On the upside, the first barrier at 109.30 (July 14, 2022, high) was briefly surpassed but did not hold last week. Once that level is reclaimed, the next level to hit before advancing further remains at 110.79 (September 7, 2022, high).
On the downside, 107.35 (October 3, 2023, high) is still acting as strong support after several tests since late January. In case more downside occurs, look for 106.52 (April 16, 2024, high), 106.28 (100-day Simple Moving Average), or even 105.89 (resistance in June 2024) as better support levels.
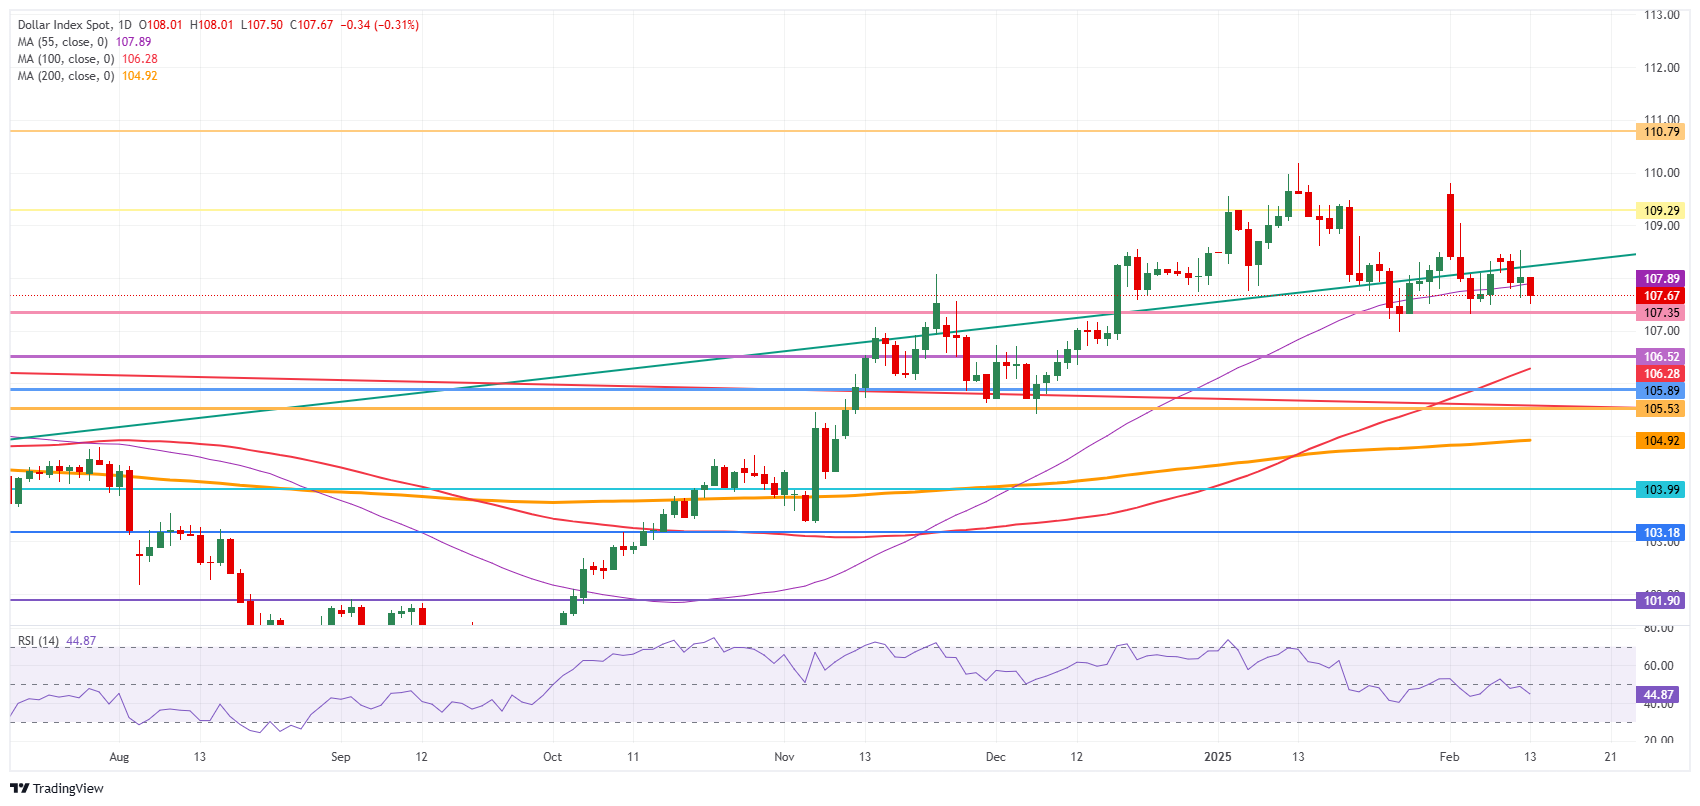
US Dollar Index: Daily Chart