XAG/USD sticks to gains around $32.35 area, bullish bias remains

- Silver regains positive traction following an Asian session dip to sub-$32.00 levels.
- Acceptance above the 100-day SMA and positive oscillators favor bullish traders.
- Any corrective pullback could be seen as a buying opportunity and remain limited.
Silver (XAG/USD) attracts dip-buyers near the $31.90 region at the start of a new week and stalls its retracement slide from the highest level since October 30, around the $33.35-$33.40 area touched on Friday. The white metal sticks to positive bias through the first half of the European session and currently trades around the $32.35 zone, up nearly 0.50% for the day.
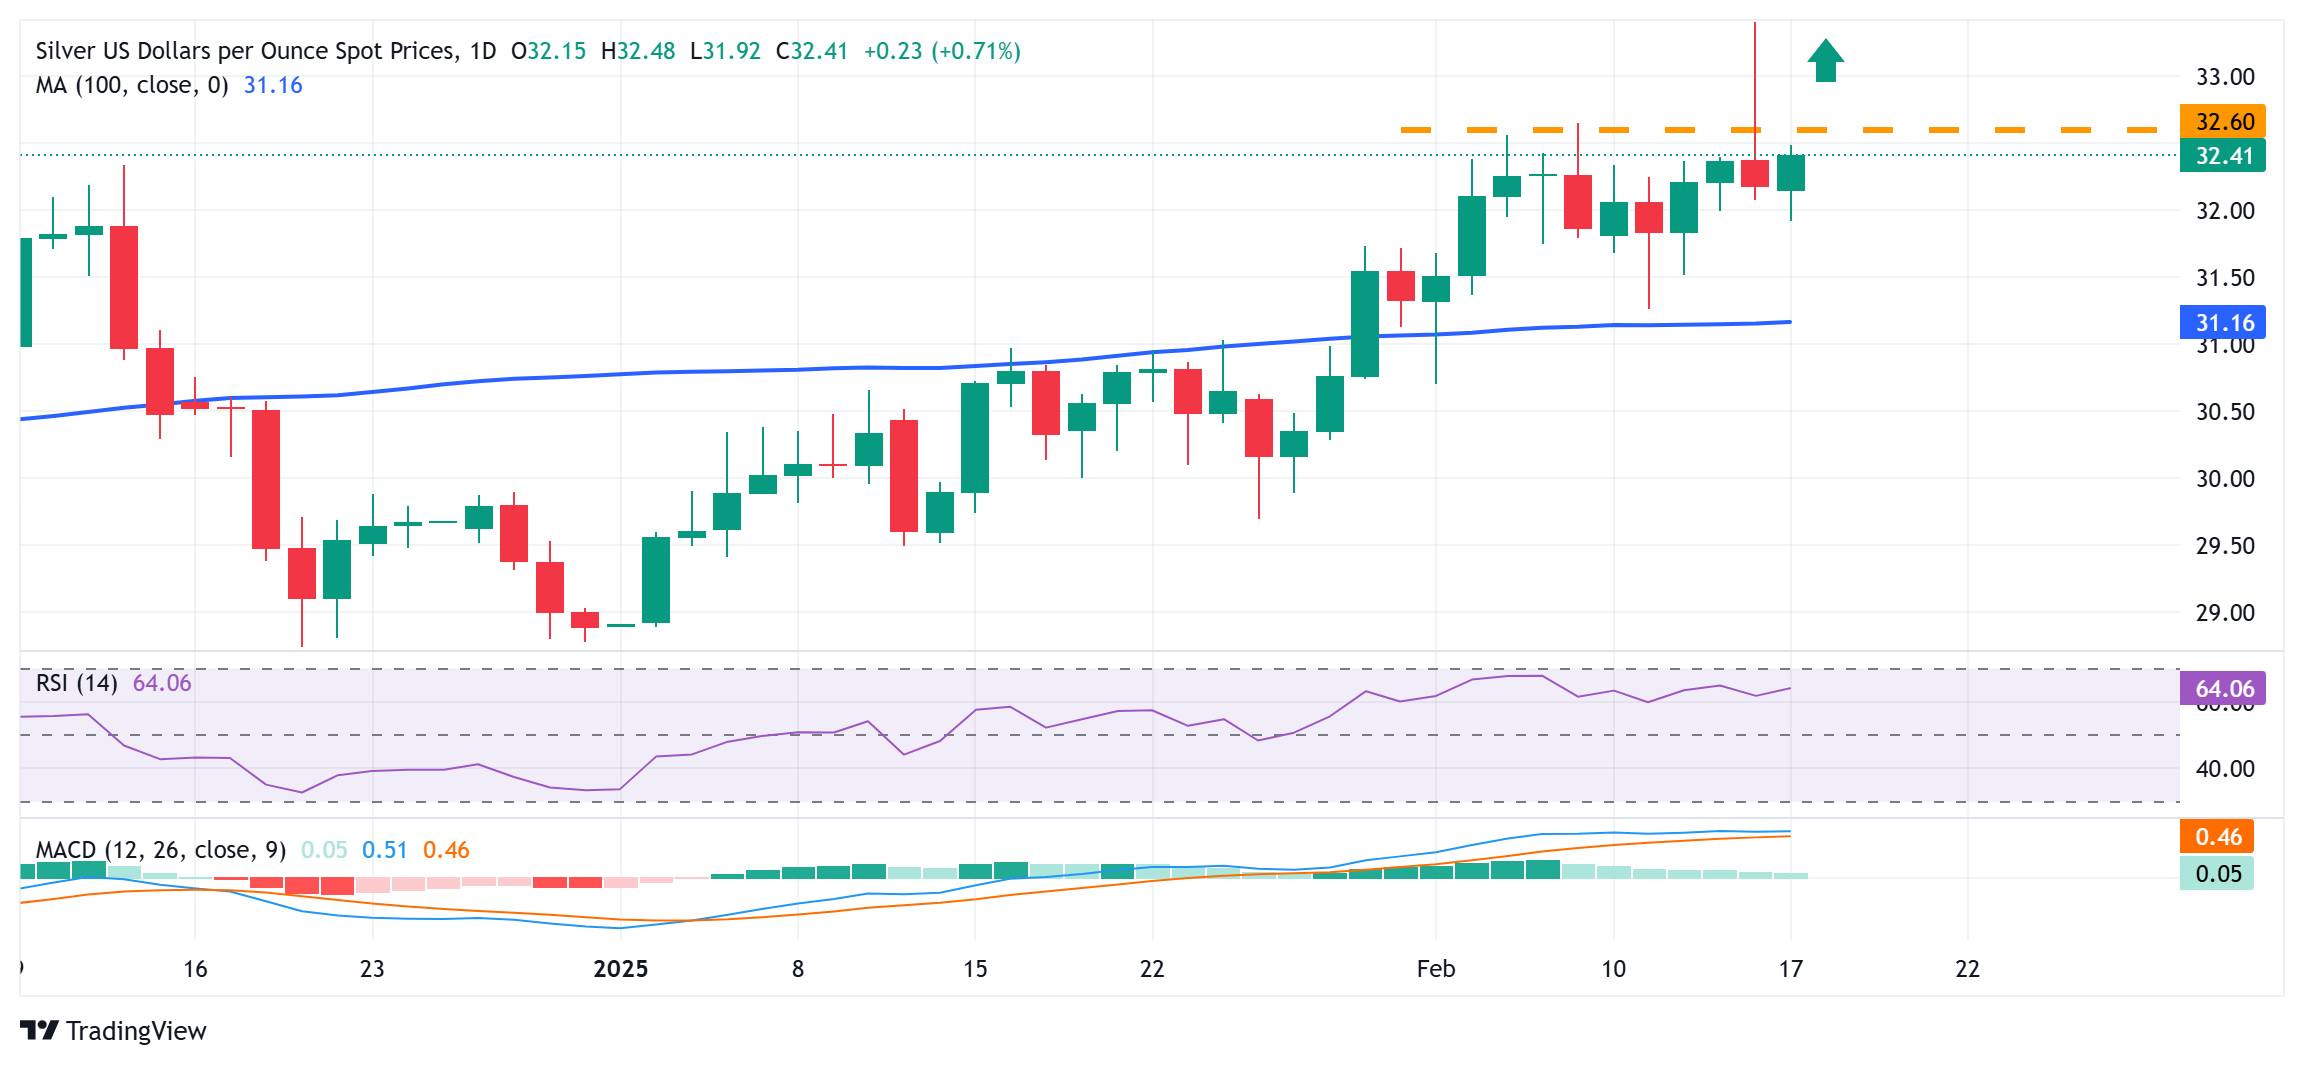
From a technical perspective, the recent breakout through the 100-day Simple Moving Average (SMA) and the emergence of fresh buying on Monday favor bullish traders. Moreover, positive oscillators on the daily chart suggest that the path of least resistance for the XAG/USD remains to the upside. That said, it will still be prudent to wait for some follow-through strength beyond the $32.55 horizontal barrier before positioning for any further gains.
The XAG/USD might then aim to conquer the $33.00 round figure and climb further towards retesting Friday’s swing high, around the $33.35-$33.40 region. The momentum could extend further towards the $34.00 mark en route to the next relevant hurdle near the $34.45 zone and the $35.00 neighborhood, or the multi-year peak touched in October.
On the flip side, weakness below the Asian session low, around the $31.90 area, might still be seen as a buying opportunity and remain limited near the 100-day SMA, currently pegged near the $31.20 region. Some follow-through selling, leading to a slide below the $31.00 mark, might shift the near-term bias in favor of bearish traders and pave the way for deeper losses. The XAG/USD might then test the $30.25 support before eventually dropping to the $30.00 psychological mark en route to the $29.55-$29.50 horizontal zone.
Silver daily chart