Arista Networks Down After Release of Q4 Results

Arista Networks (ANET.US) reported results that exceeded expectations, delivering the highest revenue growth in five quarters. Additionally, the company reiterated its forecasts for 2025. Despite this, in the initial market reaction, pre-market trading showed slight declines. Investors are concerned about the company’s strong revenue concentration from Big Tech companies.
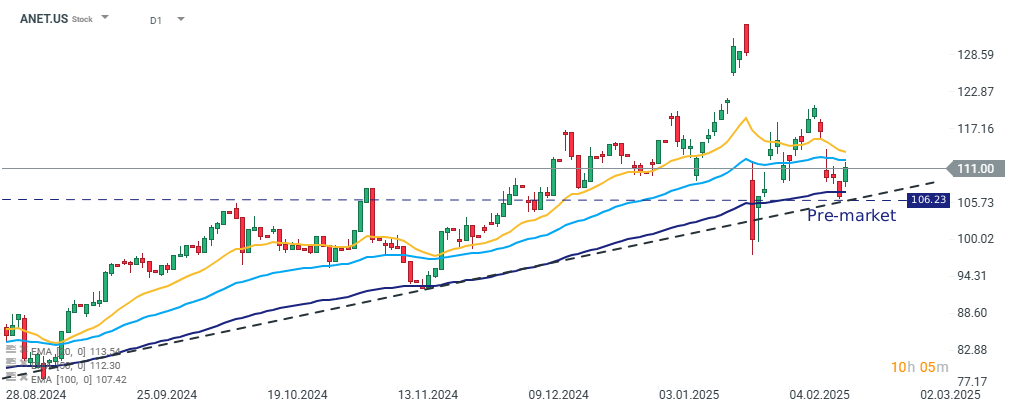
Pre-market trading stopped at a key support level defined by the lower boundary of the upward trend that has been in place since mid-2024. Source: xStation
The company exceeded market expectations in all key metrics. It reported revenues of $1.93 billion, representing a 25% year-over-year increase. Arista’s dynamic revenue growth began in 2022, but in the second half of 2023, the high base effect contributed to a slowdown in growth. As a result, the 4Q24 reading marks the highest revenue growth since 3Q23, and the company reached another record sales level.
At the same time, cost of revenue grew at a faster pace than revenue, causing a 1.3 percentage point decline in the operating margin compared to 4Q23. Despite this, the 47% margin remains 2 percentage points above expectations.
For 2025, the company reaffirmed its previous forecasts, expecting 17% revenue growth year-over-year, which would bring revenues to $8.2 billion. This projection seems somewhat conservative and has cast some doubt on Big Tech spending (particularly by Microsoft and Meta) on generative artificial intelligence development. Given Arista’s increasing revenue concentration in this segment, investors fear that a potential slowdown in spending by key players could threaten the company’s ability to sustain high growth rates.
4Q24 RESULTS
- Adjusted EPS: $0.65 (est. $0.57)
- Revenue: $1.93 billion (+25% y/y) (est. $1.9 billion)
- Product revenue: $1.61 billion (+23% y/y) (est. $1.6 billion)
- Service revenue: $322.3 million (+40% y/y) (est. $294.5 million)
- Cost of revenue: $699.4 million (+29% y/y) (est. $688.3 million)
- Product cost of revenue: $643.6 million (+30% y/y) (est. $633.7 million)
- Service cost of revenue: $55.8 million (+23% y/y) (est. $58.6 million)
- Adjusted operating margin: 47% vs. 48.3% a year earlier (est. 44.9%)
- Adjusted gross margin: 64.2% vs. 65.4% a year earlier
The material on this page does not constitute financial advice and does not take into account your level of understanding, investment objectives, financial situation or any other specific needs. All information provided, including opinions, market research, mathematical results and technical analyzes published on the Website or transmitted To you by other means, it is provided for information purposes only and should in no way be construed as an offer or solicitation for a transaction in any financial instrument, nor should the information provided be construed as advice of a legal or financial nature on which any investment decisions you make should be based exclusively To your level of understanding, investment objectives, financial situation, or other specific needs, any decision to act on the information published on the Website or sent to you by other means is entirely at your own risk if you In doubt or unsure about your understanding of a particular product, instrument, service or transaction, you should seek professional or legal advice before trading. Investing in CFDs carries a high level of risk, as they are leveraged products and have small movements Often the market can result in much larger movements in the value of your investment, and this can work against you or in your favor. Please ensure you fully understand the risks involved, taking into account investments objectives and level of experience, before trading and, if necessary, seek independent advice.