- AUD/JPY weakens to around 96.55 in Monday’s early Asian session, down 0.24% on the day.
- The cross keeps the negative outlook below the 100-day EMA with a bearish RSI indicator.
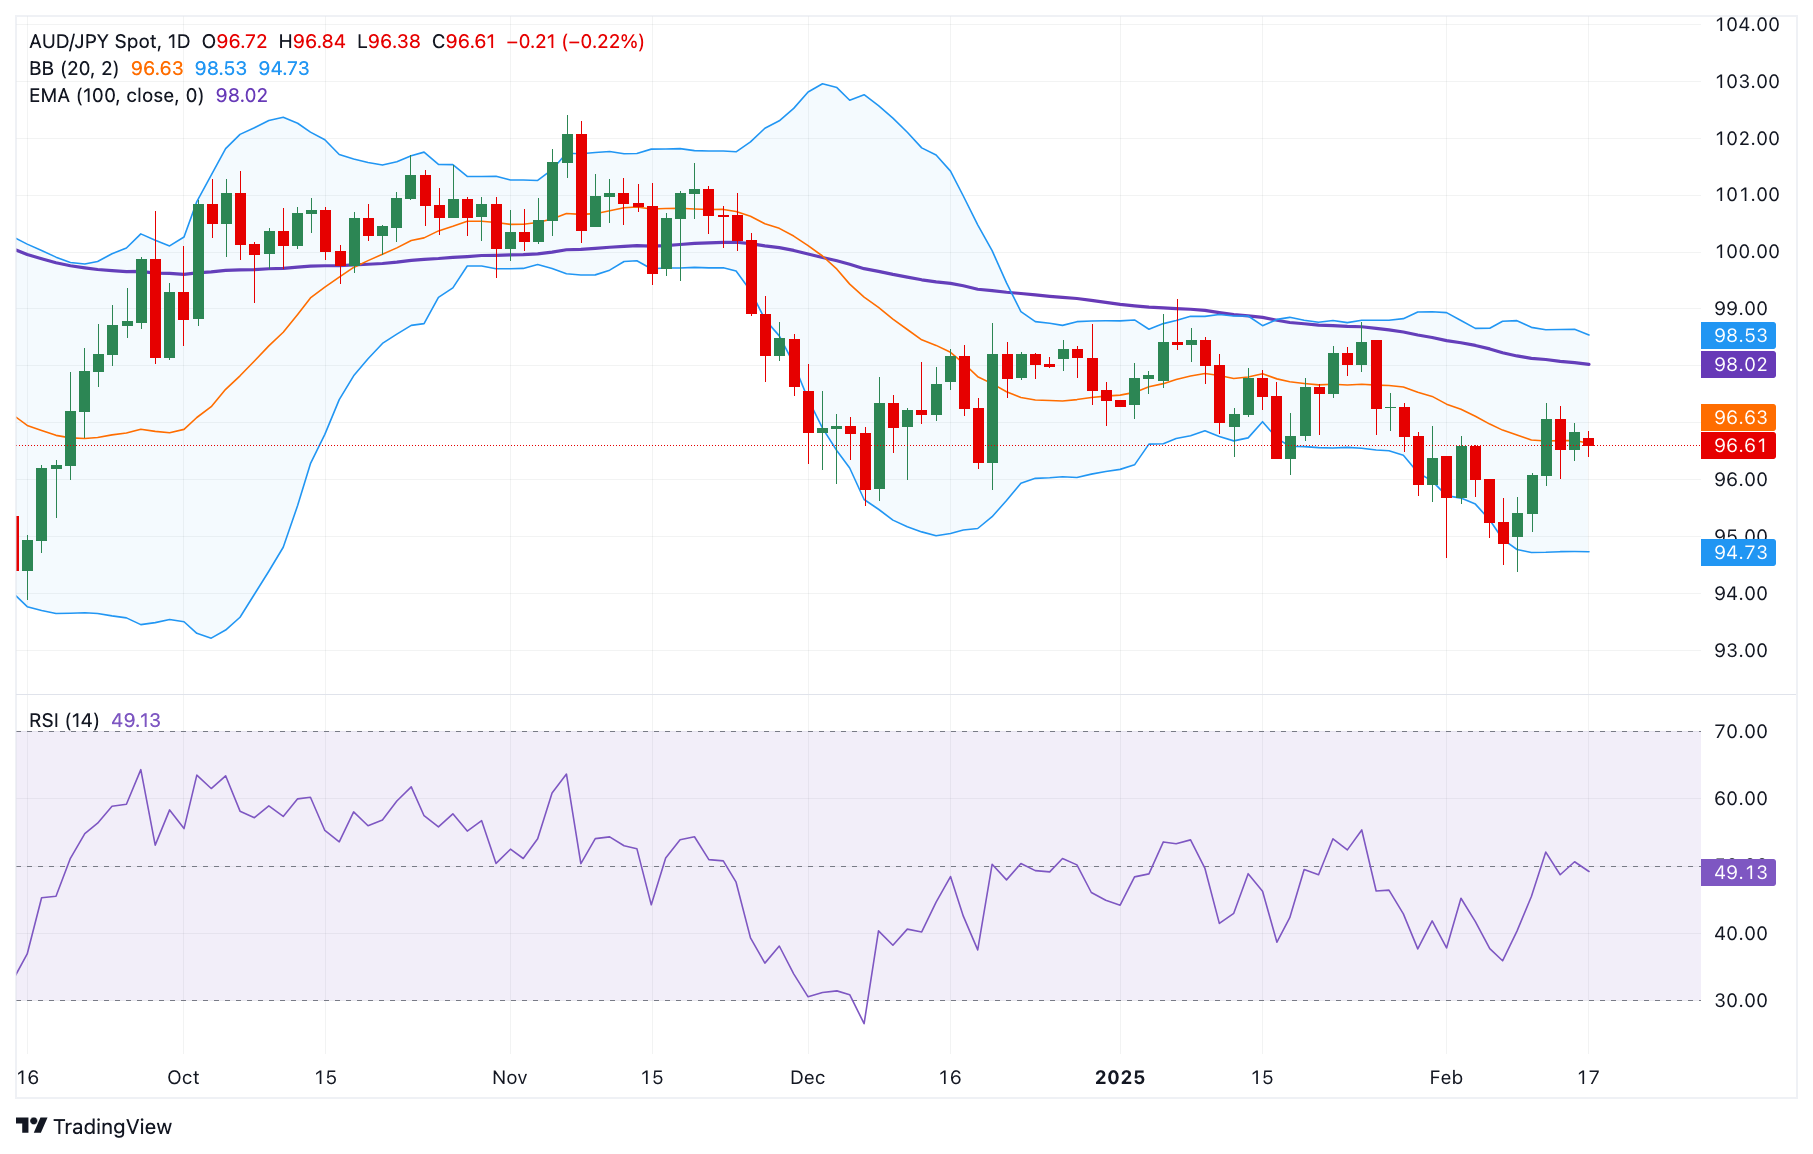
- The initial support emerges at 94.72; the first upside barrier is located at 98.02.
The AUD/JPY cross attracts some sellers to near 96.55 during the Asian trading hours on Monday. The Japanese Yen (JPY) strengthens as Japan’s economy grew faster than expected in the fourth quarter (Q4), triggering the expectation that the Bank of Japan (BoJ) will hike interest rates further.
Japan’s Gross Domestic Product (GDP) expanded by 0.7% QoQ in Q4, compared to the previous reading of 0.3%, preliminary data showed on Monday. This figure came in stronger than the expectation of 0.3%.
According to the daily chart, the bearish outlook of AUD/JPY remains in play as the cross remains capped below the key 100-day Exponential Moving Average (EMA). Furthermore, the downward momentum is supported by the Relative Strength Index (RSI), which is located below the midline, suggesting that the path of least resistance is to the downside.
The first downside target for the cross emerges at 94.72, the lower limit of the Bollinger Band. Extended losses could see a drop to 93.59, the low of September 11, 2024. A decisive break below the mentioned level could pave the way to 92.79, the low of August 18, 2023.
On the bright side, the 100-day EMA at 98.02 acts as an immediate resistance level for the cross. Sustained trading above this level could attract some buyers to 98.53, the upper boundary of the Bollinger Band. Further north, the next hurdle is seen at 99.17, the high of January 7.
AUD/JPY daily chart