Bitcoin, Ethereum, Ripple: BTC, ETH and XRP volatility spike expected around US CPI release

- Bitcoin price hovers around $82,700 on Wednesday after recovering 5.52% the previous day.
- Ethereum price hovers around its weekly support of $1,900; a firm close below would suggest a further correction.
- XRP finds support around its daily level of $1.96, indicating a recovery on the cards.
Bitcoin (BTC) price hovers around $82,700 on Wednesday after recovering 5.52% the previous day. Ethereum (ETH) price shows weakness while Ripple (XRP) price shows signs of recovery as these coins expect volatility around the US Consumer Price Index (CPI) data release on Wednesday.
Bitcoin hints at recovery as its RSI indicator bounces off oversold conditions
Bitcoin price broke below its 200-day EMA at $85,664 on Sunday and declined 9.14% until the next day. However, BTC retested, found support around the $78,258 level, and recovered 5.52% on Tuesday. At the time of writing on Wednesday, it hovers at around $82,700.
If BTC continues to correct and closes below $78,258 (February 28 low), it could extend the decline to retest its next support level at $73,072.
The Relative Strength Index (RSI) on the daily chart reads 40, pointing upwards after bouncing off from 30 on Monday, indicating fading bearish momentum and a potential shift from oversold conditions. However, the RSI must move above its neutral level of 50 for the recovery rally to be sustained.
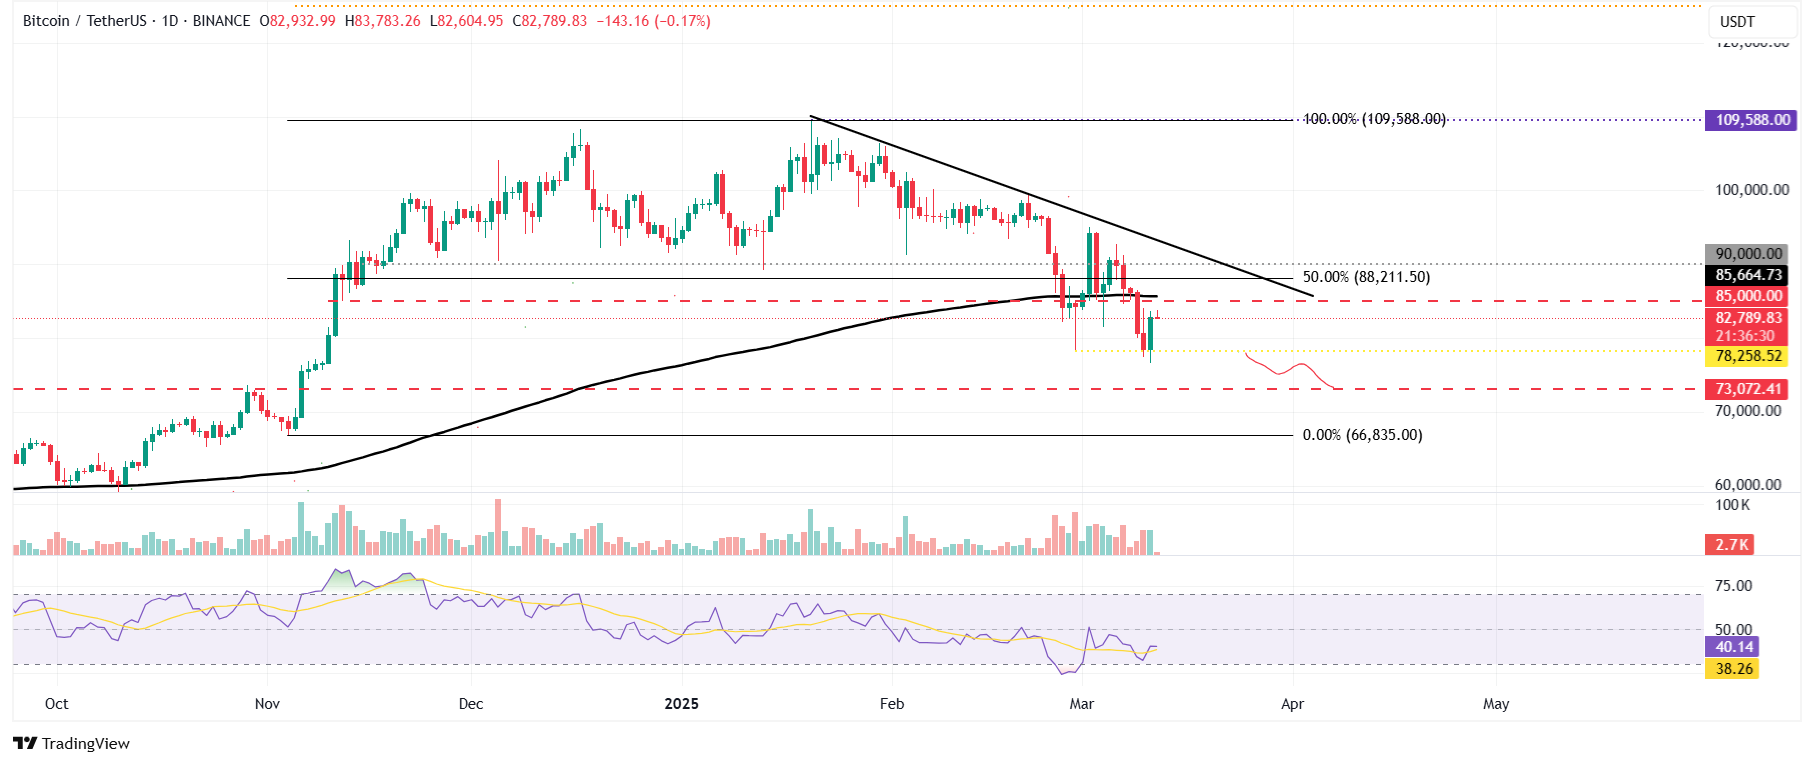
BTC/USDT daily chart
If bullish momentum mounts, BTC could extend the recovery to $85,000.
Ethereum price momentum indicator displays weakness
Ethereum price declined 7.69% on Monday; however, it recovered 3.13% the next day and closed above the weekly support level at $1,905. At the time of writing on Wednesday, it hovers around the weekly level of $1,905.
If ETH continues to decline and closes below the $1,905 level, it could extend the correction to retest its next support level at $1,700.
The RSI on the daily chart reads 32, pointing downwards to its oversold level of 30, indicating strong bearish momentum.
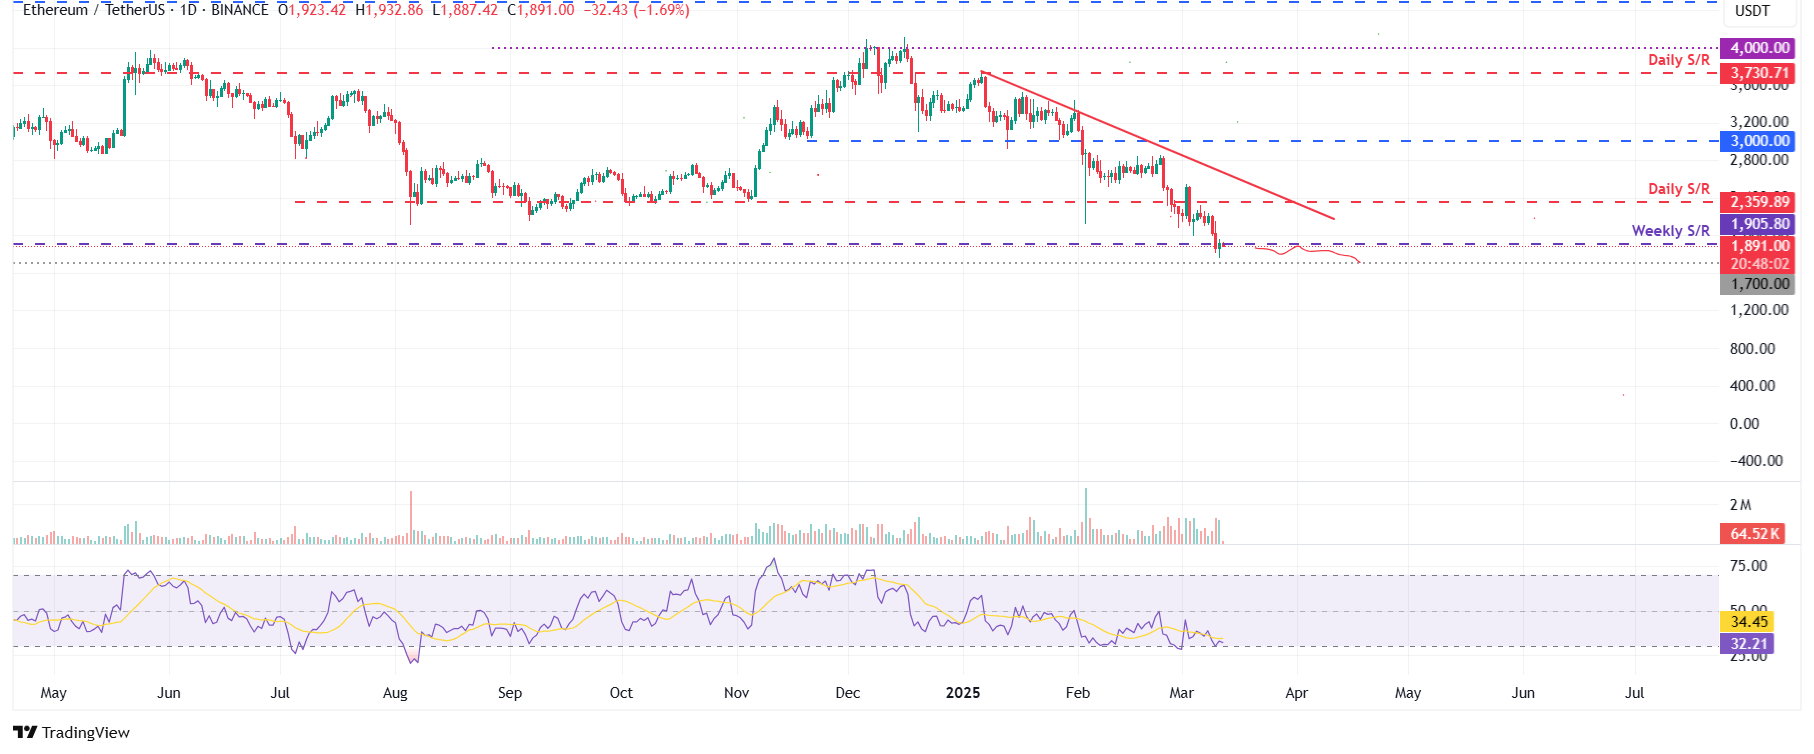
ETH/USDT daily chart
On the other hand, if ETH recovers, it could extend the recovery to test its next daily resistance at $2,359.
Ripple could recover if its $1.96 level continues to hold as support
Ripple price retested its daily support of $1.96 on Tuesday, and it recovered 7.40%. At the time of writing on Wednesday, it continues to recover, trading at around $2.20.
If XRP continues to recover, it could extend the recovery to test its next resistance level at $2.72.
The RSI on the daily chart reads 44 and points upwards toward its neutral level of 50, indicating fading bearish momentum. However, the RSI must move above its neutral level of 50 for the recovery rally to be sustained.
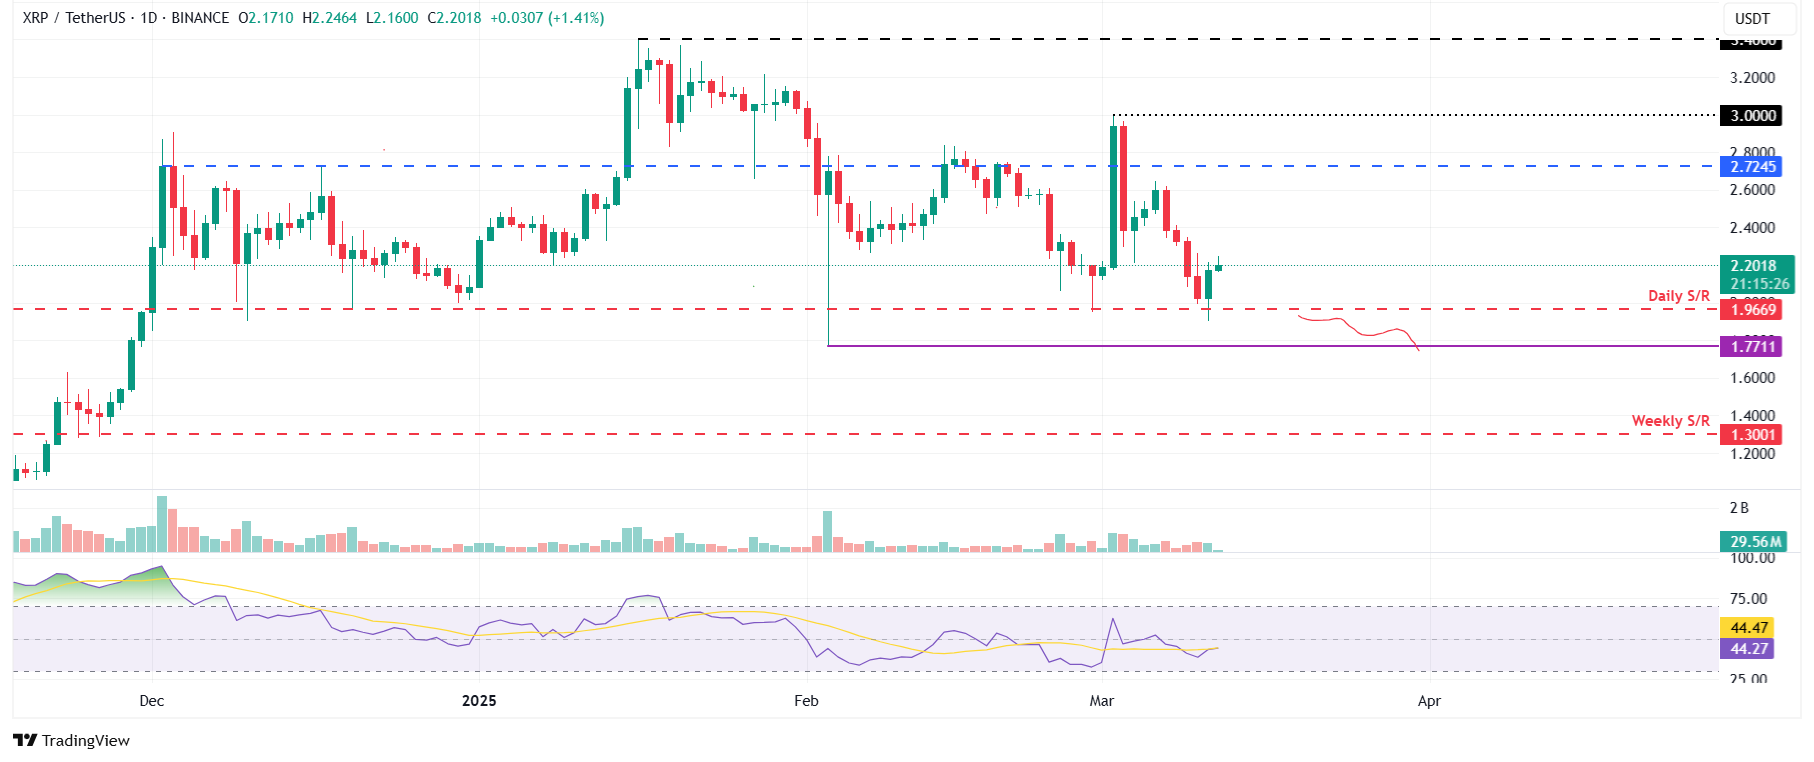
XRP/USDT daily chart
However, if XRP faces a correction and closes below $1.96 daily support, it could extend an additional decline to test its February 3 low of $1.77.