Bitcoin Weekly Forecast

- Bitcoin continued its rally this week and rose to within touching distance of the 100K landmark level on Friday.
- Bitcoin spot ETFs saw an inflow totaling $2.84 billion until Thursday, while ETF options trading was also launched.
- Standard Chartered’s analyst expects Bitcoin to hit $125K by the end of the year, fueled by expectations of positive regulatory changes in the United States.
Bitcoin (BTC) reached a new all-time high of $99,419, just inches away from the $100K milestone and has rallied over 9% so far this week. This bullish momentum was supported by the rising Bitcoin spot Exchange Traded Funds (ETF), which accounted for over $2.8 billion inflow until Thursday. BlackRock and Grayscale’s recent launch of the Bitcoin ETF options also fueled the rally this week.
Moreover, the Global Head of Digital Assets Research at Standard Chartered told FXStreet that he expects Bitcoin to reach $125K by the end of this year and $200K by the end of 2025.
Standard Chartered predicts Bitcoin will reach $125K by year-end
Bitcoin price reached a new high of $99,419 on Friday, just over 0.5% from its $100K milestone. According to CoinMarketCap, Bitcoin is increasingly recognized as a legitimate asset class and has become the world’s seventh-largest asset with a market capitalization of $1.94 trillion. This mainstream acceptance attracts new investors, including those who have never bought Bitcoin before.
Geoff Kendrick, Global Head of Digital Assets Research at Standard Chartered, told FXStreet that he expects Bitcoin to reach $125K by the end of this year and $200K by the end of 2025.
“The main story for the run-up in the last few weeks has been Donald Trump winning the White House and also the Republicans having a clean sweep. And so because of that, there should be a lot of positive regulatory changes that come fairly quickly after Trump takes the seat on January 20,” he said.
Kendrick said that chances of a pullback exist before the year ends, although any correction should be supported by the strong ETF inflows seen recently. “You can certainly argue when something goes up 30%, you can have pullbacks because markets can get a little bit ahead of themselves (…) The ETFs are kind of buying on any dip, so that should help cushion any sell-offs.”
Bitcoin institutional demand strengthens
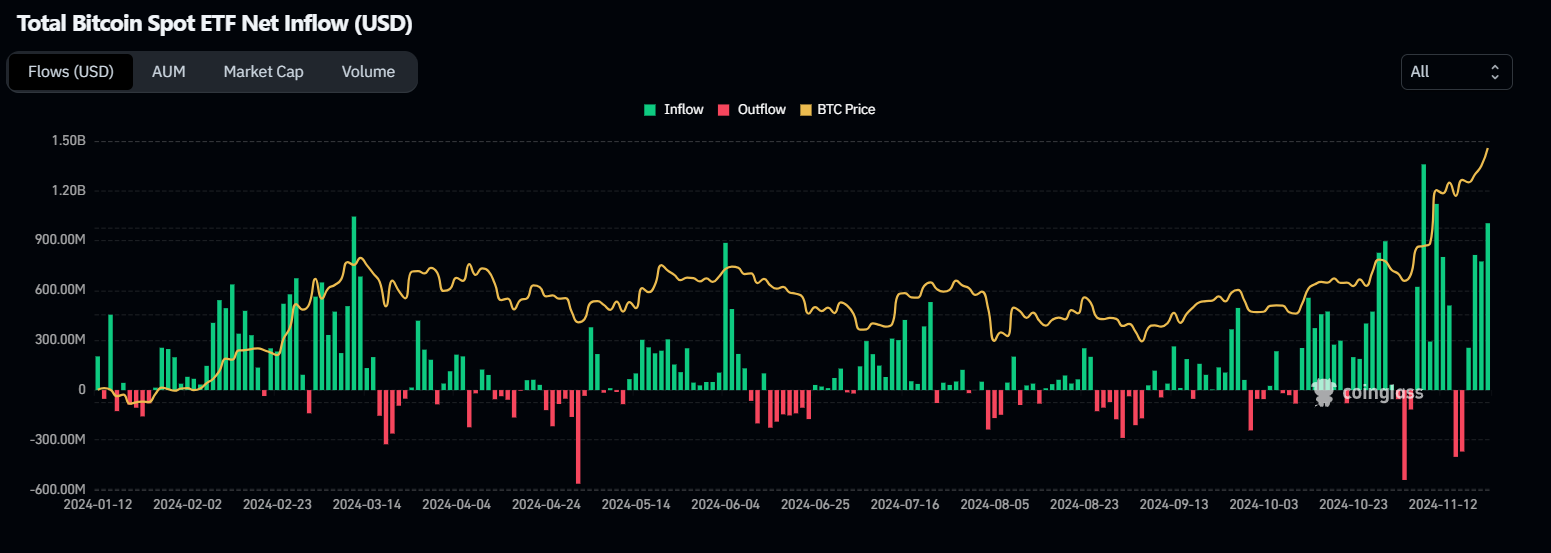
Institutional demand for Bitcoin also supported its price so far this week. According to Coinglass data, Bitcoin spot ETFs saw an inflow totaling $2.84 billion until Thursday, compared to $1.78 billion the previous week. If this inflow trend persists or accelerates, it could provide additional momentum to the ongoing Bitcoin price rally.


Bitcoin Spot ETF Net Inflow chart. Source: Coinglass
The ongoing rally is further fueled by whale accumulation. Lookonchain data shows that whale’s wallets accumulated 2,895 BTC worth $282.5 million in 9 different wallets on Thursday, while other whales accumulated 3,289 BTC worth $302 million from Binance this week.
Data Nerd shows another whale accumulated 1,109 BTC worth $104.39 million from Binance and Coinbase exchanges on Wednesday and currently holds 2,219 BTC worth $212.41 million, all reflecting strong demand for Bitcoin.
QCP’s Thursday report highlights aggressive demand for March and June call options, reflecting growing long-term bullish sentiment fueled by optimism around Bitcoin’s rising corporate adoption and increasing capital inflows into the crypto market.
The report continued said: “MicroStrategy is expected to raise $2.6 billion to purchase more Bitcoin, with MSTR surpassing a $100 billion market cap and topping US trading volume. Several corporate treasuries are following the likes of MicroStrategy by adding Bitcoin to their reserves, with Acurx Pharmaceuticals reported to have purchased up to $1 million worth of Bitcoin.”
“As we continue to see strong demand for BTC alongside further easing of monetary policy by global central banks, BTC prices are likely to remain supported as we approach the end of the year,” says QCP’s analyst.
Bitcoin derivatives market adds fuel to the rally
The Bitcoin derivatives market also supported its rally this week. Professional-grade cryptocurrency derivatives platform Deribit shows that BTC’s three out of seven futures contracts traded higher than $100,000. Contracts expiring on March 28, 2025, trade at $103,772, a premium of nearly 5% to the average spot price of $98,800. The pricing reflects investors’ confidence that the spot price will remain well above $100,000 through the end of March and beyond.

Bitcoin Futures Contract chart. Source: Debit
In addition to the futures market, the recent launch of the Bitcoin ETF options this week supports the ongoing rally. BlackRock launched its BTC spot ETF options (IBIT) on Tuesday, followed by Grayscale introducing its Bitcoin ETF options on Wednesday. This market response will likely attract new investor cohorts and enable diversified trading strategies, which could help reduce volatility and downside risk, solidifying Bitcoin’s place in mainstream markets. Other BTC spot ETFs, such as the Fidelity Wise Origin Bitcoin Fund (FBTC), are expected to have options listed soon, according to digital assets firm QCP Capital.
How high can Bitcoin go?
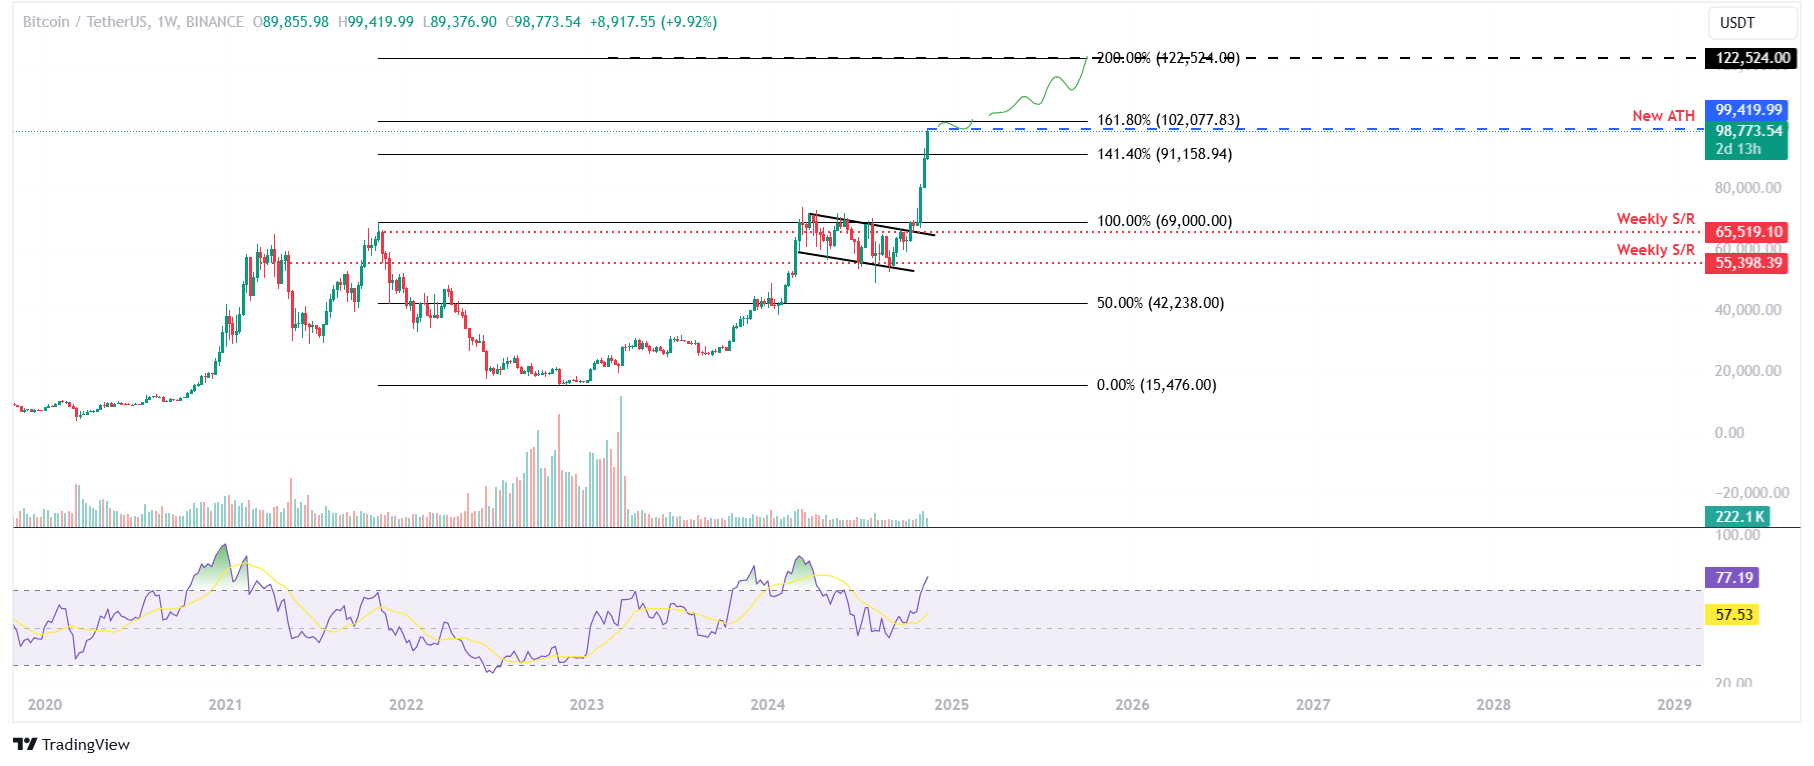
Bitcoin’s weekly chart shows that the biggest crypto asset by market capitalization reached a new all-time high of $99,419 on Friday and is currently trading above $98,700. If BTC continues its upward momentum, it could extend the rally to retest the significant psychological level of $100,000.
Bitcoin could enter a price discovery mode, with Fibonacci extension levels projecting potential targets at $102,077 and $122,524, based on its Fibonacci extension levels of 161.8% and 200%, respectively (drawn from November 2021 high of $69,000 to November 2022 low of $15,476), provided bullish momentum remains strong.
However, the weekly chart’s Relative Strength Index (RSI) momentum indicator stands at 77, signaling overbought conditions and suggesting an increasing risk of a correction. Traders should exercise caution when adding to their long positions, as the RSI’s move out of the overbought territory could provide a clear sign of a pullback.

BTC/USDT daily chart
If Bitcoin faces a pullback, it could decline to retest its key psychological level of $90,000.


