- EUR/USD consolidates last week’s strong gains to a nearly three-week high.
- The technical setup favors bulls and supports prospects for additional gains.
- Weakness below the 1.0465 support could pave the way for deeper losses.
The EUR/USD pair struggles to capitalize on its gains registered over the past four days and oscillates in a narrow trading band, just below the 1.0500 psychological mark during the Asian session on Monday. Spot prices, however, remain close to a nearly three-week high touched on Friday amid a weaker US Dollar (USD).
From a technical perspective, acceptance above the 38.2% Fibonacci retracement level of the November-January fall and positive oscillators on the daily chart favor bullish traders. Hence, a subsequent strength towards testing the 1.0545-1.0555 confluence, comprising the 50% retracement level and the 100-day Exponential Moving Average (EMA), looks like a distinct possibility.
Some follow-through buying should pave the way for additional gains and assist the EUR/USD pair to reclaim the 1.0600 mark. Spot prices might then climb to the December 2024 swing high, around the 1.0630 area, which nears the 61.8% Fibo. level. A sustained strength beyond will set the stage for an extension of the recent recovery from over a two-year low touched in January.
On the flip side, the 38.2% Fibo. level, around the 1.0465 region, now seems to protect the immediate downside. A convincing break below could drag the EUR/USD pair towards the 1.0400 round figure en route to mid-1.0300s (23.6% Fibo. level). Failure to defend the said support levels might shift the bias back in favor of bearish traders and expose the 1.0200 round-figure mark.
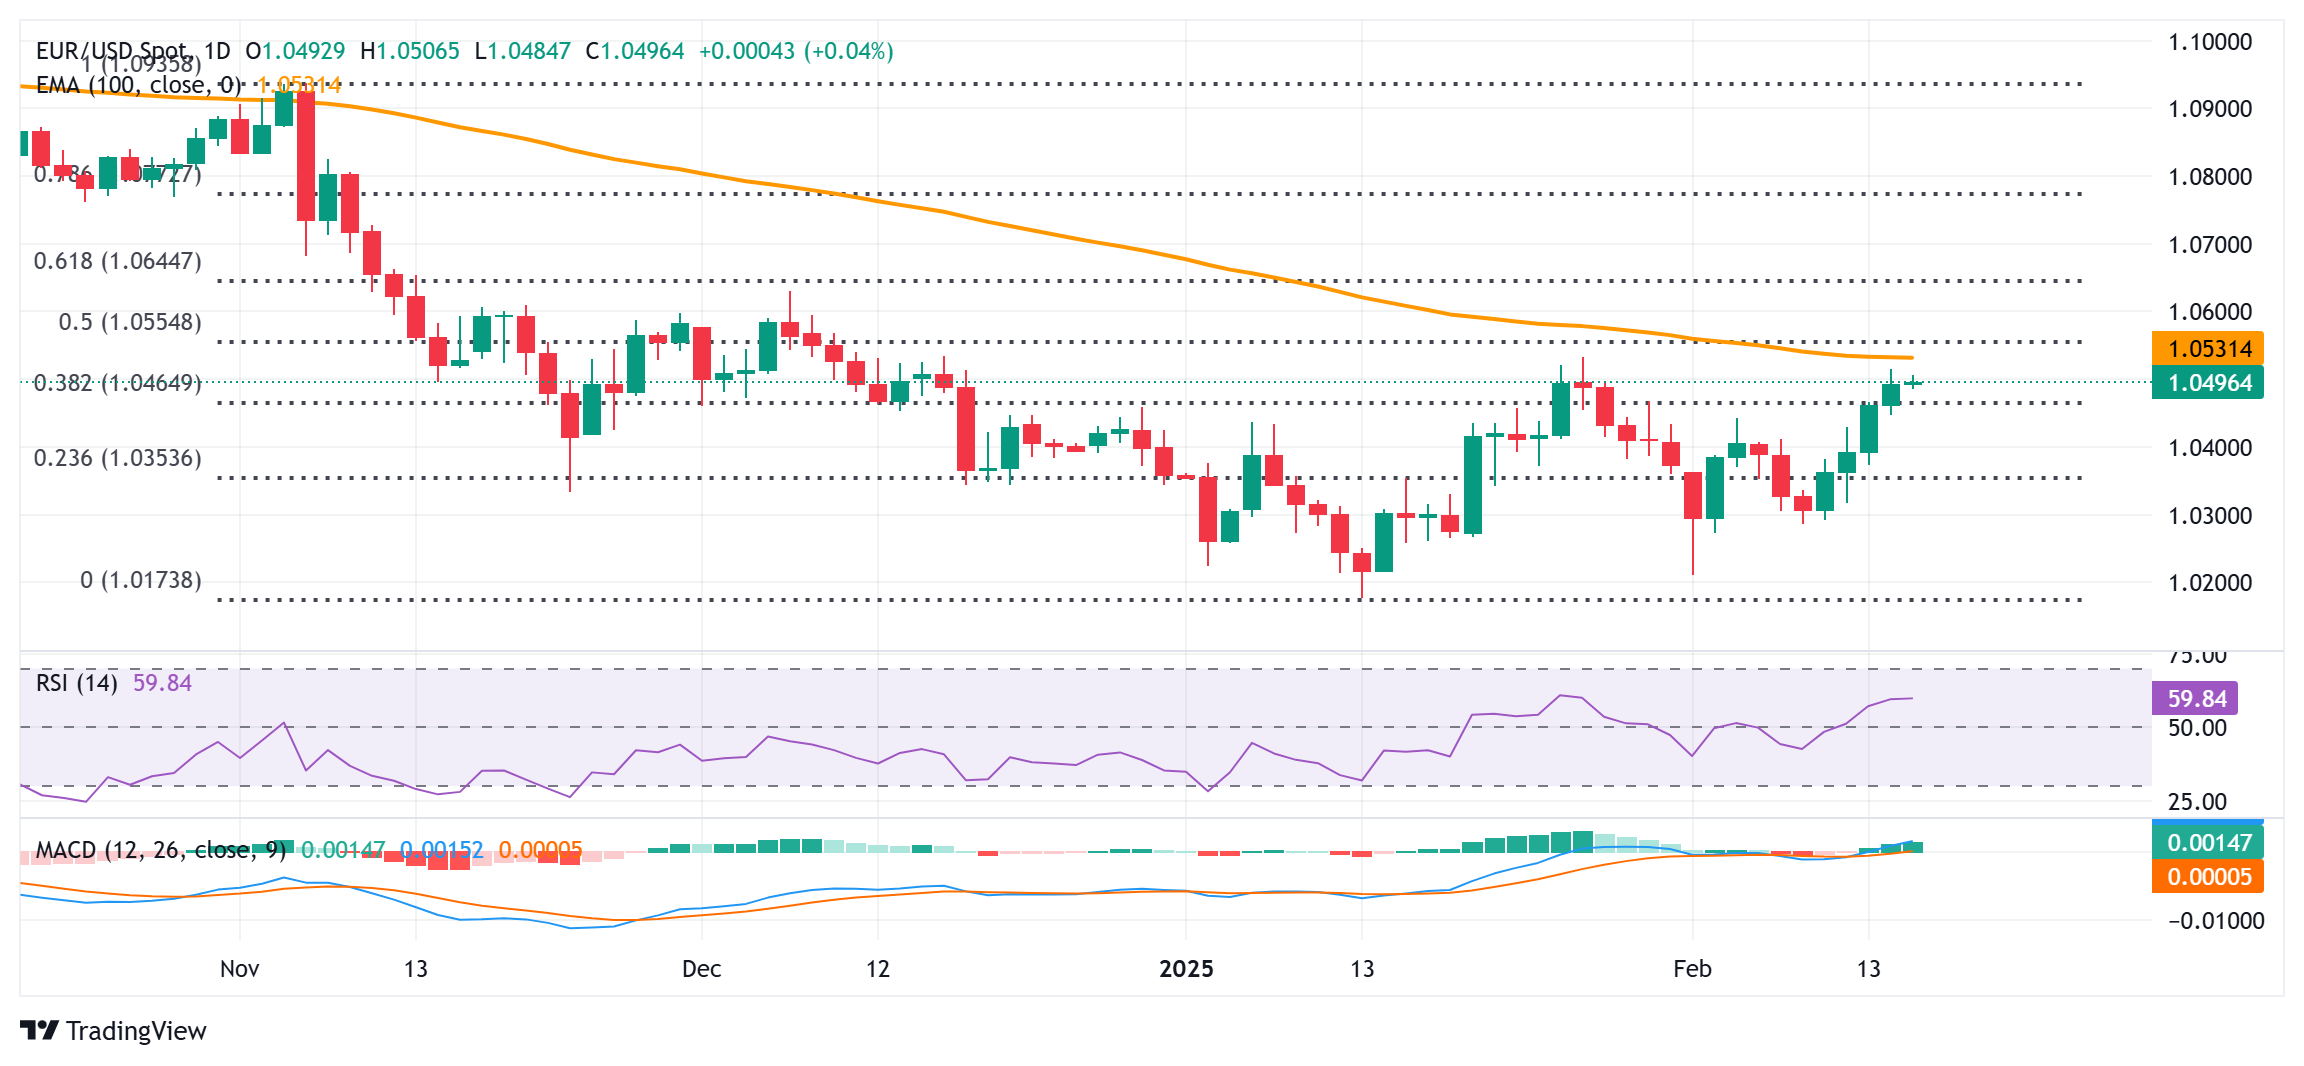
EUR/USD daily chart