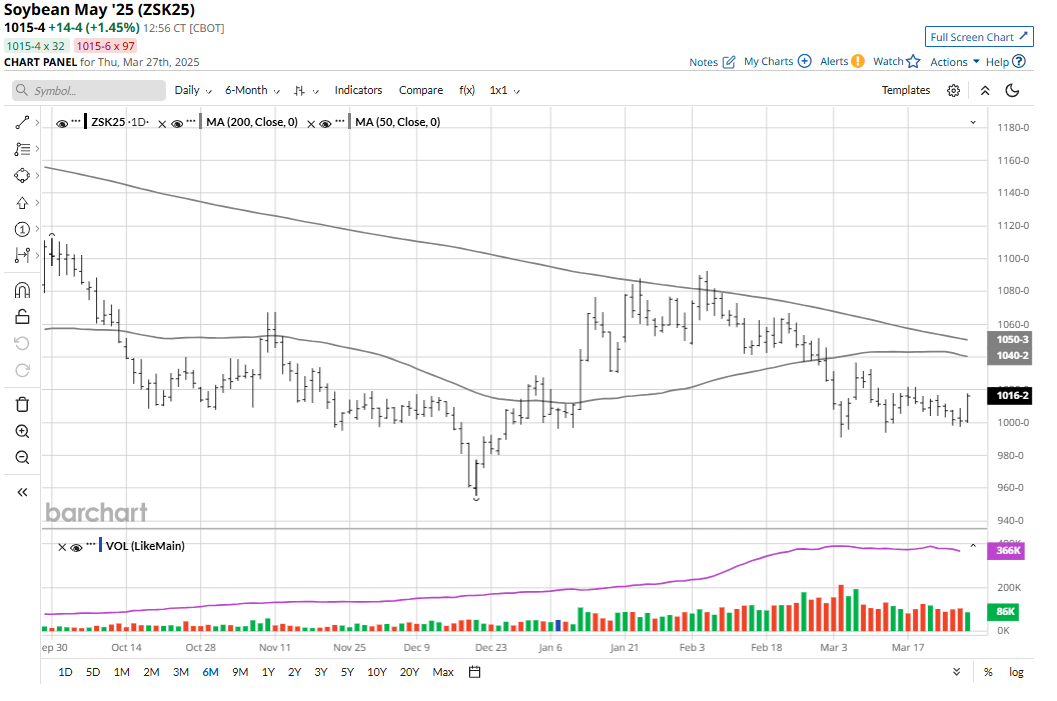
The U.S. Department of Agriculture will release its planting intentions and quarterly grain stocks reports on Monday, March 31 as 12:00 p.m. Eastern. This release will make Monday one of the most important grain-trading days of the year. History shows this report day to be a potential tone-setter in the grain and cotton markets for weeks to come — until the U.S. corn (ZCK25), soybean (ZSK25) and cotton (KGK25) crops are in the ground and growing, and the winter wheat (KEK25) crops are maturing. The agency’s quarterly grain stocks report will provide updates on the domestic and global supply and demand balance sheets for grains.


Window-Dressing Monday
Monday is also a very important day for technical traders and the big managed money, or “fund,” traders. It’s the last trading day of the month and of the quarter, which means many fund managers will be doing “window- dressing” trades for their first-quarter performance record. Monday is also a key trading day for those who watch the technical charts closely.


Here’s Your “Cheat Sheet” for Monday’s USDA Data
The following are the averages of forecasts for key elements of the two USDA reports, per a survey of analysts released by Reuters earlier this week.
- U.S. corn planted acreage this year is seen by the trade at 94.361 million, which compares to the 2024 USDA acreage figure of 90.594 million, and 94 million acres forecast by USDA at its Ag Outlook Forum in February.
- U.S. soybean planted acreage this year is forecast by the trade at 83.762 million, compared to the 2024 USDA acreage number of 87.050 million and the Ag Outlook Forum number of 84 million.
- U.S. all-wheat planted acres are seen by the trade at 46.475 million, versus the 2024 USDA figure of 46.079 million and the Ag Outlook number of 47 million.
For the quarterly grain stocks report, the Reuters survey showed the following U.S. stockpiles average trade forecasts, as of March 1.
- U.S corn stocks at 8.151 billion bushels, compared to 8.352 billion in March 2024 and 12.074 billion as of Dec. 1, 2024.
- U.S. soybean stocks of 1.901 billion bushels on March 1, compared to 1.845 billion bushels at the same time last year and 3.1 billion bushels on Dec. 1, 2024.
- U.S. wheat stocks of 1.215 billion bushels on March 1, versus 1.089 billion bushels at the same time last year and 1.570 billion bushels on Dec. 1, 2024.
For cotton, the U.S. planted acres figure Monday is seen coming in at right around 10 million, according to talk in the industry.
How Will the Markets React in the Immediate Aftermath of Monday’s USDA reports?
My observations on the Reuters survey’s results see the potential for bearish corn price and bullish soybean price reactions to the USDA data, if the data come in as expected. However, history shows the important late-March USDA reports can produce big surprises. The wheat markets are generally followers of any big price moves in corn and/or soybeans on March planting intentions report days.
For cotton, I’m hearing the trade is leaning for a U.S. acreage number of slightly less than 10 million. Apparently, one respected cotton analytical firm has forecast U.S. cotton planted acreage at under 9 million.

How to Position Just Ahead of the Key USDA Data Monday
The way I see it, those who want to position for and trade right through the major USDA data dump on Monday should consider purchasing out-of-the-money options, according to how you see the reports playing out.
At present, the implied volatility in grain futures options is not overly high, given recent grain futures price action that has not been highly volatile, like that which occurs during weather-market scares. This means the premiums on out-of-the-money options will be cheaper, at present.
However, given that big surprises can and do occur in the late-March USDA reports, grain futures prices can very quickly become more volatile after the reports’ releases. That scenario, in turn, would quickly put more implied volatility price premium into grain futures options. The same goes for the cotton futures market.


