- The US Dollar edges lower again on Tuesday after an already downbeat day on Monday
- Traders are waking up to the US imposing tariffs and, meanwhile, already facing counterattacks from Canada and China.
- The US Dollar Index (DXY) looks for support and could break even lower on Tuesday.
The US Dollar Index (DXY), which tracks the performance of the US Dollar (USD) against six major currencies, makes another leg lower on Tuesday after United States (US) President Donald Trump confirmed that tariffs on Canada, Mexico and China were not being delayed. Markets were still doubting on Monday if President Trump would still allow an extension just before the deadline. However, it was no surprise that the US imposed the earlier committed tariffs.
Meanwhile, Canada and China have already pushed back on the US unilateral tariffs. Later Monday night, Canada’s Prime Minister Justin Trudeau announced retaliatory tariffs on US goods. “Canada will start with 25% tariffs on US imports worth C$30 billion from Tuesday,” read the statement, while tariffs on other C$125 billion of products will come into effect in 21 days.
On early Tuesday, China announced its own levy on US agricultural goods. China’s Commerce Ministry stated that it would impose additional tariffs of up to 15% on imports of key farm products, including chicken, pork, soy and beef from the US. The Ministry said that the tariffs will take effect on March 10.
Daily digest market movers: Recession or stagflation
- Recent US economic data, while US yields and the US Dollar are rolling off, suggest that the US economy could be heading into a period of slow to negative growth while inflation remains elevated due to tariffs. This is a perfect cocktail for either a recession or stagflation phase in the US economy, Bloomberg reports.
- The TechnoMetrica Institute of Policy and Politics (TIPP) Economic Optimism Index for March is due at 15:00 GMT. Expectations are that sentiment will surge to 53.1, up from 52 in February.
- Near 18:00 GMT, Federal Reserve Bank of Richmond President Thomas Barkin delivers a speech titled “Inflation Then and Now” at the Fredericksburg Regional Alliance in Fredericksburg, United States.
- Around 19:20 GMT, Federal Reserve Bank of New York President John Williams is scheduled to participate in a discussion titled “The Cautious Path for Rate Cuts” at Bloomberg Invest 2025 in New York, United States.
- Equities seem to have already priced in the recent tariff headlines. There are no major losses or gains to report, with a bit of selling pressure in Europe. US equity futures are set for a positive start.
- The CME Fedwatch Tool projects a 14.4% chance that interest rates will remain at the current range of 4.25%-4.50% in June, with the rest showing a possible rate cut.
- The US 10-year yield trades around 4.15%, further down from last week’s high of 4.574% and flirting with a five-month low.
US Dollar Index Technical Analysis: DXY not a fan of tariffs
If there is one thing very clear now, it is that both US yields and the US Dollar Index (DXY) are no fans of tariffs. The risk is now that more tariffs could hit from all sides in retaliation, which could hit the US Dollar even more as a stagflation scenario gets underway. With the yield differential between the US and other countries further narrowing, the strength of the Greenback would erode further, and the DXY could even fall back below 105.00 if sentiment continues to pick up in that direction.
On the upside, the 100-day Simple Moving Average (SMA) is the first resistance to watch for any rejection, currently at 106.87. In case the DXY can break above 107.35, the 108.00 round level is coming back in scope, with the 55-day SMA just below it.
On the downside, the 106.00 round level needs to hold as support. In case that big figure snaps, 105.89 and the 200-day SMA at 105.05 could start to be identified as the next levels on the downside.
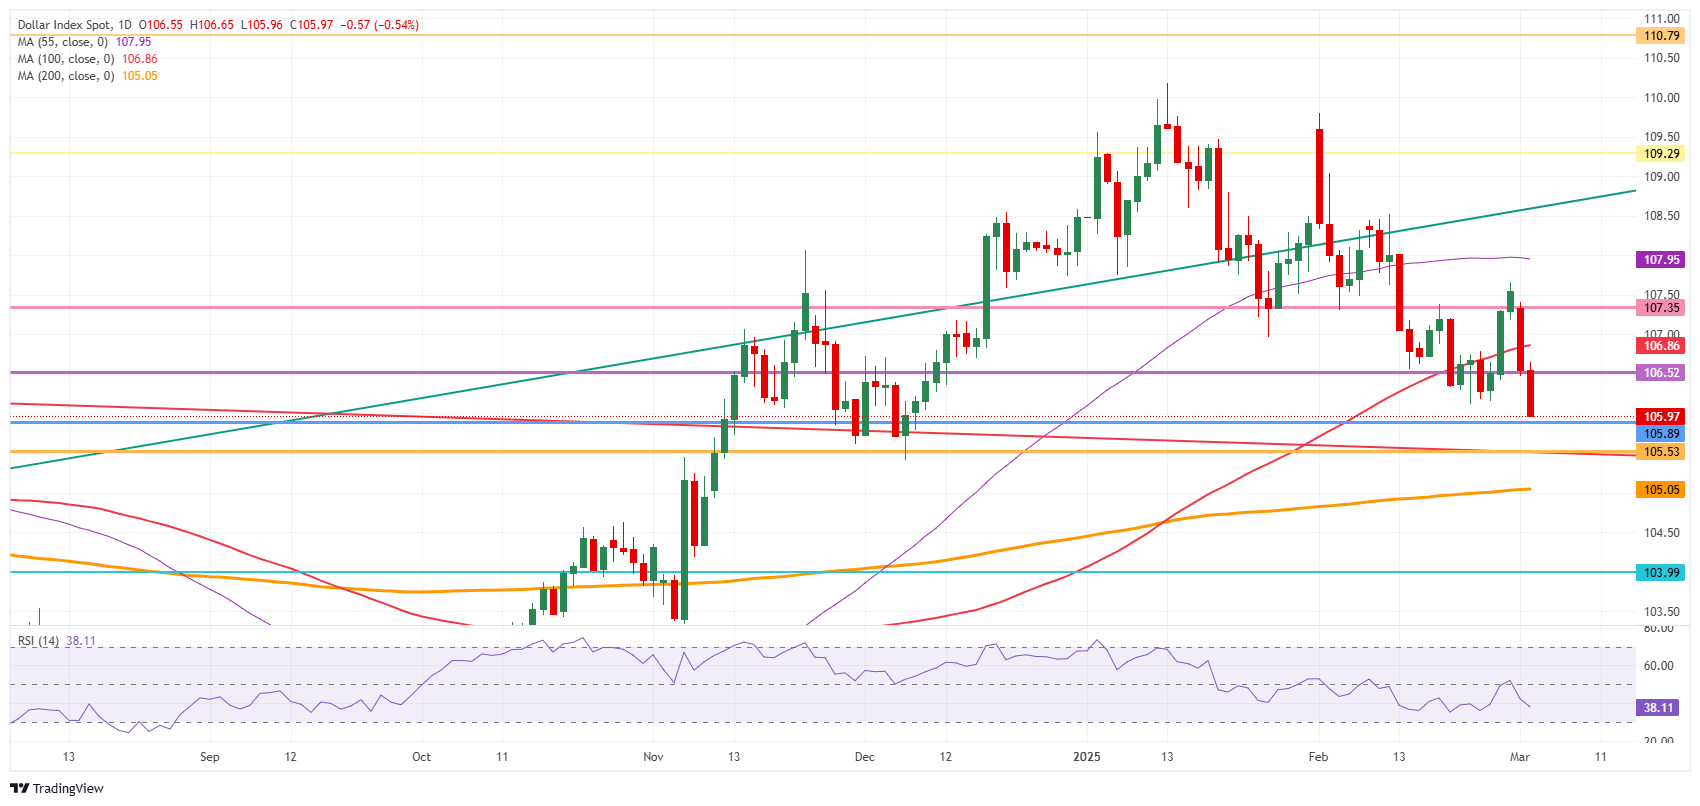
US Dollar Index: Daily Chart