US Dollar set for a weekly loss over 1.5% in horror January Retail Sales result

- The US Dollar dives lower in the US Retail Sales aftermath and is set to close out the week at a loss.
- Almost a full -1 % slide in headline Retail Sales for January spells domestic issues for President Trump.
- The US Dollar Index (DXY) drops substantially below 107.00 and is on its way to 106.50.
The US Dollar Index (DXY), which tracks the performance of the US Dollar (USD) against six major currencies, is devaluing substantially towards 106.50 at the time of writing, amounting to over 1.5% loss on the week since Monday. United States (US) President Donald Trump might be facing his first domestic challenge next to the egg-crisis, with now even US Retail Sales starting to turn over big time. With a whopping -0.9% decline in January headline sales and a surprise decline in Sales excluding cars and transportation by -0.4%, it becomes clear that the US consumer is clearling keeping his money aside for a rainy day.
The economic calendar will start to shift as of now to next week> Investors will focus on the S&P Global Purchase Managers Index (PMI) preliminary data for February due on Friday 21. Meanwhile the weekend could get interesting in case President Donald Trump releases more headlines or actions on tariffs, Ukraine or other topics.
Daily digest market movers: Retail sales look bleak
- Here are the most important data releases for this Friday:
- January Import/Export came out, with the monthly Export Price Index rising to 1.3%, beating the 0.3% expected, while the Import Price Index fcame in at 0.3%, missing the estimate from 0.4% compared to resived 0.2% in December.
- January Retail Sales shrank by 0.9% compared to the expected 0.1% contraction, a wide decline from the revised up 0.7% growth in December. Retail Sales without Cars and Transportation contracted by 0.4%, a big disappointment from the expected 0.3% growth and the revised 0.7% in the previous month.
- Equities are taking a turn for the worse and are all sliding in red numbers across the board with both European and US indices in red numbers just before the US opening bell.
- The CME FedWatch tool shows a 57.4% chance that interest rates will remain unchanged at current levels in June. This suggests that the Fed would keep rates unchanged for longer to fight against persistent inflation.
- The US 10-year yield is trading around 4.47%, a nosedive move over just two days time from this week’s high of 4.657%.
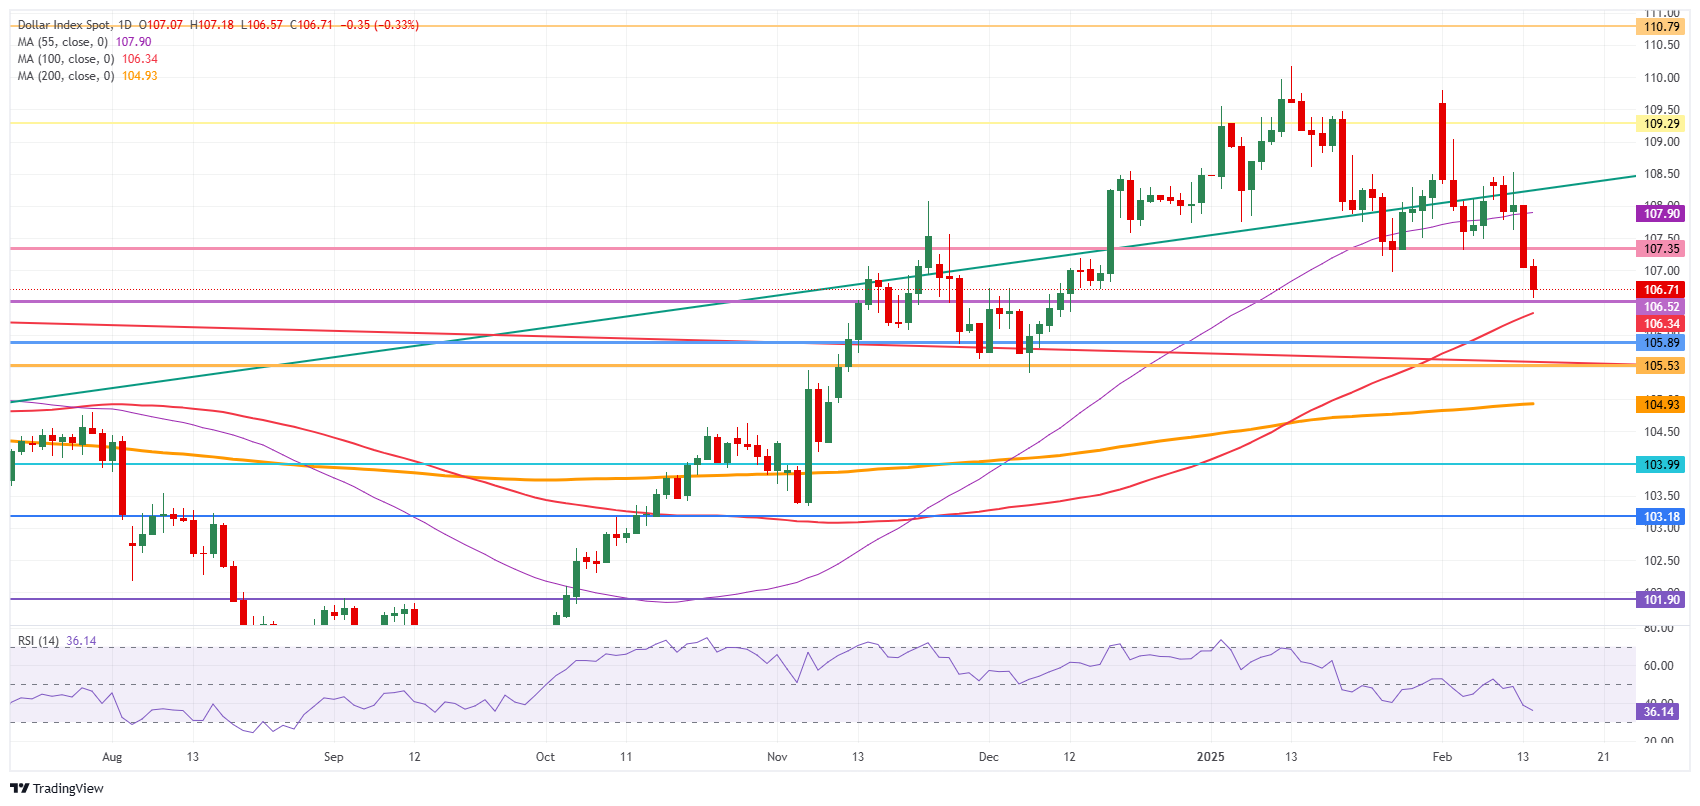
US Dollar Index Technical Analysis: Next leg lower
The US Dollar Index (DXY) is done for this week. A clear weekly loss is unavoidable, and the strong resistance at 107.35 is far away. From here, the DXY is technically handed over to the mercy of the moving averages and the Relative Strength Index (RSI), which is still bearing plenty of room for more downturn. The 200-day Simple Moving Average (SMA), trading around 104.93, might be the one to look out for.
On the upside, that previous support at 107.35 has now turned into a firm resistance. Further up, the 55-day SMA at 107.90 must be regained before reclaiming 108.00.
On the downside, look for 106.52 (April 16, 2024, high), 106.34 (100-day SMA), or even 105.89 (resistance in June 2024) as better support levels. Even though the RSI shows room for more downside, the 200-day SMA at 104.93 could be a possible outcome.