
 EUR /
EUR /  USD — Euro / US Dollar
 JPY — US Dollar / Japanese Yen
 GBP /
GBP /  AUD /
AUD /  CAD — US Dollar / Canadian Dollar
 CHF — US Dollar / Swiss Franc
 NZD /
NZD / Chart of The Day – EUR/USD
- May 4, 2026
- Posted by: Today Markets
- Categories: Competitive research, Forex, Markets, Technical Analysis

The EUR/USD exchange rate is trading around 1.1719 on Monday, and despite seemingly positive industrial data, the eurozone is sending out worrying signals. The final reading of the PMI index for the manufacturing sector stood at 52.2 points in April, up from 51.6 a month earlier, which at first glance looks like a solid improvement. In reality, however, the rise in manufacturing activity is not driven by real demand, but by increased stockpiling by firms seeking to secure goods against further shortages and price rises resulting from the escalation of tensions in the Middle East. This is a seemingly positive result, which in fact says more about the fear of supply chain disruptions than about the actual strength of the European economy. The devil is in the details, and it is these details that are shaping the outlook for both growth and inflation in the eurozone.
Delivery delays have reached their worst level since July 2022, input cost inflation has risen to a 46-month high, and price pressures are increasingly being passed on to selling prices, marking the largest monthly jump since records began in 1997. As a result, the ECB faces a real dilemma: the data suggest a recovery, but leading indicators of producer sentiment and expectations merely confirm the growing risk of stagflation. For EUR/USD, this implies an environment of heightened uncertainty, in which the exchange rate may be prone to sharp movements depending on further signals from the Fed and the ECB, and any stronger US inflation data could push the pair back towards the support level at 1.1650.
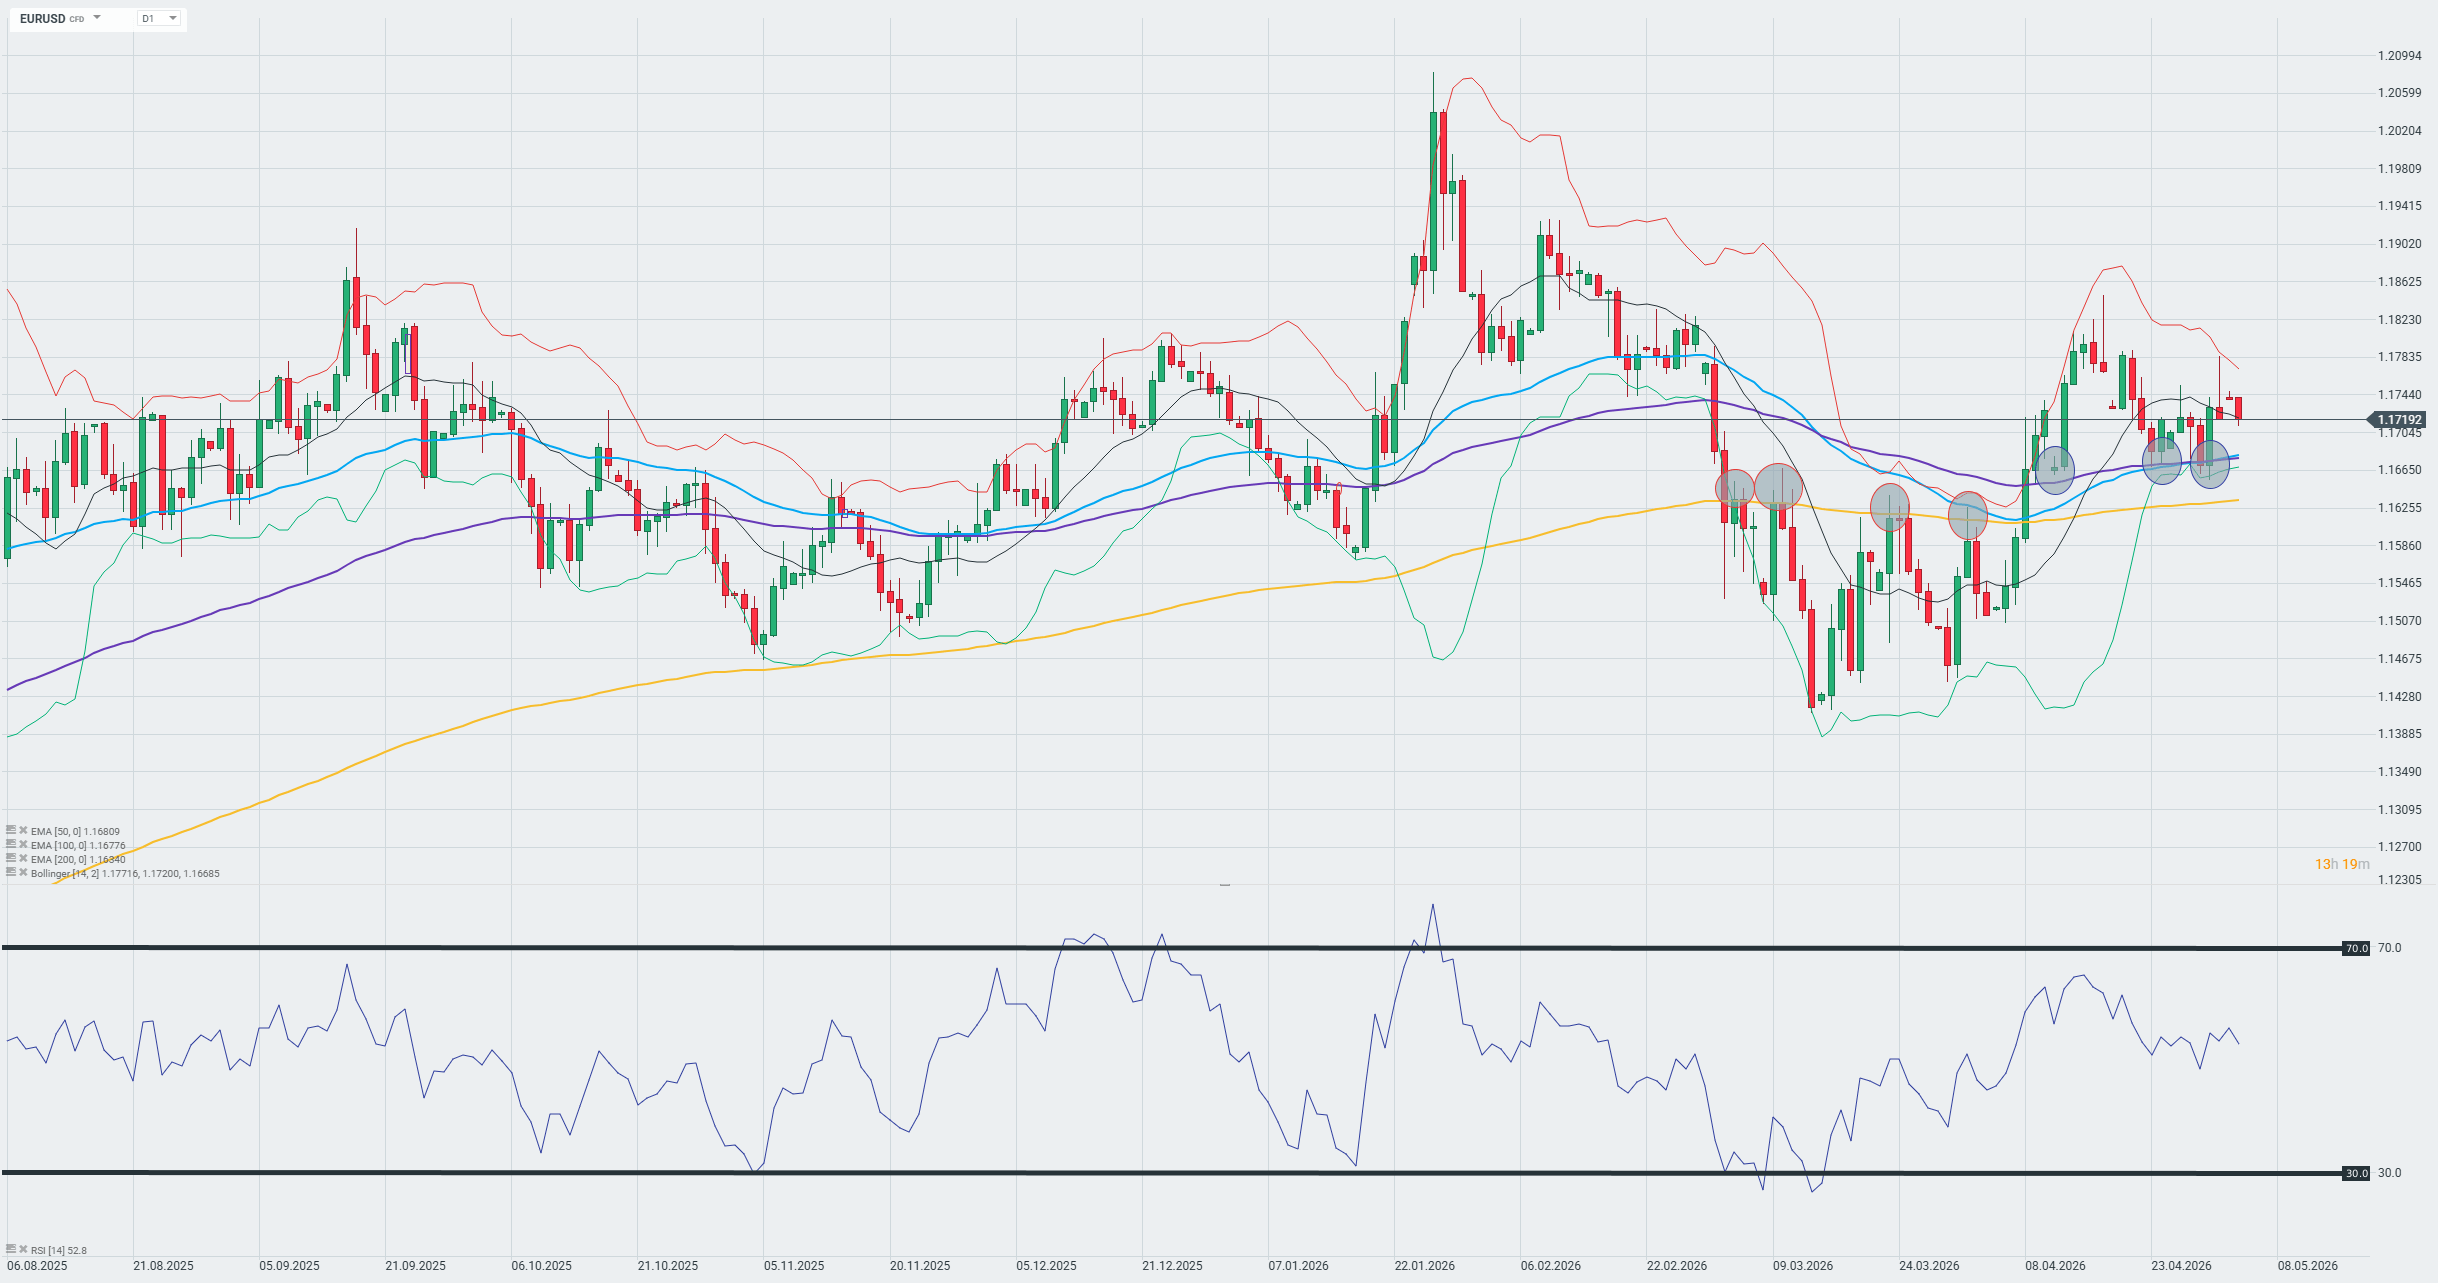
On the EUR/USD daily chart, following a sharp rally to around 1.2060 at the start of the year, the exchange rate underwent a significant correction that brought prices down to lows around 1.1380, from where a rebound occurred. Currently, the pair is trading at 1.1719, oscillating near the 50-day EMA (1.1681) and the 100-day EMA (1.1678), which together form a dynamic support zone, while the 200-day EMA at 1.1634 serves as another line of defense for the bulls.
Bollinger Bands indicate narrowing volatility, with the upper band at 1.1771 and the lower band at 1.1669, signaling a potential breakout in the coming sessions. The RSI is hovering around the neutral level of 52, which does not provide a clear directional signal and suggests that the market is still looking for momentum for a decisive move above the resistance at 1.1800 or a deeper correction toward the aforementioned 200-day EMA support.


