

Charting Features.
Open a Trading Account Our industry-leading charts* provide a host of features to support your chart analysis, including multiple chart types, over 115 technical indicators and drawing tools, pattern recognition and a chart forum community.
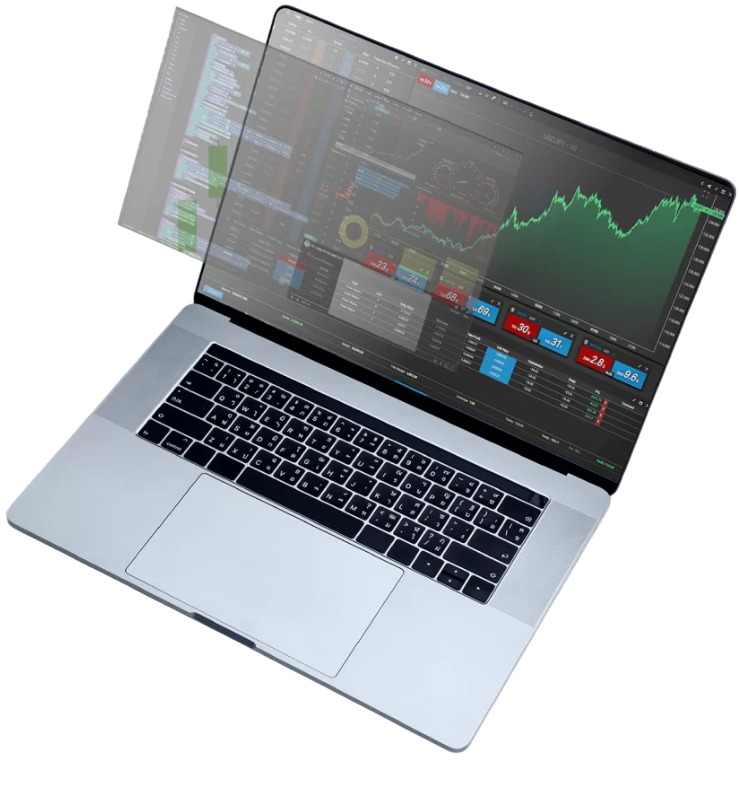
Technical analysis
Our fully-integrated technical analysis suite has been developed in-house and incorporated into our award-winning charting package, to deliver all the tools you need to analyse the financial markets. �
Range of chart types
Our charting package includes 12 different chart types, including the popular line, OHLC and candlestick charts, plus more advanced charts such as kagi, line break and renko charts.

Over 35 drawing tools
All charts come with a range of drawing tools that can be used to draw support and resistance levels, make notes on charts and highlight key price moves and patterns.
Technical indicators
Identify trend reversals, significant price levels and trading opportunities. Choose from more than 30 overlays and 50 studies including Bollinger Bands®, SMAs, ichimoku clouds, MACD, RSI and many more.

Extensive price history
Charts for our major products cover as much as 20 years’ worth of price history, allowing you to analyse price performance over the long term, as well as the short.
Numerous chart intervals
You can quickly switch between chart intervals, which range from one second through to one month.
Customisable charts
Our layouts, charts and technical indicators are all customisable, offering you the ability to set up your charts and technical analysis exactly as you like.�
Compare price action
Identify correlated products by dragging and dropping one or more products on to another product’s open chart to compare their performance over the same timeframe.�
Save default chart layouts
Once you’ve customised a chart, save the setup as default so each time you load a new chart the same preferences are applied to it. Save up to five charts per instrument.
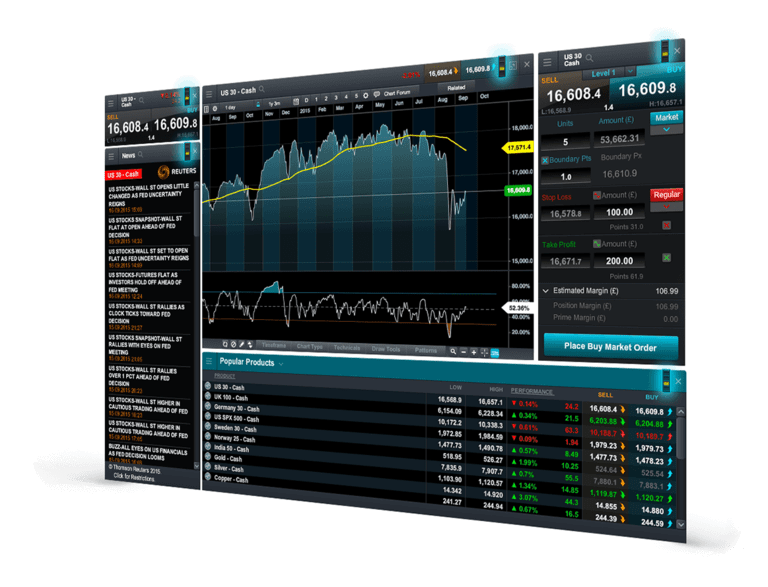
Trade from charts
Open trades directly from charts as opportunities emerge – just click on a live streaming price to open an order ticket and place a trade. You can also modify or close any pending orders.
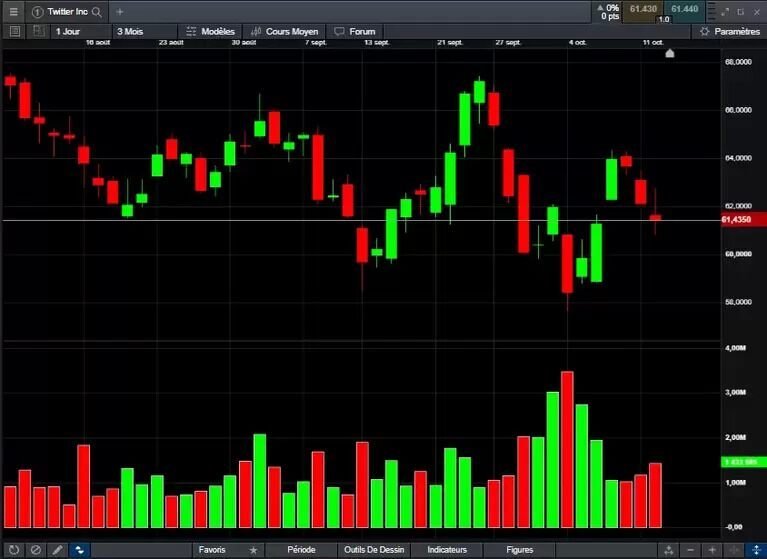
Volume on charting
Identify price momentum and confirm the existence or continuation of a trend by examining the volume-traded levels in parallel with price movements in real time. You can also look back at historical volume levels to identify historical trends and patterns.�
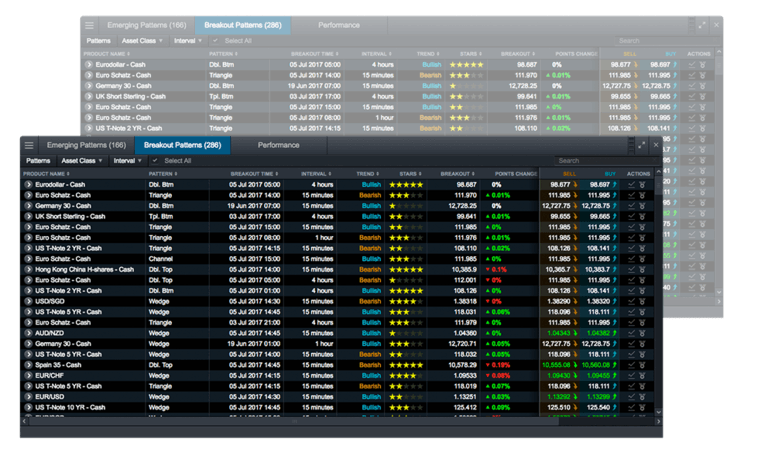
Price projection
Available on every chart when logged in to your live account, our pattern recognition tool allows you to search for common technical chart and candle patterns, providing a price projection. �
Pattern recognition
Let our pattern recognition tool scan for common technical patterns, such as head and shoulders, triangles and wedges, on any open chart across various time intervals, and view the price projection target area on the chart.
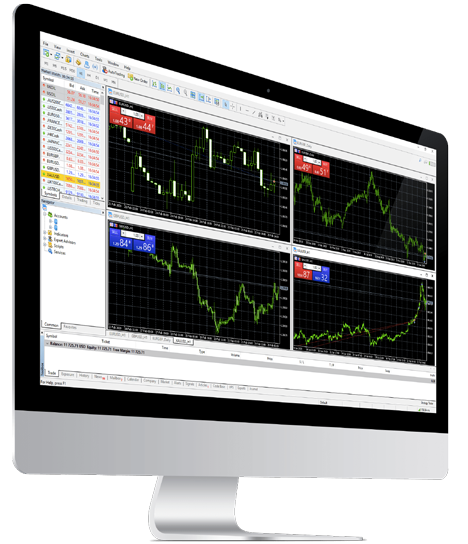
Module linking
This feature allows you to group charts together, so that when you change the product shown in one chart, all of the other charts in the group will automatically update to show the new product.
This lets you examine the price action for the same product over multiple intervals and timeframes at the same time, so you can compare long-term analysis with short. Drawing tools, technicals, chart types, patterns and presets are all automatically applied to all charts in the group.
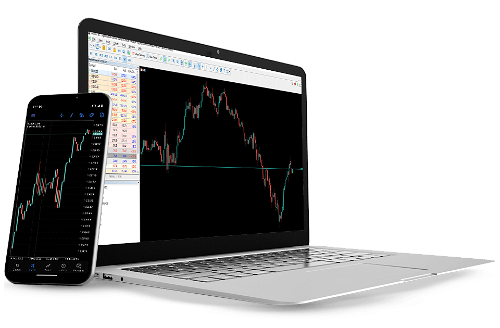
Mobile charting
Our mobile charts, available on our iPhone, iPad and Android™ apps, include over 25 of the most popular technical indicators and 15 drawing tools, plus you can place trades on live streaming prices and edit open orders directly from charts.
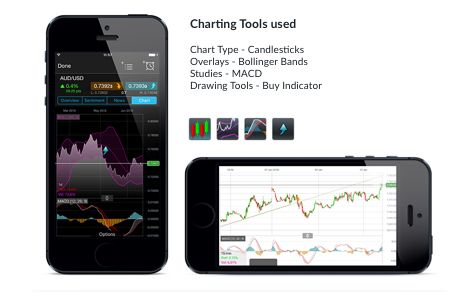
Five chart types
Our award-winning mobile apps* come with five different chart types: line, bar, spread, heiken-ashi and candlestick charts.

iPad multi-chart view
The multi-chart view, available with our custom-built iPad app, takes full advantage of the larger screen size, allowing you to scan up to four charts at a time. Compare price action and identify significant market movements across multiple products.
Trade from charts
Just tap any live streaming price to open an order ticket and place a trade, then edit open orders directly from charts.
Auto-save analysis
Any analysis conducted on a chart opened through a watchlist is automatically saved when you close that chart, so you can easily access that analysis later.
 Trading Signals
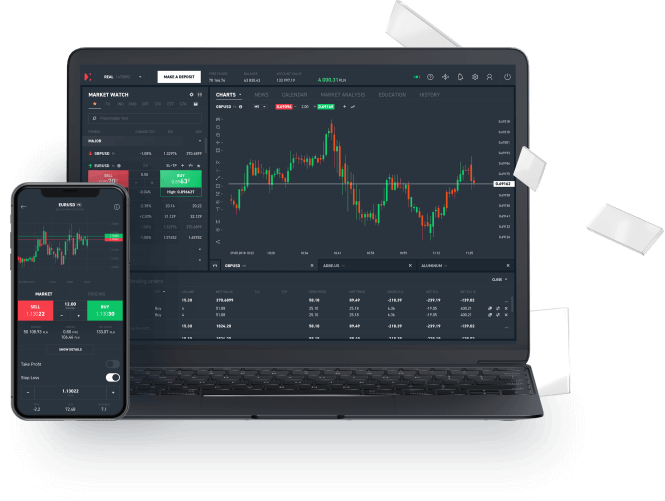 Countdown Pricing
 Wealth Management
 Guardian Angel
 Vanilla Options