

Today Markets Trader.
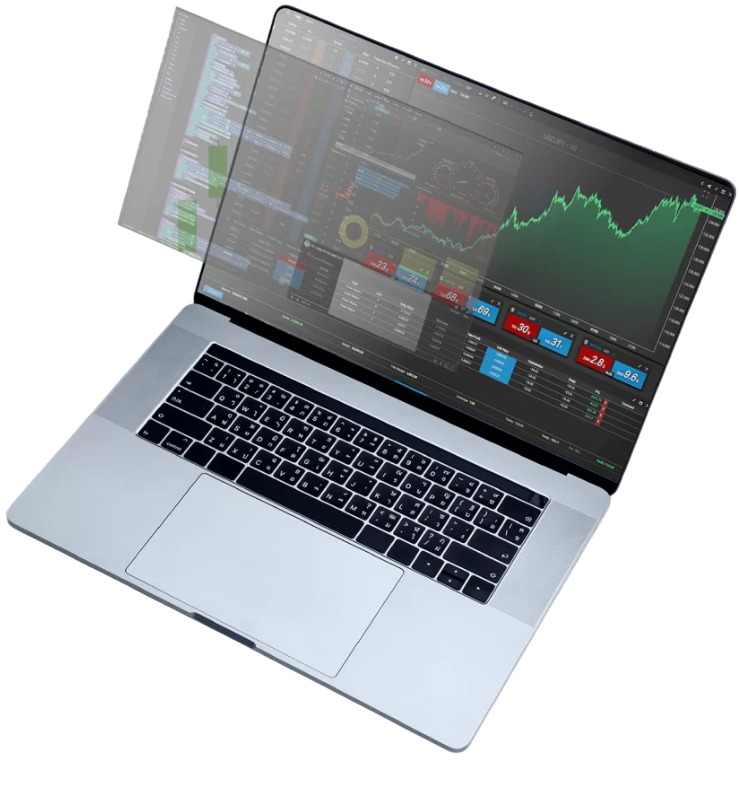
Open a Trading Account You get stunning charts, all US stocks & options, dozens of indicators, delayed streaming data, option chains, even practice trading. with Today Markets.com
Scan, Chart, Trade

You get stunning charts, all US stocks & options, dozens of indicators, delayed streaming data, option chains, even practice trading.�

Works on Windows, Mac, iOS, Android & Web

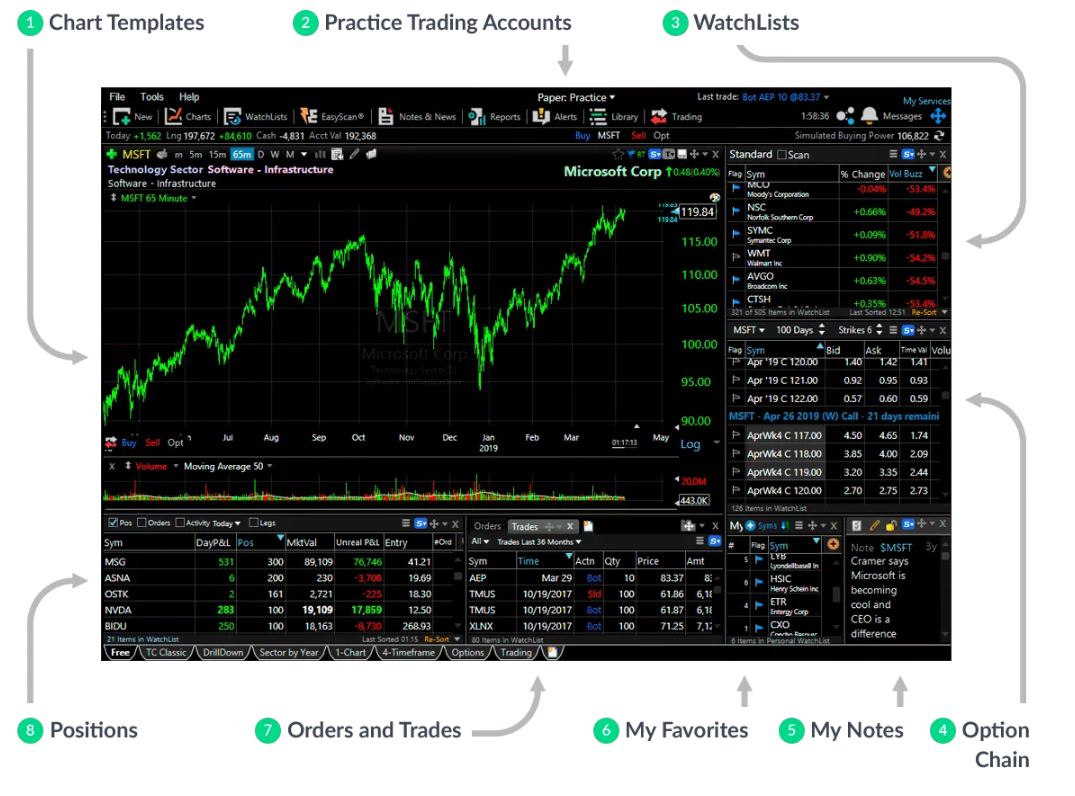
New Option Charts
Plot option charts with the underlying stock to see the relationship between the two. Now you can plot bid/ask data or last-trade data. This makes beautiful, streaming charts for even the most thinly traded options. Notice the shading in the stock price that shows when the option is in the money.
Full Trading Simulator
Track your positions, pending orders and trades. This a fully functional trading simulator that gives you access to all stock & option strategies. You can practice limit orders, bracket orders with profit targets & stops, OCA’s, multi-leg orders and more. This is the same trading platform used with Today Markets Brokerage, but in a simulated mode so you can hone your skills with paper money.


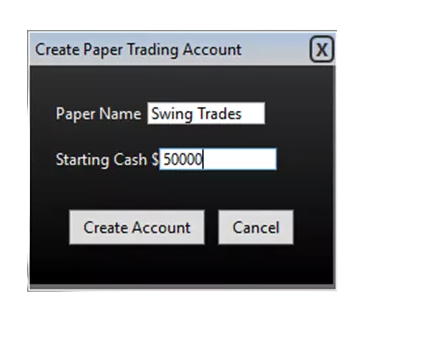
Practice, Practice, Practice
Create unlimited paper accounts to test your ideas and strategies. There’s no better way to learn without risking a penny of real money.
Stay Organized
Drag-and-drop symbols to your Favorites Watchlist. Manually rearrange to keep your most important items at the top. Have a plan, stay organized and follow it.

Market Index Watchlists
Access dozens of market index watchlists including the SP-500, Nasdaq 100, High Cap 1000, NYSE, Biotechs, Gold & Silver, Airlines, Oil, Financials, TSX and more. Please note that Dow Jones, sector indexes and some other indexes may require an additional subscription.
Keep a Journal
When something catches your attention or you want to remember something specific about a stock, write a note to make sure it doesn’t fall through the cracks. Journaling is a great way to improve your own personal trading habits. Charts are automatically saved with your notes for quick reference when reading in the future.


Trade Multi-Leg Strategies from the Chart
This patent-pending tool makes it easy to visually understand option strategies. The P&L zones on the right side show profit, loss and breakeven levels for the stock at expiration. In this example, you want the stock to go side-ways. The green zone represents a profit of up to $1000. The breakeven levels are $297.18 and $273.75. The red zones show unlimited loss to the up and downside. As you slide the strike price lines on the chart and move through expiration dates, the P&L zones are updated dynamically making it easy to see the impact on risk/reward.
Built-in Option Strategies
Pick a strategy based on the picture. The green represents where you think the stock is going to go. Red represents where you would lose. Click the strategy to have the legs automatically overlaid on the chart. Then drag the lines to move between strike prices and expiration dates. This patent-pending tool is a great way to learn how multi-leg option strategies work.


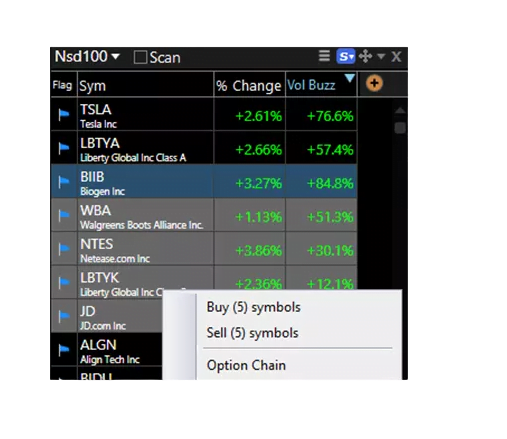
Trade Baskets
Multi-select symbols to batch them all into the same simulated order ticket. Then set their limit prices relative to the market. You could place an order to buy all five. Or you could use an OCA group to only get one of the five. For example, maybe you set high breakout prices and only want to buy the first stock to breakout. OCA stands for one-cancels-all.
Draw on Your Charts
Draw trendlines to help you identify trends and patterns. Measure swing sizes and write notes directly on the chart that are automatically saved for the next time you return.

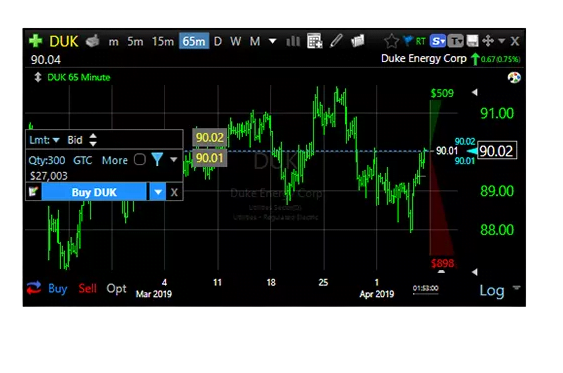
Place Limit Orders on the Chart
Drag limit & stop orders to visually place simulated orders at specific prices.
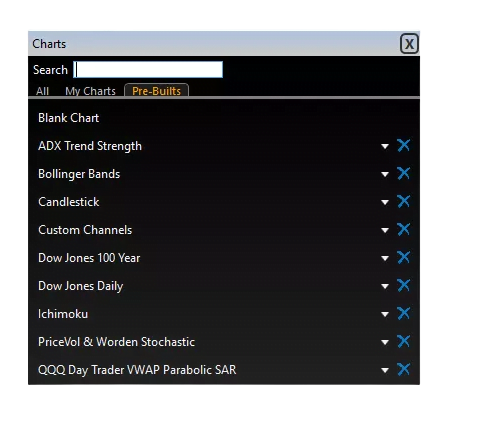
Chart Library
Customize and save charts to your own library.
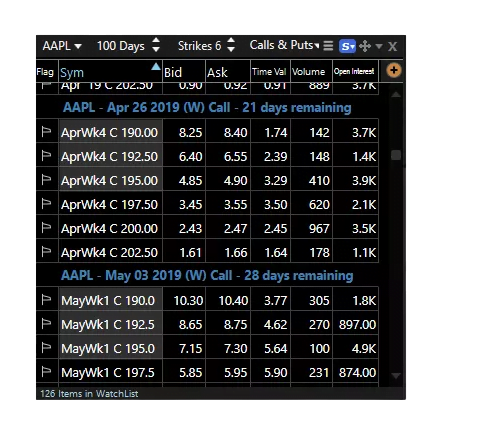
Built-In Option Chains
Access over 100,000 option contracts. Narrow down chains by calls, puts, number of strikes and time to expiration.
Visually See Positions
Simulated long, short and option positions are displayed on the chart for a quick reference of gains and losses.

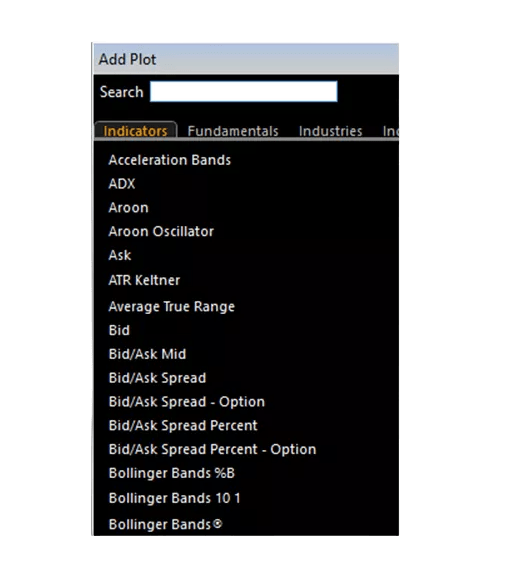
Lots of Indicators
Plot from a large library of indicators. You can even plot indicators of indicators. Some indicators may require a higher level of service.
 White Label Solutions
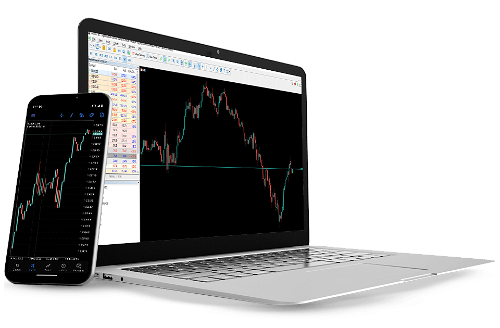 PMAM Platform
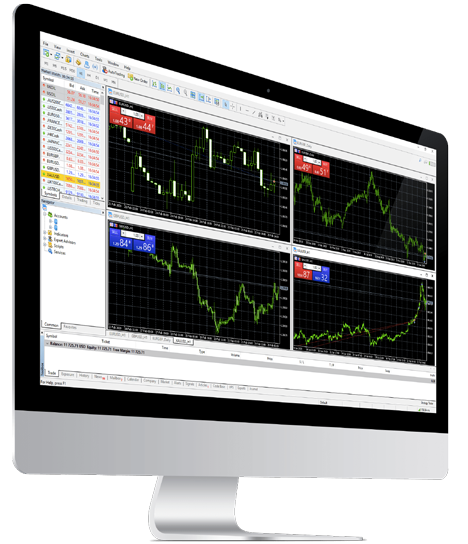 Partner Types
 Trading Signals
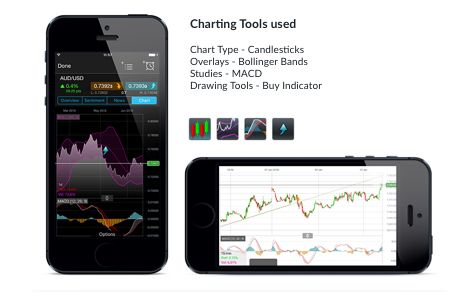 Charting Features
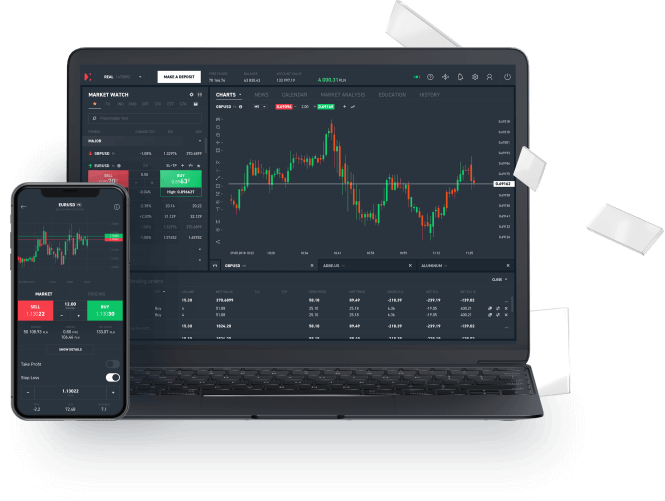 Countdown Pricing
 Wealth Management
 Guardian Angel
 Vanilla Options