
Nasdaq – Chart of The Day
- February 25, 2026
- Posted by: Today Markets
- Categories: Indices, Markets

Today, investors’ attention is shifting almost entirely to Wall Street. The key focus is Nvidia’s earnings, which the company will release after the close of the US session. Markets are pricing in a record quarter, strong sales, and—most importantly—highly optimistic forward guidance.
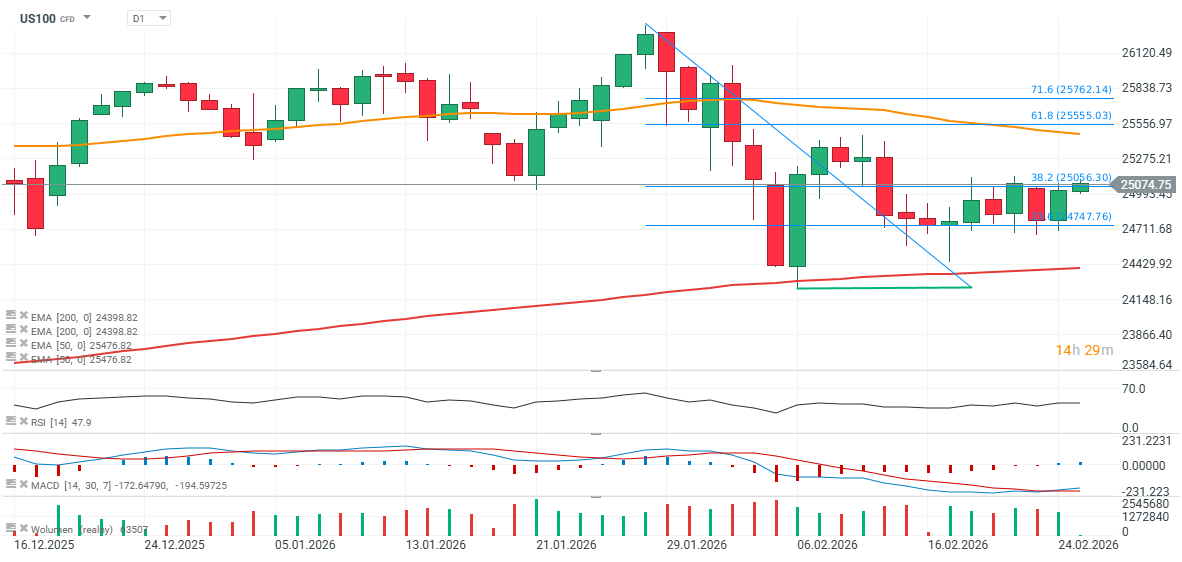
US100 (D1 timeframe)
- Any “scratch” in the report could allow sellers to regain control across equity indices—there is little room for weakness in today’s quarterly release. Nasdaq 100 futures are up nearly 0.3% around 9:30am Poland time and are pushing above the 25,000-point mark.
- The index is currently trading near the 38.2% Fibonacci retracement of the most recent downside impulse. A sustained break above this level—and a move through 25,150—could open the way toward 25,550, where the 61.8% retracement sits. That said, it is difficult to expect a decisive move before Nvidia publishes its results.
- Notably, the index is still relatively close (around 600 points) to the daily EMA200 (red line), which suggests market stress remains elevated. Wall Street caught a breath yesterday after Anthropic announced several strategic partnerships with major US software companies, including Spotify and Salesforce, easing fears of a “total disruption” of their business models.
- This naturally pushed investors back toward a scenario in which companies implement AI into their products rather than compete with it for the same market. However, if those fears re-emerge after today’s NVDA report, the 24,400 area looks like a critical test of the bull trend and a key support zone that the index already rebounded from in early February.
- Overall, key support levels remain 24,750 (23.6% Fibonacci retracement; also reinforced by recent price reactions—lower wicks on the last nine candles) and 24,400 (EMA200). The key resistance remains 25,500, where the 61.8% retracement aligns with the EMA50 (orange line).
Source: xStation5
The material on this page does not constitute financial advice and does not take into account your level of understanding, investment objectives, financial situation or any other specific needs. All information provided, including opinions, market research, mathematical results and technical analyzes published on the Website or transmitted To you by other means, it is provided for information purposes only and should in no way be construed as an offer or solicitation for a transaction in any financial instrument, nor should the information provided be construed as advice of a legal or financial nature on which any investment decisions you make should be based exclusively To your level of understanding, investment objectives, financial situation, or other specific needs, any decision to act on the information published on the Website or sent to you by other means is entirely at your own risk if you In doubt or unsure about your understanding of a particular product, instrument, service or transaction, you should seek professional or legal advice before trading. Investing in CFDs carries a high level of risk, as they are leveraged products and have small movements Often the market can result in much larger movements in the value of your investment, and this can work against you or in your favor. Please ensure you fully understand the risks involved, taking into account investments objectives and level of experience, before trading and, if necessary, seek independent advice.