

How To Trade Currency And Commodity Correlations
Correlations between the world’s most heavily traded commodities and currency pairs are common. For example, the Canadian dollar (CAD) is correlated to oil prices due to exporting, while Japan is susceptible to oil prices because it imports most of its oil. Similarly, Australia (AUD) and New Zealand (NZD) have a close relationship to gold prices and oil prices.
While the correlations (positive or negative) can be significant, if forex traders want to profit from them, it’s important to time a “correlation trade” properly. There will be times when a relationship breaks down, and such times can be very costly for a trader who does not understand what is occurring. Being aware of a correlation, monitoring it and timing it are crucial to successful trading based on the inter-market analysis provided by examining currency and commodity relationships.
Deciding Which Currency and Commodity Relationships to Trade
Not all currency/commodity correlations are worth trading. Traders need to take into account commissions and spreads, additional fees, liquidity and also access to information. Currencies and commodities that are heavily traded will be easier to find information on, will have smaller spreads and liquidity that is more likely to be adequate.
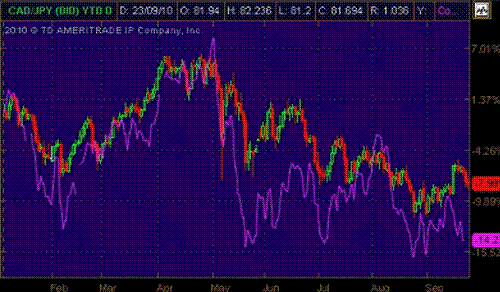
Canada is a major exporter of oil, and thus its economy is affected by the price of oil and the amount it can export. Japan is a major importer of oil, and thus the price of oil and the amount it must import affects the Japanese economy. Because of the major effect oil has on Canada and Japan, the CAD/JPY positively correlates with oil prices.
This pair can be monitored as well as the USD/CAD. The downside is that the CAD/JPY generally has a higher spread and is less liquid than the USD/CAD. Since oil is priced in U.S. dollars throughout most of the world, the fluctuating dollar impacts oil prices (and vice versa). Therefore the USD/CAD can also be watched given that the two countries are major oil importers and exporters.
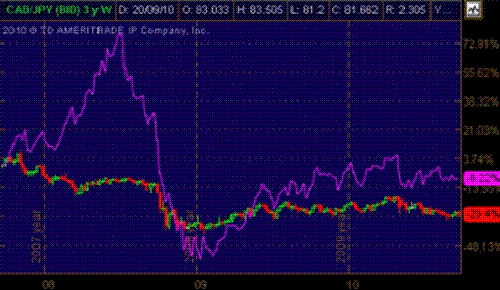
Figure 1 shows that there are times when the currency pair and oil diverged. The oil prices are adjusted. Figure 2 uses un-adjusted oil prices and, through 2010, a strong correlation can be seen showing it is important to monitor correlation in real-time with actual trade data.
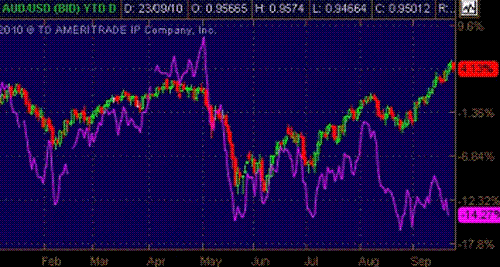
Australia is one of the major gold producers in the world. As a result, its economy is impacted by the price of gold and how much it can export. New Zealand is a major trading partner with Australia and is thus highly susceptible to fluctuations in Australia’s economy. This means that New Zealand is also highly affected by Australia’s relation to gold. In 2008, Australia was the fourth-largest gold producer in the world. In 2009, the U.S. was the third-largest buyer of gold. Therefore, the AUD/USD and NZD/USD are suitable for trading in relation to gold prices.
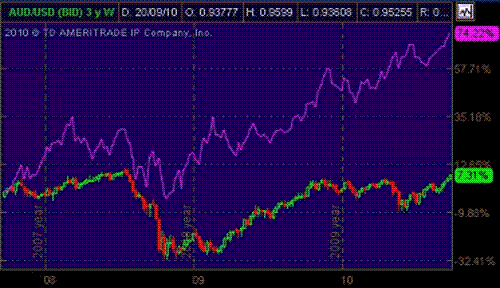
While Australia was among the smaller volume oil exporters in 2009, throughout 2010 the AUD/USD was also positively correlated to oil prices, and then in September diverged.
Currency commodity relationships may change over time. Other currency commodity relationships can be found by looking for major producers of any export, as well as the major importers of the same commodity. The currency cross rate between the exporter and importer is worth looking at for a correlation with the commodity.
Deciding Which Instrument to Trade In
Upon knowing which currencies and commodities have strong relationships, traders need to decide which tradable currency pair they will make their trades in, or if they will trade in the commodity and currency. This will depend on several factors including fees and the trader’s ability to access a given market. The charts show that the commodity is often the more volatile of the instruments.
If accessible, a trader may be able to trade the commodity and currency pair from one account due to the widespread use of commodity contracts for difference (CFDs).
Monitoring the Correlation for “Cracks”
It is also crucial to point out that just because a relationships exists “on average” over time, does not mean that strong correlations exists at all times. While these currency pairs are worth watching for their high correlation tendencies towards a commodity, there will be times when the strong correlation does not exist and may even reverse for some time.
A commodity and currency pair that is highly positively correlated one year, may diverge and become negatively correlated in the next. Traders who venture into correlation trading should be aware of when a correlation is strong and when it is shifting.
Monitoring correlations can be done quite easily with modern trading platforms. A correlation indicator can be used to show the real-time correlation between a commodity and a currency pair over a given period. A trader may wish to capture small divergences while the two instruments remain highly correlated overall. When divergence continues and the correlation weakens, a trader needs to step back and understand that this correlation may be in a period of deterioration; it is time to step to the sidelines or take a different trading approach to accommodate the changing market.

Figure 5 shows the weekly CAD/JPY as well as the correlation indicator (15 periods) comparing it to oil futures. Much of the time the indicator shows a strong correlation in the 0.80 area, yet there are times when the correlation falls off. When the indicator falls below a certain threshold (for example 0.50), the correlation is not strong and the trader can wait for the currency and commodity to re-establish the strong correlation. Divergences can be used for trade signals, but it should be noted that divergences can last for long periods of time.
The correlation indicator can be adjusted for the time frame a trader is trading on. A longer calculation period will smooth out the results and is better for longer term traders. Shortening the calculation period will make the indicator choppier but may also provide short-term signals and allow for correlation trading on smaller time frames.
Timing the Currency/Commodity Trade
Upon looking at the prior charts it is apparent that timing and a strategy is needed for navigating the fluctuating correlations between currencies and commodities. While exact entry and exit will be determined by the trader and will depend on whether they are trading the commodity, currency or both, a trader should be aware of several things when entering and exiting correlation trades.
- Are the currency and commodity currently correlated? How about over time?
- Does one asset seem to lead the other?
- Is price diverging? Is one asset class making higher highs, for example, while the other asset class fails to make higher highs? If this is the case, wait for the two to begin moving together once again.
Use a trend confirmation tool. If divergences occurs, wait for a trend to emerge (or reversal) where the currency and commodity trend in their appropriate correlated fashion.

By monitoring correlations several trades could have been confirmed in the USD/CAD and oil markets over the time frame shown in Figure 6. While one could trade the pairs during correlated times, this particular time frame saw several divergences. As the currency and commodity realigned themselves, large trends developed.
By watching for breaks in trend lines in both the commodity and currency, or by waiting for one asset class to join the correlation trend of the other asset class (marked by blue arrows), several large trends could have been captured. This is similar to watching for divergences in the correlation indicator and then taking a trade in a trending direction as the commodity and currency realign. The commodity, currency or both could be traded.
The Bottom Line on Trading Currency and Commodity Correlations
Correlations between currencies and commodities are not an exact science. Often correlations break down and may even reverse for extended periods. Traders must remain vigilant in monitoring correlations for opportunities. Correlation indicators or monitoring charts are two ways of completing this task.
After divergences, waiting for the commodity and currency to align in their respective trends can be a powerful signal – yet traders must accept that divergences can last a long time. Relationships may change over time as countries alter exports or imports, and this will affect correlations. It is also important that traders determine how they will make trades, whether in the currency, the commodity or both.


")

 White Label Solutions
 PMAM Platform
 Partner Types
 Trading Signals
 Charting Features
 Countdown Pricing
 Wealth Management
 Guardian Angel
 Vanilla Options