
 EUR /
EUR /  USD — Euro / US Dollar
 JPY — US Dollar / Japanese Yen
 GBP /
GBP /  AUD /
AUD /  CAD — US Dollar / Canadian Dollar
 CHF — US Dollar / Swiss Franc
 NZD /
NZD / 
Chart of the Day: OIL.WTI
- May 26, 2026
- Posted by: Today Markets
- Categories: Markets, Technical Analysis
Following Monday’s improvement in market sentiment, which brought a substantial decline in energy commodity prices, we are observing a partial reversal driven by reports of a strike by US forces on facilities located in southern Iran, likely near Bandar Abbas. WTI crude oil is up by approximately 1.4% in morning trading. Negotiations between the US and Iran are expected to continue, which is limiting the scale of the declines. The parties are reportedly focusing solely on the “appropriate language” to be used in the final agreement between Washington and Tehran. Investors are eagerly awaiting further information that could confirm or refute the thesis that the negotiating gaps between the parties are narrowing. At this moment, we are only receiving signals regarding the continued shelling of Lebanon by Israel, which certainly does not fill the markets with optimism. Chart 1: OIL.WTI (24.07.2024 – 25.05.2026)
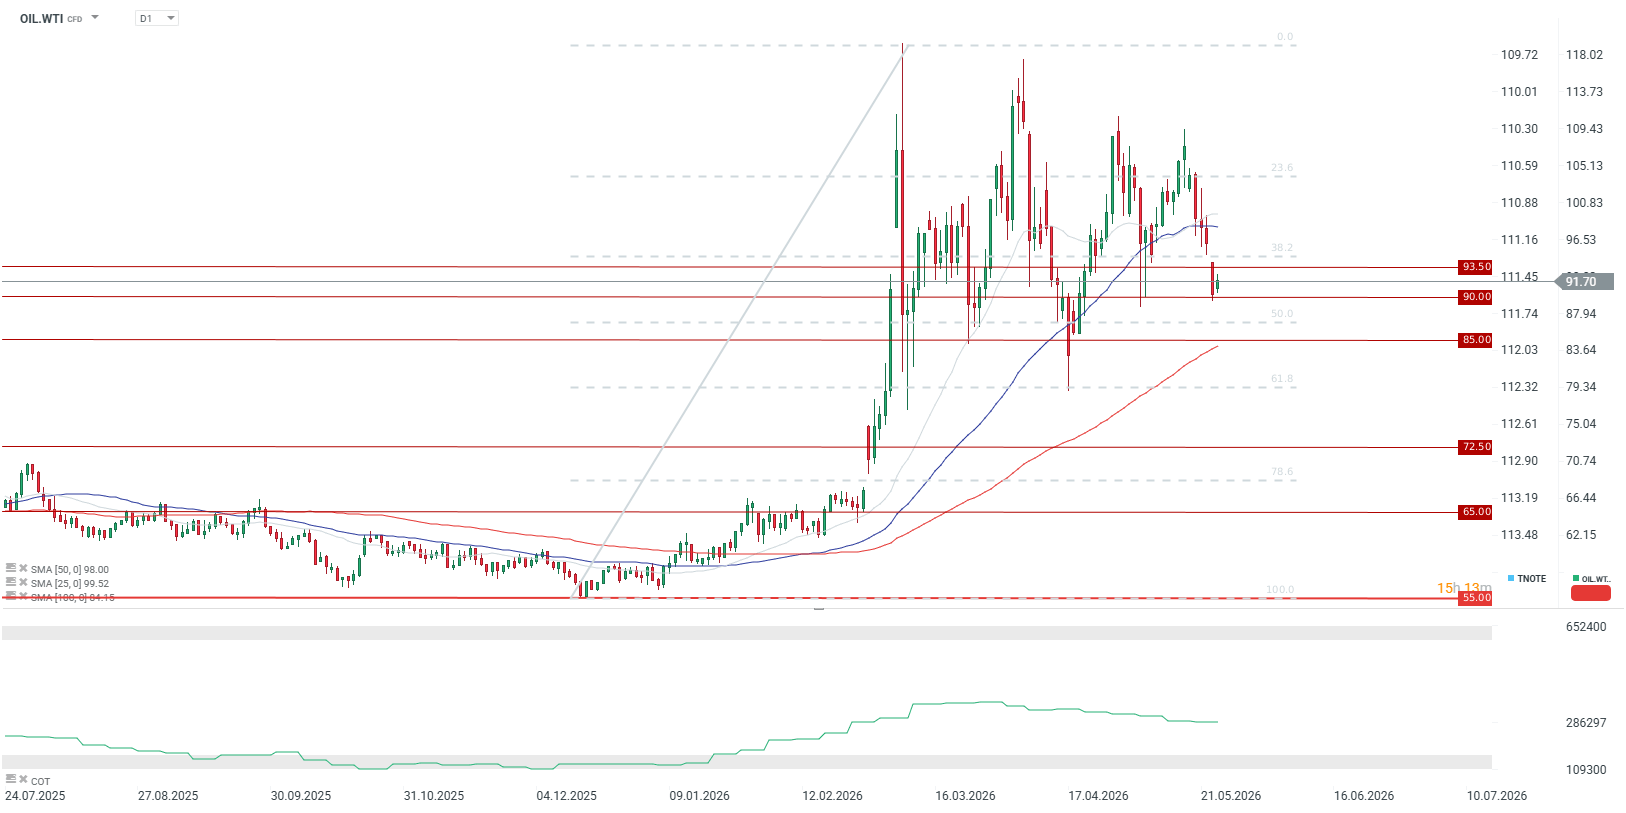
Source: xStation, 25.05.2026 Currently, the market is in a deeper correction phase after reaching local highs. Recent candlesticks indicate selling pressure. $90 serves as both the nearest support level and a key psychological barrier. Defending it is crucial for the bulls. The next key support level is located at $85. Dynamic resistance is currently provided by the descending blue moving average (SMA 50).
- Fibonacci retracements: A drop below 38.2% and a daily candle close below this mark is a classic technical signal suggesting further declines towards the 50% retracement (which coincides with the aforementioned support at $85).
- Moving Averages: The price has fallen below the shorter-term averages (including the blue SMA 50), confirming a short-term shift to bearish sentiment. The long-term average (the red SMA 100 line) is still sloping upwards and sits below the current price, confirming that in the long-term horizon, the uptrend has not yet been negated.