
 EUR /
EUR /  USD — Euro / US Dollar
 JPY — US Dollar / Japanese Yen
 GBP /
GBP /  AUD /
AUD /  CAD — US Dollar / Canadian Dollar
 CHF — US Dollar / Swiss Franc
 NZD /
NZD / Chart of The Day – USD/JPY – a change in trend?
- July 3, 2026
- Posted by: Today Markets
- Categories: Competitive research, Forex, Markets, Technical Analysis
The USDJPY rose to its highest level since December 1986 (162.8) on Wednesday. Since then, however, it has recorded a decline of over 1%.
A shift in approach to currency interventions
June’s intervention attempts by the Japanese authorities proved unsuccessful. Following temporary declines, the USDJPY pair reached new highs. Consequently, according to Reuters reports, officials are set to abandon the previous practice of signaling intervention risks, instead taking action to exert pressure on speculators and increase the costs associated with betting against the yen. Communication signaling specific exchange rate levels that could trigger action from the authorities is also expected to be abandoned. This change in approach appears to be gaining market approval; the yen strengthened yesterday morning by nearly 0.9% against the dollar, holding gains until the end of the day thanks to a weaker-than-expected US non-farm payrolls (NFP) report. Today, the Japanese currency is experiencing further strengthening, potentially influenced by broader dollar weakness as well as comments from Finance Minister Satsuki Katayama, who stated that Tokyo remains ready to intervene in the foreign exchange market while emphasizing close cooperation with Washington in this regard. She also addressed rising bond yields, noting that fiscal policy will be conducted in a way that restores market confidence.
Further rate hikes ahead
The Bank of Japan is currently at a historic turning point, moving away from decades of ultra-loose monetary policy. In mid-June, it raised the main interest rate to its highest level since 1995 (1%). In line with market consensus and signals from board members (including the hawkish Naoki Tamura), this is not the end of the tightening cycle. The market expects rates to rise systematically over intervals of several months towards the neutral rate, which, according to policymakers, currently stands at 1.5%-2.0%. The government administration is pushing hard for rate hikes to prevent excessive currency depreciation. As an aside, it is worth adding that one of the main beneficiaries of this situation is the Japanese banking sector.
Tightening supported by macroeconomic data
Data remains the foundation for the continuation of the hawkish pivot. The Bank has significantly raised its inflation forecasts, expecting the core measure to rise to 2.5-3% in fiscal year 2026, well above the 2% inflation target. Medium- and long-term inflation expectations also remain elevated. Moreover, inflation is no longer being driven solely by external factors. Wages grew in April (3.5%) at their fastest pace since 2024, and Japanese companies are increasingly willing to pass higher labor costs onto final prices.
Technical Analysis Figure 1: USDJPY (03.12.2025 – 03.07.2026)
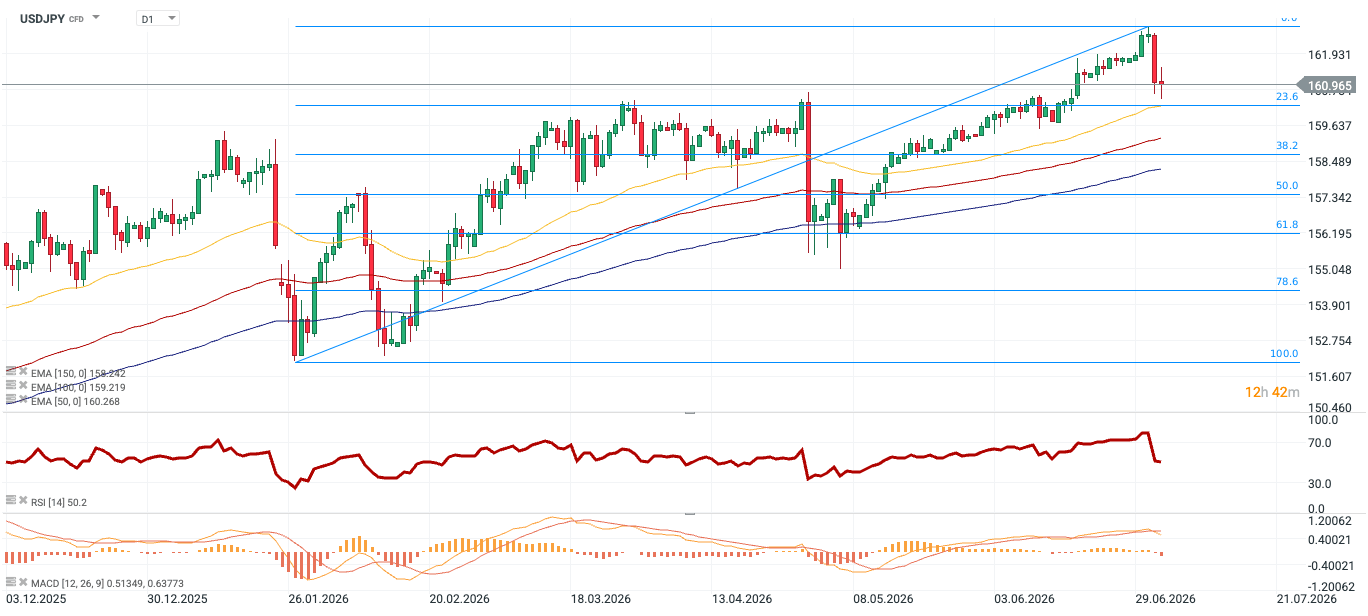
Source: xStation, 03.07.2026 Despite a significant correction, the pair is still in a long-term, stable uptrend. The basic structure (a pattern of higher highs and higher lows on a daily basis) has not yet been permanently negated. The 160.2 area currently acts as a critical defensive zone, resulting from the convergence of two significant technical factors: the 50-period exponential moving average (EMA 50 – 160.268) and the 23.6% Fibonacci retracement level for the broader upward wave.
The RSI has left the strong overbought territory and stabilized at an almost completely neutral level (50.2). This creates space for generating a new directional impulse. Short-term dominance of the selling side is confirmed by the MACD. The crossover of the signal line from above and the growing negative histogram reflect downward momentum, which dictates caution when prematurely assuming that the correction has definitively ended.


