
 EUR /
EUR /  USD — Euro / US Dollar
 JPY — US Dollar / Japanese Yen
 GBP /
GBP /  AUD /
AUD /  CAD — US Dollar / Canadian Dollar
 CHF — US Dollar / Swiss Franc
 NZD /
NZD / 
XAG/USD corrects to near $62, increasing bearish bets on oil prices limit downside
- July 6, 2026
- Posted by: Today Markets
- Categories: Markets, Precious Metals, Technical Analysis
- Silver price falls back to near $62 after a four-day winning streak.
- Hopes of further decline in oil prices are expected to limit the Silver price’s correction.
- Investors await the FOMC minutes for fresh cues regarding the US interest rate outlook.
Silver price (XAG/USD) is down 1% to near $61.80 during the Asian trading session on Monday. The white metal falls back after rising for four straight trading days. The precious metal is expected to revive soon, as market experts are betting on further decline in oil prices, a scenario that would ease global inflation expectations further.
In the past few months, the Silver price faced intense selling pressure as oil prices rallied due to energy supply disruptions in the wake of the Middle East war.
Analysts at Citi have said in a note that Brent Crude Oil could slide further to $60 by the year-end, with fundamentals rapidly reasserting themselves as Hormuz disruptions fade and shipping flows are normalizing.
In the Asian trade, the Brent Crude Oil trades 0.5% lower at around $71.80, close to the five-month low of $70.26 posted on Thursday.
Meanwhile, a slight decline in Federal Reserve (Fed) interest rate hike expectations, following the release of the United States (US) Nonfarm Payrolls (NFP) data on Thursday, is also expected to support the Silver price.
According to the CME FedWatch tool, the odds of the Fed delivering at least one interest rate hike by the end of September are 53.2%, down from 59.4% seen a week ago.
Going forward, investors will pay close attention to the Federal Open Market Committee (FOMC) minutes of the June policy meeting, which will be released on Wednesday.
Silver technical analysis
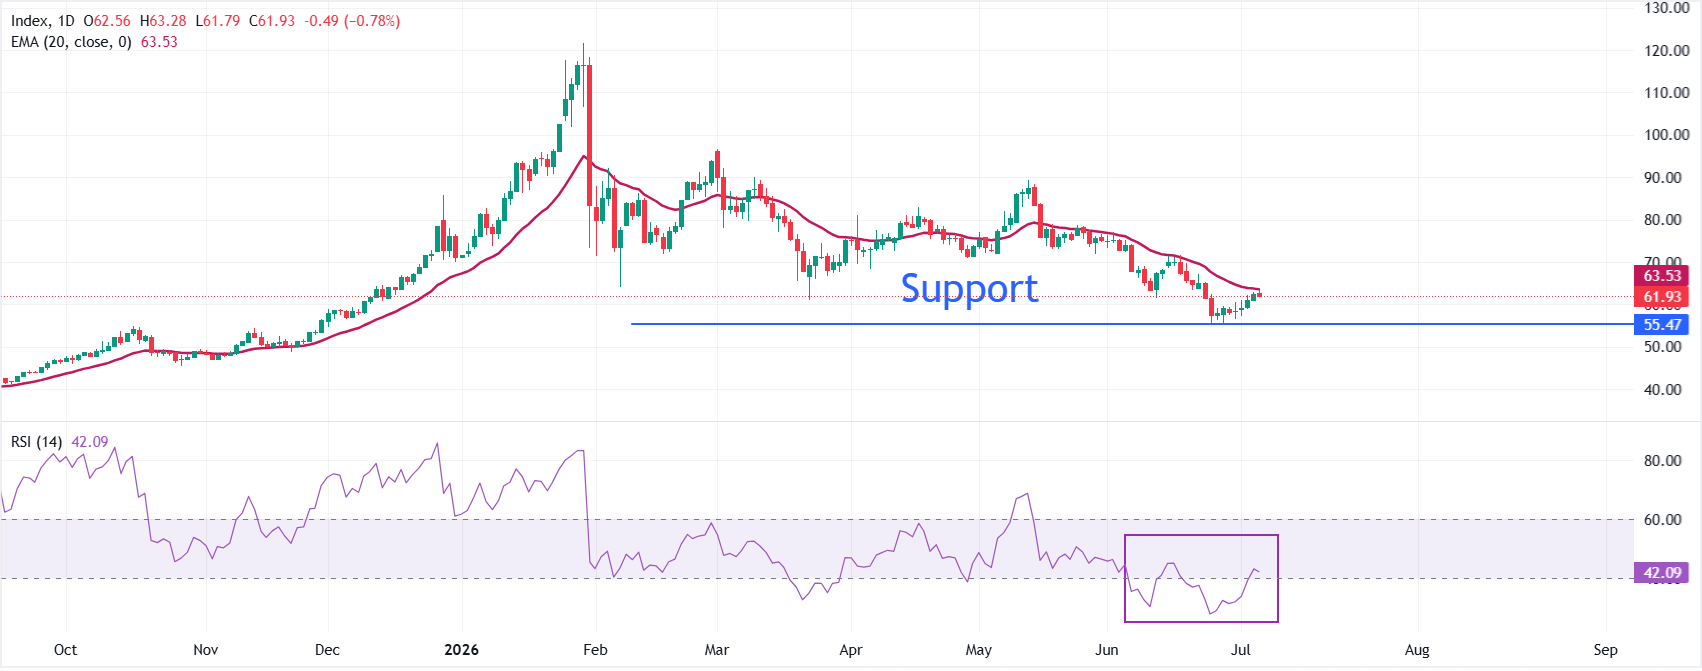
XAG/USD trades lower at around $61.94 at press time. The white metal faces selling pressure after a mean-reversion move to near the 20-day Exponential Moving Average (EMA), which is at roughly $63.53.
The Relative Strength Index (RSI) around 42 after rebounding from the 20.00-40.00 zone suggests that the downside momentum has cooled down, but the downside bias is still intact.
On the topside, the immediate hurdle is the 20-day EMA at $63.53, and a daily close above this level would be needed to ease the current downside bias and open the way for a more sustained recovery towards the June 22 high at $67.17, followed by $70.00. Looking down, the precious metal might be exposed to a fresh downside leg if it resumes its decline and drops below the June 24 low of $55.63.