
 EUR /
EUR /  USD — Euro / US Dollar
 JPY — US Dollar / Japanese Yen
 GBP /
GBP /  AUD /
AUD /  CAD — US Dollar / Canadian Dollar
 CHF — US Dollar / Swiss Franc
 NZD /
NZD / 
Chart of the Day – What is next for July’s strongest currency?
- July 15, 2026
- Posted by: Today Markets
- Categories: Markets, Technical Analysis, Trading Forex
The geopolitically turbulent start of July has brought a strengthening of commodity currencies (among them, the Norwegian krone). However, the top of the G10 list is occupied by the New Zealand dollar, which may come as a surprise to some. The currency has strengthened by nearly 2.5% against the dollar over the past two weeks.
What lies behind such a significant move?
Fundamental to this, as is often the case, were the actions of the central bank. On 8 July, the Reserve Bank of New Zealand raised the main interest rate by 25 bps, lifting it to 2.5%. This was the first rate hike in New Zealand in over three years. The key, however, was not just the decision to raise rates (which was largely priced in by markets) but the communication that accompanied it.
- The decision was made unanimously by the committee. At the previous meeting in May, there was a 3-3 split in votes, and the balance was only tipped by the new governor, Anna Breman.
- The RBNZ Chief Economist, Paul Conway, drew clear attention to pro-inflationary risks resulting from the escalation of tensions in the Middle East.
- The Bank stated in its communiqué that “while further interest rate hikes seem likely at upcoming meetings, their timing is highly uncertain.”
- RBNZ research suggests that after a long period of elevated inflation, New Zealand companies are significantly more inclined to immediately pass costs on to consumers and less willing to lower prices when costs fall.
As a result, the market’s baseline scenario is another hike in September and another upward move in October or December. This would bring the main interest rate (cash rate) to 3%, which the bank currently defines as the neutral level.
What lies ahead? There is still plenty of time until September.
- In the meantime, the Q2 inflation report will be published. The consensus assumes a significant increase in the headline indicator, most likely to around 4%.
- After the manufacturing PMI rose to its highest level since 2021 (59.7), data on production could prove particularly interesting.
Data from China, New Zealand’s largest trading partner, which absorbs nearly 25% of the country’s total exports (mainly dairy, meat, wood, and fruit), will also be significant.
- Stronger economic data from the Middle Kingdom usually means greater demand for products imported from New Zealand.
- In this context, the readings published today are not particularly optimistic. GDP dynamics fell to the lowest level since 2022 (+4.3% year-on-year).
- The Asian giant is burdened by a property market crisis, weak domestic demand, and a decline in investment (down 5.7% year-on-year in the first half of the year).
The strength of the dollar itself, which is awaiting further news from the geopolitical front and the September FOMC decision, could, of course, also prove key.
- The market does not really expect a hike, so the focus will be on communication. Kevin Warsh remains enigmatic, so upcoming conferences may attract particular attention.
Technical Analysis Figure 1: NZDUSD [D1] (08.07.2025 – 15.07.2026)
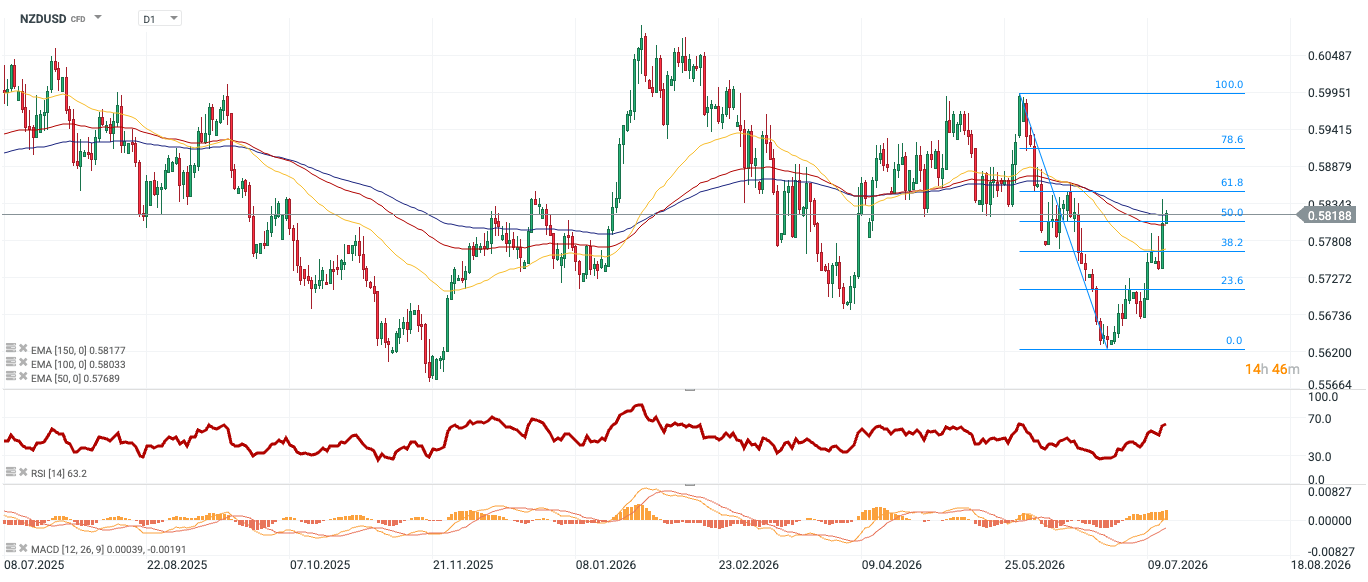
Source: xStation, 15.07.2026 The NZDUSD pair has broken out of the downtrend and is currently testing key support levels. The price has breached the 50% Fibonacci retracement and is hovering around the 150-day moving average. The upward momentum is also suggested by the MACD indicator. The Relative Strength Index (RSI) has reached 63.4, which confirms a clear advantage for market bulls, while at the same time indicating that the market is not yet in the extreme overbought zone (above 70).