
 EUR /
EUR /  USD — Euro / US Dollar
 JPY — US Dollar / Japanese Yen
 GBP /
GBP /  AUD /
AUD /  CAD — US Dollar / Canadian Dollar
 CHF — US Dollar / Swiss Franc
 NZD /
NZD / Chart of The Day – Oil
- April 27, 2026
- Posted by: Today Markets
- Categories: Competitive research, Funding trends, Markets, Technical Analysis, WTI.Oil

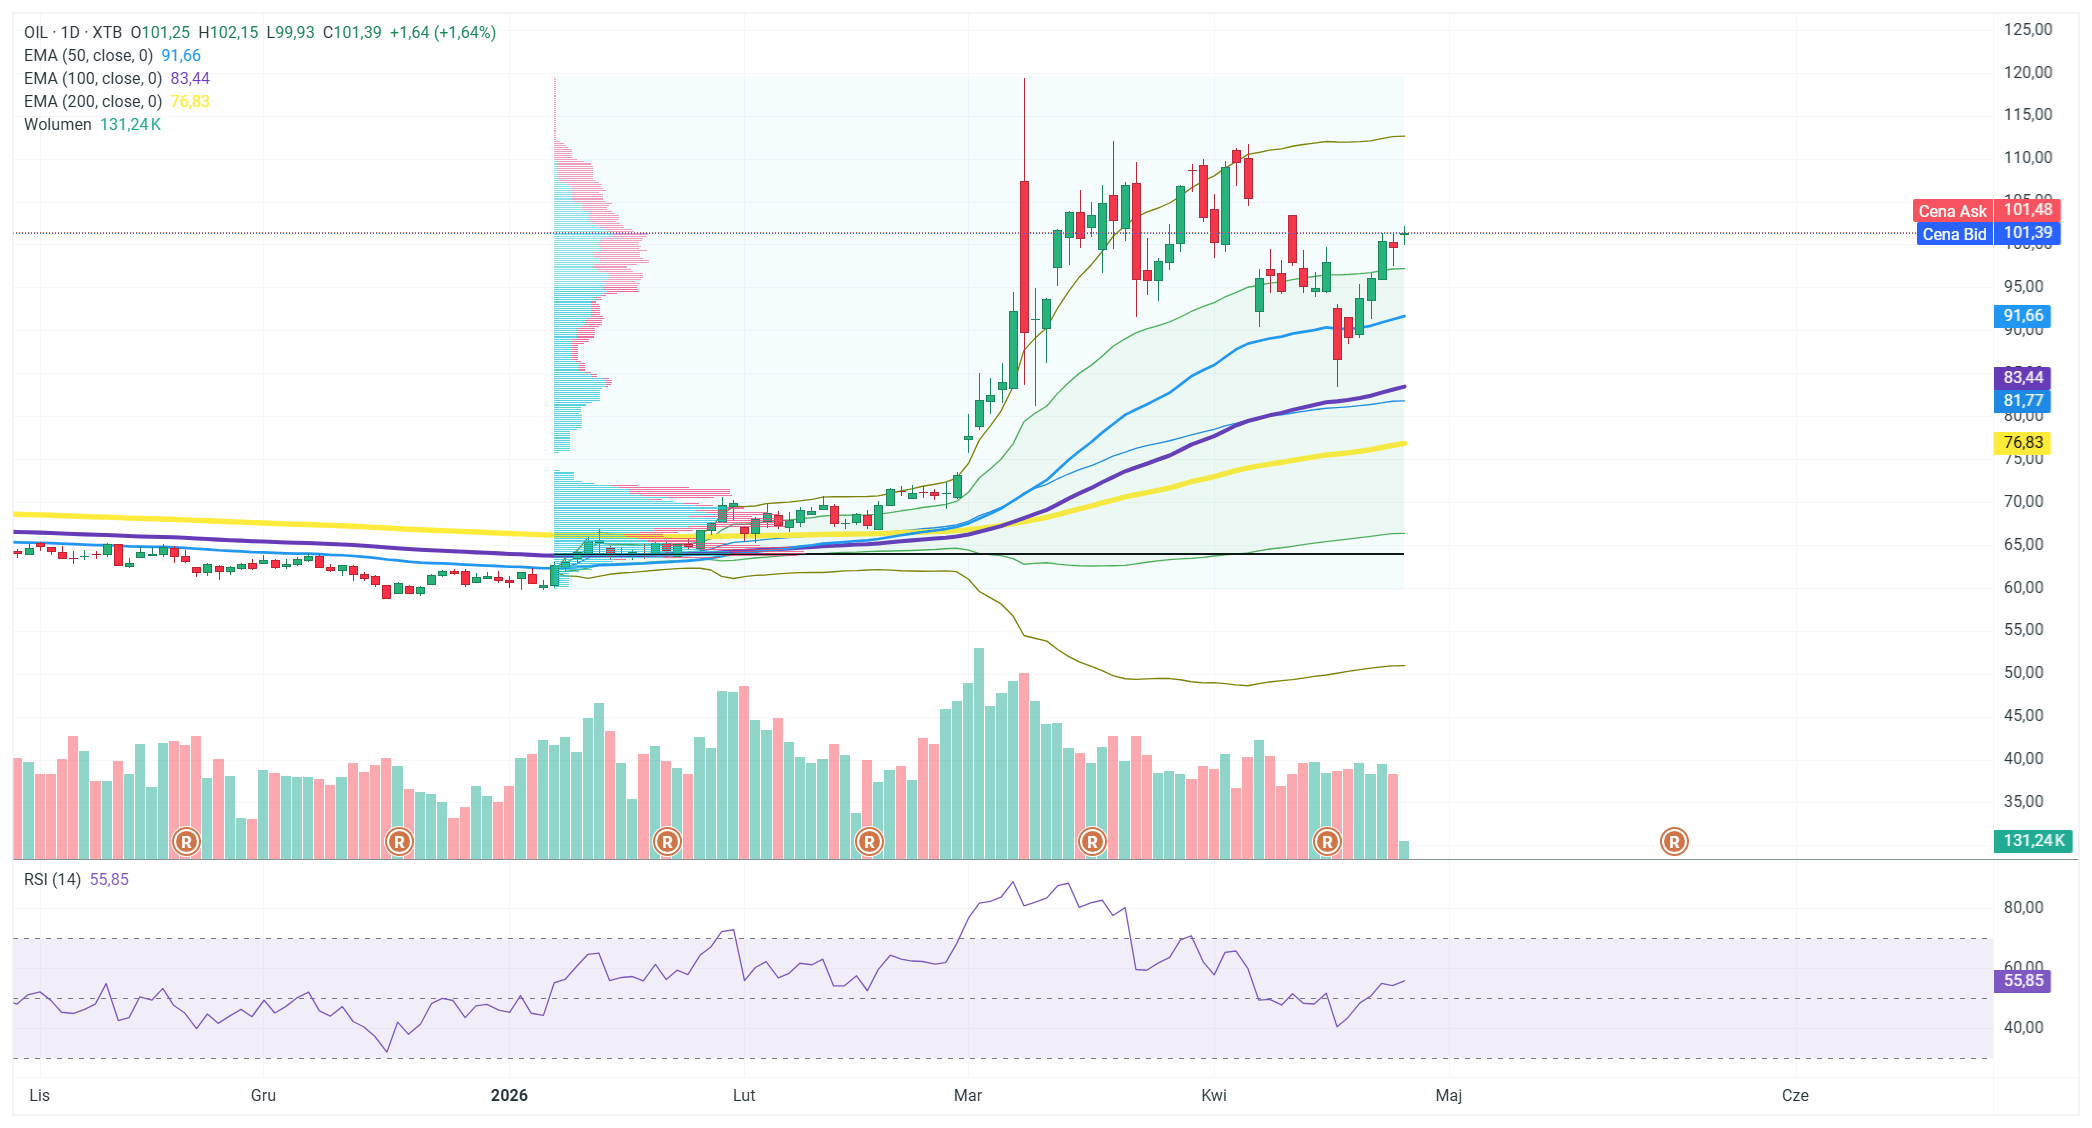
Brent crude opened the new week with gains, trading at $101.56 per barrel (+1.81%), with a daily high of $102.15. On the daily chart, the price has clearly moved away from key moving averages—the EMA50 stands at $91.66, the EMA100 at $83.44, and the EMA200 at $76.83—confirming the strong uptrend that has persisted for many weeks. The RSI(14) at 56.01 indicates moderate upward momentum, with no signs of the market being overbought. The geopolitical situation surrounding the Strait of Hormuz remains the main driver of oil prices.
Following visits to Pakistan and Oman, Iranian Foreign Minister Araghchi announced the continuation of consultations with the Sultanate regarding safe transit through the strait, which the market initially interpreted as a sign of de-escalation—WTI retreated from its daily high of $96.68 to around $95.35.
However, caution is warranted:
control over the Strait of Hormuz remains Tehran’s main bargaining chip, and it is difficult to expect Iran to relinquish it before securing concessions on the nuclear issue. Trump, for his part, has made it clear that he will maintain the naval blockade as a tool of pressure, and any “opening” of the strait would be, at best, a symbolic gesture by Iran in exchange for lifting the blockade. The key event of the day is the Situation Room meeting convened by Trump, the outcome of which could cause oil prices to spike.
Looking at the week as a whole, the oil market will react to decisions by the Fed, ECB, and BoE, as well as macroeconomic data (PCE, GDP, ISM), and any news from the Middle East could trigger sharp volatility in an already heated commodities market.
Source: xStation


