

Bulls Versus Bears
A candlestick depicts the battle between Bulls (buyers) and Bears (sellers) over a given period of time. An analogy to this battle can be made between two football teams, which we can also call the Bulls and the Bears. The bottom (intra-session low) of the candlestick represents a touchdown for the Bears and the top (intra-session high) a touchdown for the Bulls. The closer the close is to the high, the closer the Bulls are to a touchdown. The closer the close is to the low, the closer the Bears are to a touchdown. While there are many variations, I have narrowed the field to 6 types of games (or candlesticks):

- Long white candlesticks indicate that the Bulls controlled the ball (trading) for most of the game.
- Long black candlesticks indicate that the Bears controlled the ball (trading) for most of the game.
- Small candlesticks indicate that neither team could move the ball and prices finished about where they started.
- A long lower shadow indicates that the Bears controlled the ball for part of the game, but lost control by the end and the Bulls made an impressive comeback.
- A long upper shadow indicates that the Bulls controlled the ball for part of the game, but lost control by the end and the Bears made an impressive comeback.
- A long upper and lower shadow indicates that the both the Bears and the Bulls had their moments during the game, but neither could put the other away, resulting in a standoff.
What Candlesticks Don’t Tell You
Candlesticks do not reflect the sequence of events between the open and close, only the relationship between the open and the close. The high and the low are obvious and indisputable, but candlesticks (and bar charts) cannot tell us which came first.

With a long white candlestick, the assumption is that prices advanced most of the session. However, based on the high/low sequence, the session could have been more volatile. The example above depicts two possible high/low sequences that would form the same candlestick. The first sequence shows two small moves and one large move: a small decline off the open to form the low, a sharp advance to form the high, and a small decline to form the close.
The second sequence shows three rather sharp moves: a sharp advance off the open to form the high, a sharp decline to form the low, and a sharp advance to form the close. The first sequence portrays strong, sustained buying pressure, and would be considered more bullish.
The second sequence reflects more volatility and some selling pressure. These are just two examples, and there are hundreds of potential combinations that could result in the same candlestick. Candlesticks still offer valuable information on the relative positions of the open, high, low and close. However, the trading activity that forms a particular candlestick can vary.
Prior Trend
In his book, Candlestick Charting Explained, Greg Morris notes that for a pattern to qualify as a reversal pattern, there should be a prior trend to reverse. Bullish reversals require a preceding downtrend and bearish reversals require a prior uptrend.
The direction of the trend can be determined using trend lines, moving averages, peak/trough analysis or other aspects of technical analysis. A downtrend might exist as long as the security was trading below its down trend line, below its previous reaction high or below a specific moving average.
The length and duration will depend on individual preferences. However, because candlesticks are short-term in nature, it is usually best to consider the last 1-4 weeks of price action.
Candlestick Positioning

Star Position
A candlestick that gaps away from the previous candlestick is said to be in star position. The first candlestick usually has a large real body, but not always, and the second candlestick in star position has a small real body.
Depending on the previous candlestick, the star position candlestick gaps up or down and appears isolated from previous price action. The two candlesticks can be any combination of white and black. Doji, hammers,shooting stars and spinning tops have small real bodies, and can form in the star position. Later we will examine 2- and 3-candlestick patterns that utilize the star position.

Harami Position
A candlestick that forms within the real body of the previous candlestick is in Harami position. Harami means pregnant in Japanese and the second candlestick is nestled inside the first. The first candlestick usually has a large real body and the second a smaller real body than the first.
The shadows (high/low) of the second candlestick do not have to be contained within the first, though it’s preferable if they are. Doji and spinning tops have small real bodies, and can form in the harami position as well. Later we will examine candlestick patterns that utilize the harami position.
Long Shadow Reversals
There are two pairs of single candlestick reversal patterns made up of a small real body, one long shadow and one short or non-existent shadow. Generally, the long shadow should be at least twice the length of the real body, which can be either black or white. The location of the long shadow and preceding price action determine the classification.
The first pair, Hammer and Hanging Man, consists of identical candlesticks with small bodies and long lower shadows. The second pair, Shooting Star and Inverted Hammer, also contains identical candlesticks, except, in this case, they have small bodies and long upper shadows. Only preceding price action and further confirmation determine the bullish or bearish nature of these candlesticks. The Hammer and Inverted Hammer form after a decline and are bullish reversal patterns, while the Shooting Star and Hanging Man form after an advance and are bearish reversal patterns.
Hammer and Hanging Man
The Hammer and Hanging Man look exactly alike, but have different implications based on the preceding price action. Both have small real bodies (black or white), long lower shadows and short or non-existent upper shadows. As with most single and double candlestick formations, the Hammer and Hanging Man require confirmation before action.

The Hammer is a bullish reversal pattern that forms after a decline. In addition to a potential trend reversal, hammers can mark bottoms or support levels. After a decline, hammers signal a bullish revival. The low of the long lower shadow implies that sellers drove prices lower during the session.
However, the strong finish indicates that buyers regained their footing to end the session on a strong note. While this may seem enough to act on, hammers require further bullish confirmation. The low of the hammer shows that plenty of sellers remain. Further buying pressure, and preferably on expanding volume, is needed before acting. Such confirmation could come from a gap up or long white candlestick. Hammers are similar to selling climaxes, and heavy volume can serve to reinforce the validity of the reversal.

The Hanging Man is a bearish reversal pattern that can also mark a top or resistance level. Forming after an advance, a Hanging Man signals that selling pressure is starting to increase. The low of the long lower shadow confirms that sellers pushed prices lower during the session.
Even though the bulls regained their footing and drove prices higher by the finish, the appearance of selling pressure raises the yellow flag. As with the Hammer, a Hanging Man requires bearish confirmation before action. Such confirmation can come as a gap down or long black candlestick on heavy volume.
Inverted Hammer and Shooting Star
The Inverted Hammer and Shooting Star look exactly alike, but have different implications based on previous price action. Both candlesticks have small real bodies (black or white), long upper shadows and small or nonexistent lower shadows. These candlesticks mark potential trend reversals, but require confirmation before action.

The Shooting Star is a bearish reversal pattern that forms after an advance and in the star position, hence its name. A Shooting Star can mark a potential trend reversal or resistance level. The candlestick forms when prices gap higher on the open, advance during the session and close well off their highs.
The resulting candlestick has a long upper shadow and small black or white body. After a large advance (the upper shadow), the ability of the bears to force prices down raises the yellow flag. To indicate a substantial reversal, the upper shadow should relatively long and at least 2 times the length of the body. Bearish confirmation is required after the Shooting Star and can take the form of a gap down or long black candlestick on heavy volume.

The Inverted Hammer looks exactly like a Shooting Star, but forms after a decline or downtrend. Inverted Hammers represent a potential trend reversal or support levels. After a decline, the long upper shadow indicates buying pressure during the session.
However, the bulls were not able to sustain this buying pressure and prices closed well off of their highs to create the long upper shadow. Because of this failure, bullish confirmation is required before action. An Inverted Hammer followed by a gap up or long white candlestick with heavy volume could act as bullish confirmation.


")

 White Label Solutions
 PMAM Platform
 Partner Types
 Trading Signals
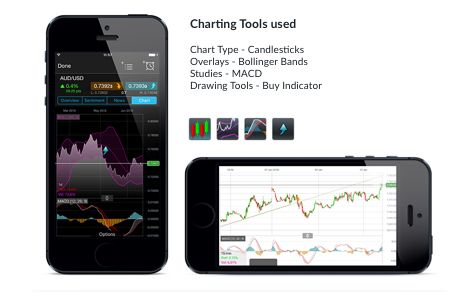 Charting Features
 Countdown Pricing
 Wealth Management
 Guardian Angel
 Vanilla Options