
 EUR /
EUR /  USD — Euro / US Dollar
 JPY — US Dollar / Japanese Yen
 GBP /
GBP /  AUD /
AUD /  CAD — US Dollar / Canadian Dollar
 CHF — US Dollar / Swiss Franc
 NZD /
NZD / Chart of The Day – EUR/USD Deepens Decline. What’s Next For The Pair?
- June 24, 2026
- Posted by: Today Markets
- Categories: Markets, Technical Analysis, Trading Forex
The U.S. dollar has strengthened significantly in recent days, and hawkish revisions to Federal Reserve projections have become the primary catalyst behind the decline in the world’s most important currency pair. Notably, EUR/USD has continued to fall even though the European Central Bank recently delivered a 25-basis-point rate hike.
This suggests that the move is being driven by more than just interest-rate expectations. Investors are increasingly focused on the divergence between the U.S. and eurozone economies. In the United States, key indicators such as ISM surveys, PMI data, and Nonfarm Payrolls continue to point to relatively solid economic growth. By contrast, the eurozone appears stuck in what could be described as “stable stagnation.” Across Europe, risks remain tilted to the downside due to ongoing disruptions in energy markets and persistent weakness in manufacturing, which remains an important contributor to regional growth.
Today German Ifo Business Climate data at 9 AM GMT can move the pair.
EUR/USD Chart (D1, H1) EUR/USD has fallen toward the 1.135 area, signaling a reversal into a bearish trend. The pair is now trading significantly below the 200-day exponential moving average (EMA200, red line), which is located near 1.16 and reinforced by several important historical price reactions. The pair has now posted nearly five consecutive losing sessions, with the biggest catalyst for the selloff being the Federal Reserve’s shift toward a more hawkish policy outlook.
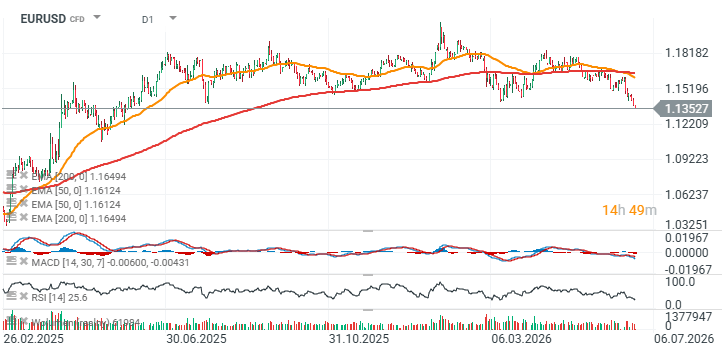
Source: xStation5
Looking at the hourly timeframe, EUR/USD is currently mirroring the previous correction almost point for point. The key question is whether the strong downside momentum is beginning to fade. If selling pressure starts to ease around current levels, the decline could slow and allow for a rebound toward 1.14, where the 50-period exponential moving average (EMA50, orange line) is currently located.
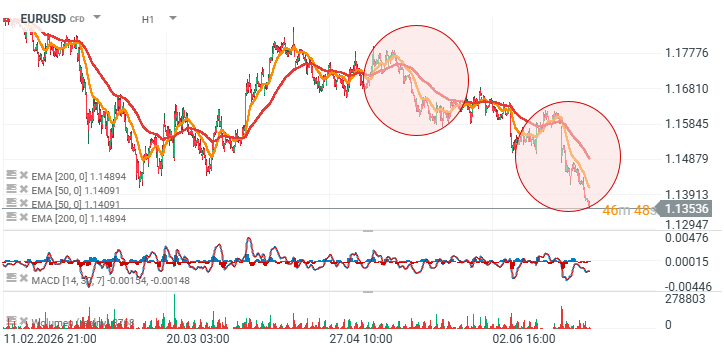
Source: xStation5


