
 EUR /
EUR /  USD — Euro / US Dollar
 JPY — US Dollar / Japanese Yen
 GBP /
GBP /  AUD /
AUD /  CAD — US Dollar / Canadian Dollar
 CHF — US Dollar / Swiss Franc
 NZD /
NZD / Crypto Talk – A bearish impulse on Bitcoin? 🚨 ETFs are flowing back into BTC
- April 20, 2026
- Posted by: Today Markets
- Categories: Competitive research, Funding trends, Markets, Technical Analysis, Trading Crypto

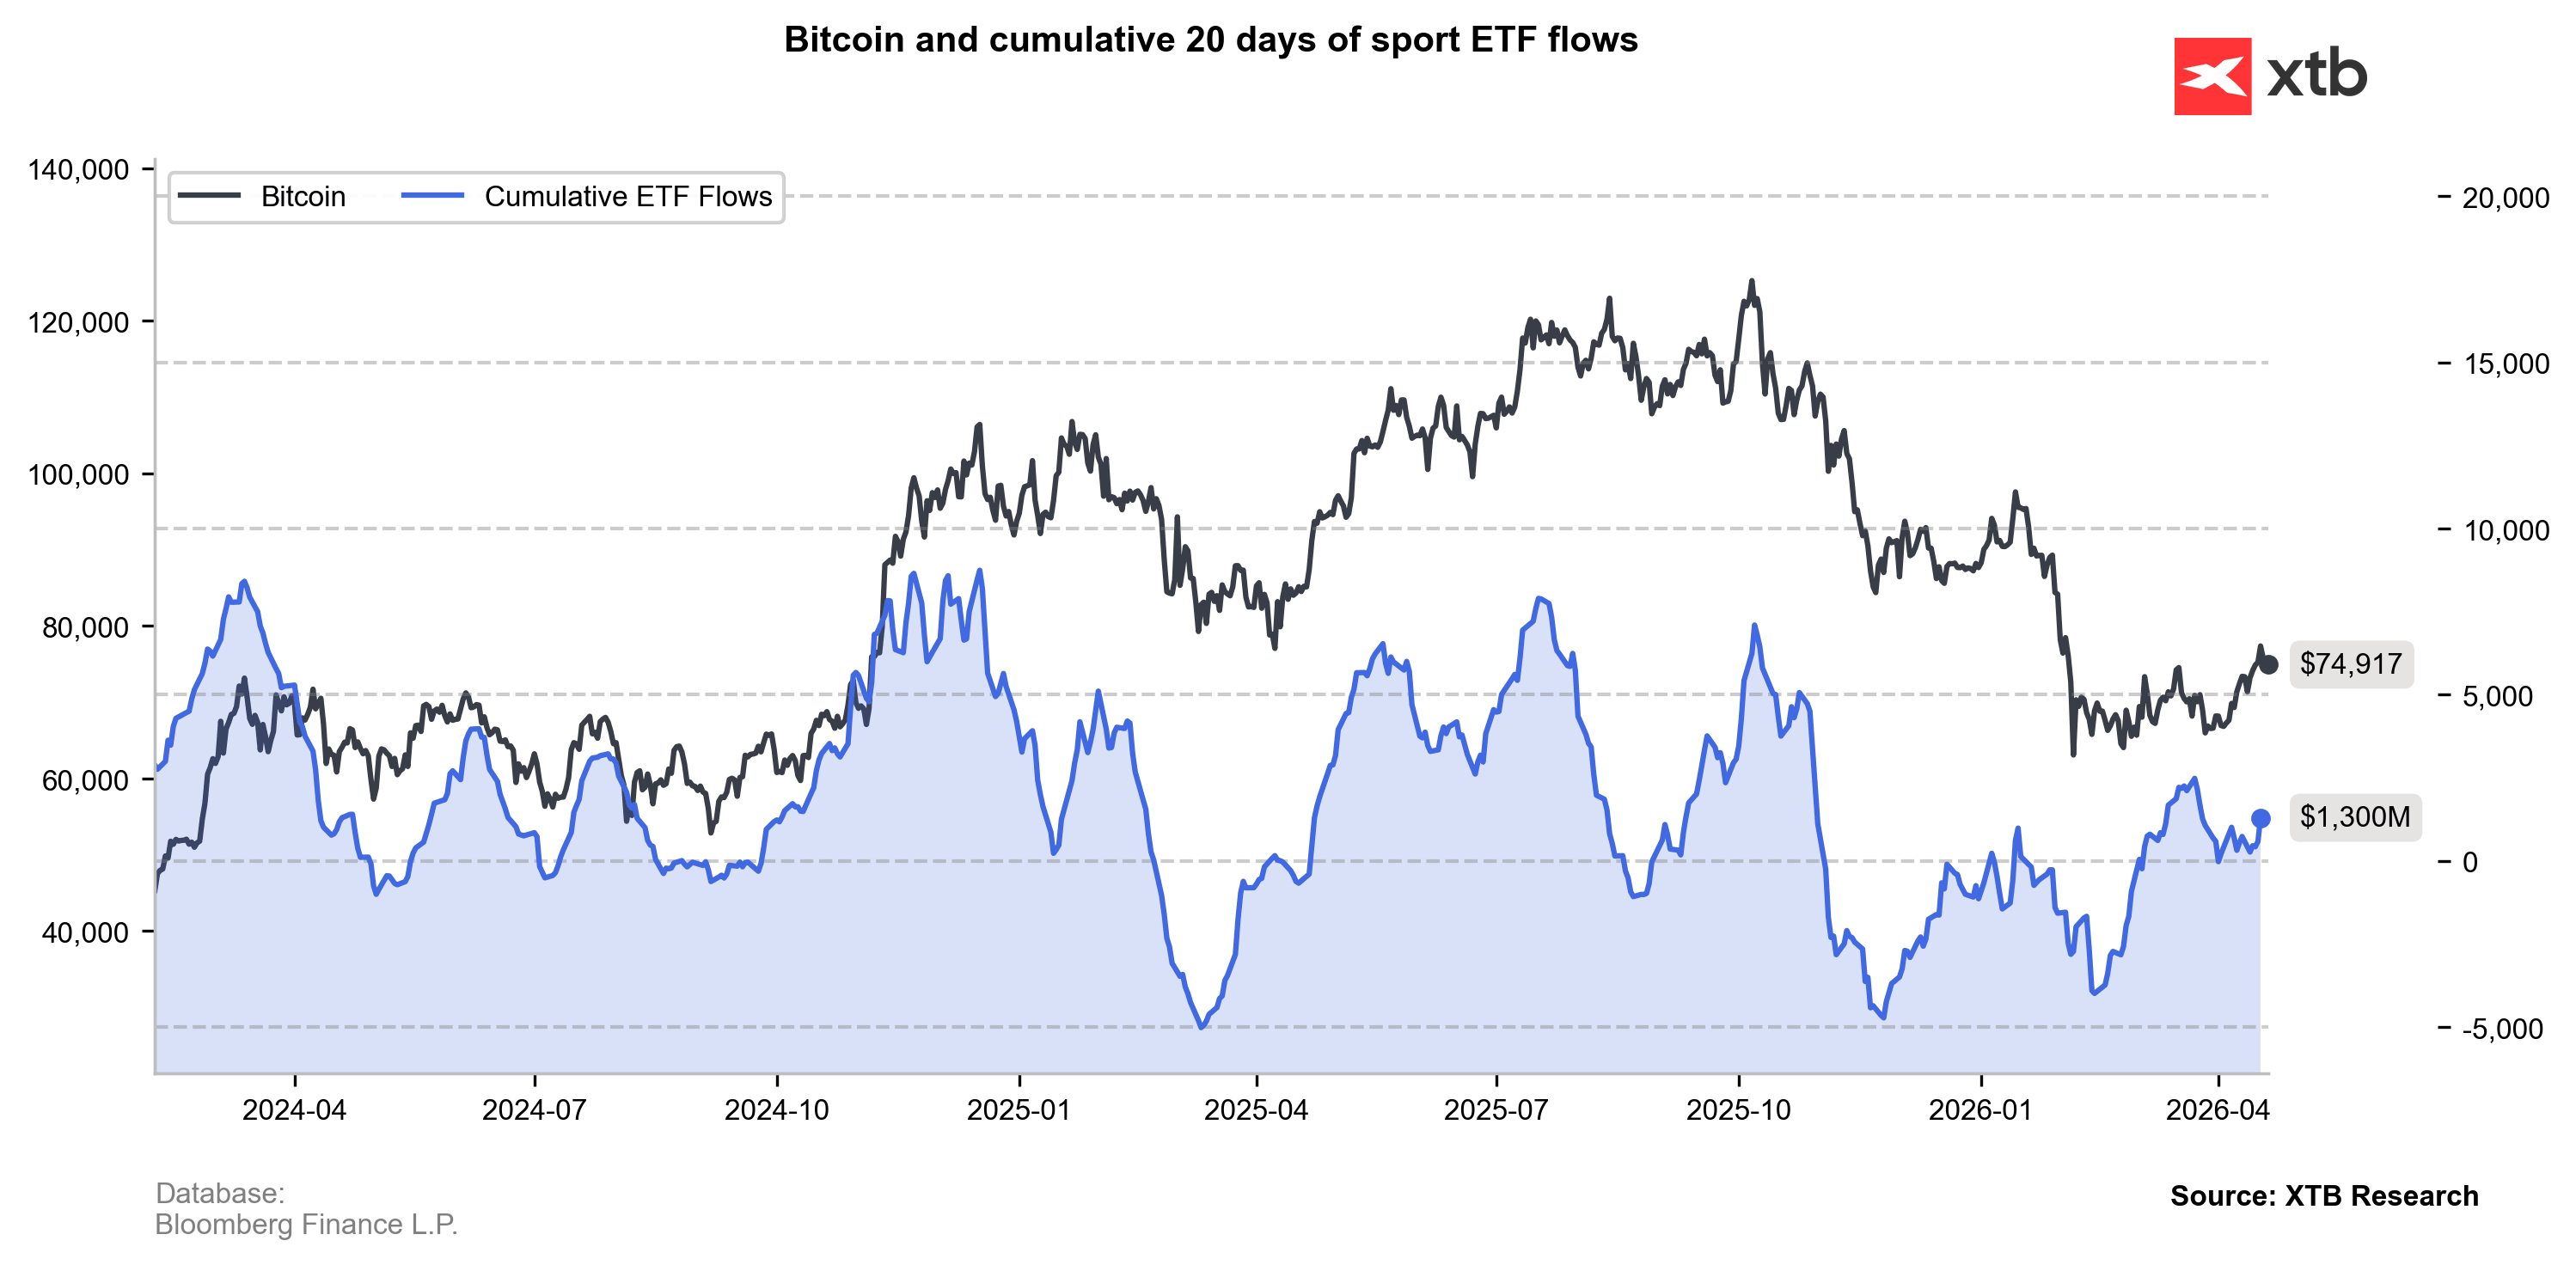
Bitcoin pulled back from nearly $78,000 to just under $75,000 at the start of the new trading week, as tensions between the U.S. and Iran escalated and Tehran reiterated that the Strait of Hormuz remains effectively closed. At the same time, inflows into Bitcoin ETFs have clearly accelerated, with the past week delivering the strongest signal of renewed institutional demand since mid-January.
However, if geopolitical tensions continue to rise, some degree of profit-taking from this investor group cannot be ruled out. According to SoSoValue data, U.S. spot Bitcoin ETFs recorded more than $996 million in net weekly inflows , marking the best result since the week ending January 16. Importantly, this is not a one-off spike. It represents the third consecutive week of positive flows, bringing total inflows over this period to more than $1.8 billion . This marks a clear shift from the weak first quarter, when crypto ETF markets faced significant outflows and declining asset valuations. The current picture is notably improved, although it still falls short of a full return to market euphoria. A more accurate description would be a cautious but visible return of capital.
Source: XTB Research, Bloomberg Finance L.P.
Bitcoin ETFs regain momentum
The scale of recent inflows suggests that institutions are once again increasing their exposure to BTC. Weekly inflows approaching $1 billion not only represent the strongest reading since mid-January, but also confirm that improving sentiment is not limited to a single trading session or short-lived price impulse. Looking more broadly, total inflows across the five major spot crypto ETF categories reached approximately $1.37 billion , a nearly 40% increase week-over-week. This indicates that capital is returning not just to Bitcoin, but to the broader digital asset space.
Source: XTB Research, Bloomberg Finance L.P.
Source: XTB Research, Bloomberg Finance L.P.
BlackRock leads, but new products gain traction
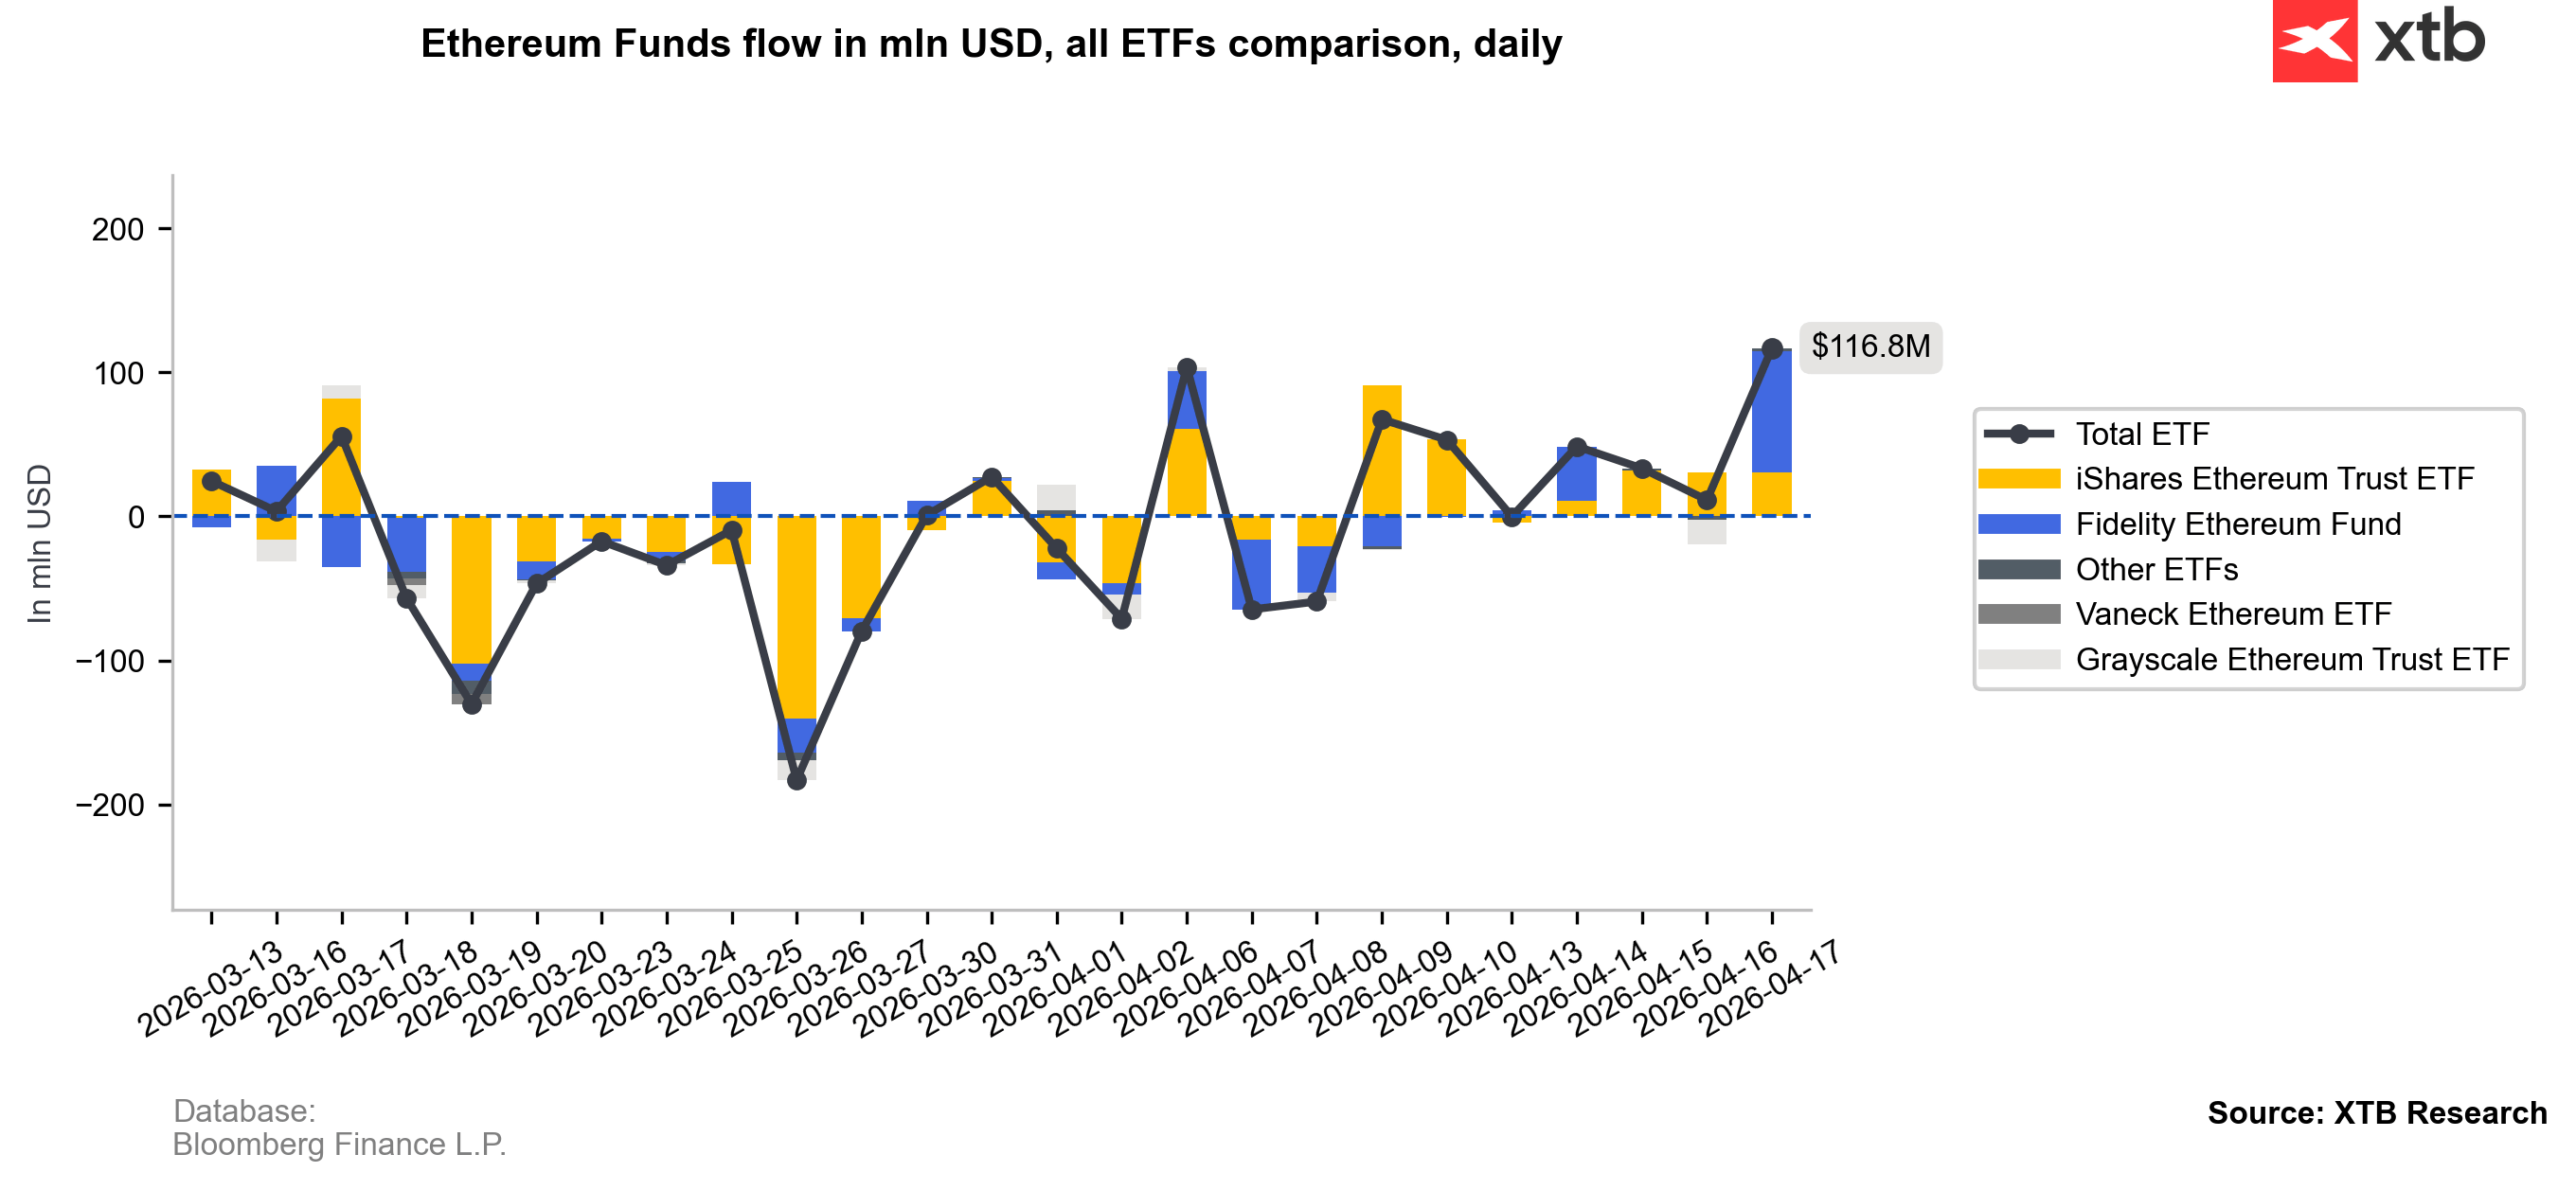
BlackRock remains the dominant player. Its IBIT fund attracted $906 million in inflows over the week, reinforcing its leading position in the spot Bitcoin ETF segment. At the same time, Morgan Stanley’s newly launched MSBT fund recorded $71 million in inflows during its first full trading week following its April 8 debut. This is a meaningful development, as it shows that demand is no longer concentrated solely in the most established products, but is gradually expanding into newer instruments. The recovery is also not limited to Bitcoin. Ethereum ETFs posted their strongest week since mid-January, attracting $275.8 million in inflows. In addition, capital has started to return to selected altcoin-linked products, pointing to a gradual increase in risk appetite.
- Ethereum ETFs: $275.8M inflows
- XRP ETFs: $55.39M
- Solana ETFs: $35.17M
- Chainlink ETFs: $5.30M
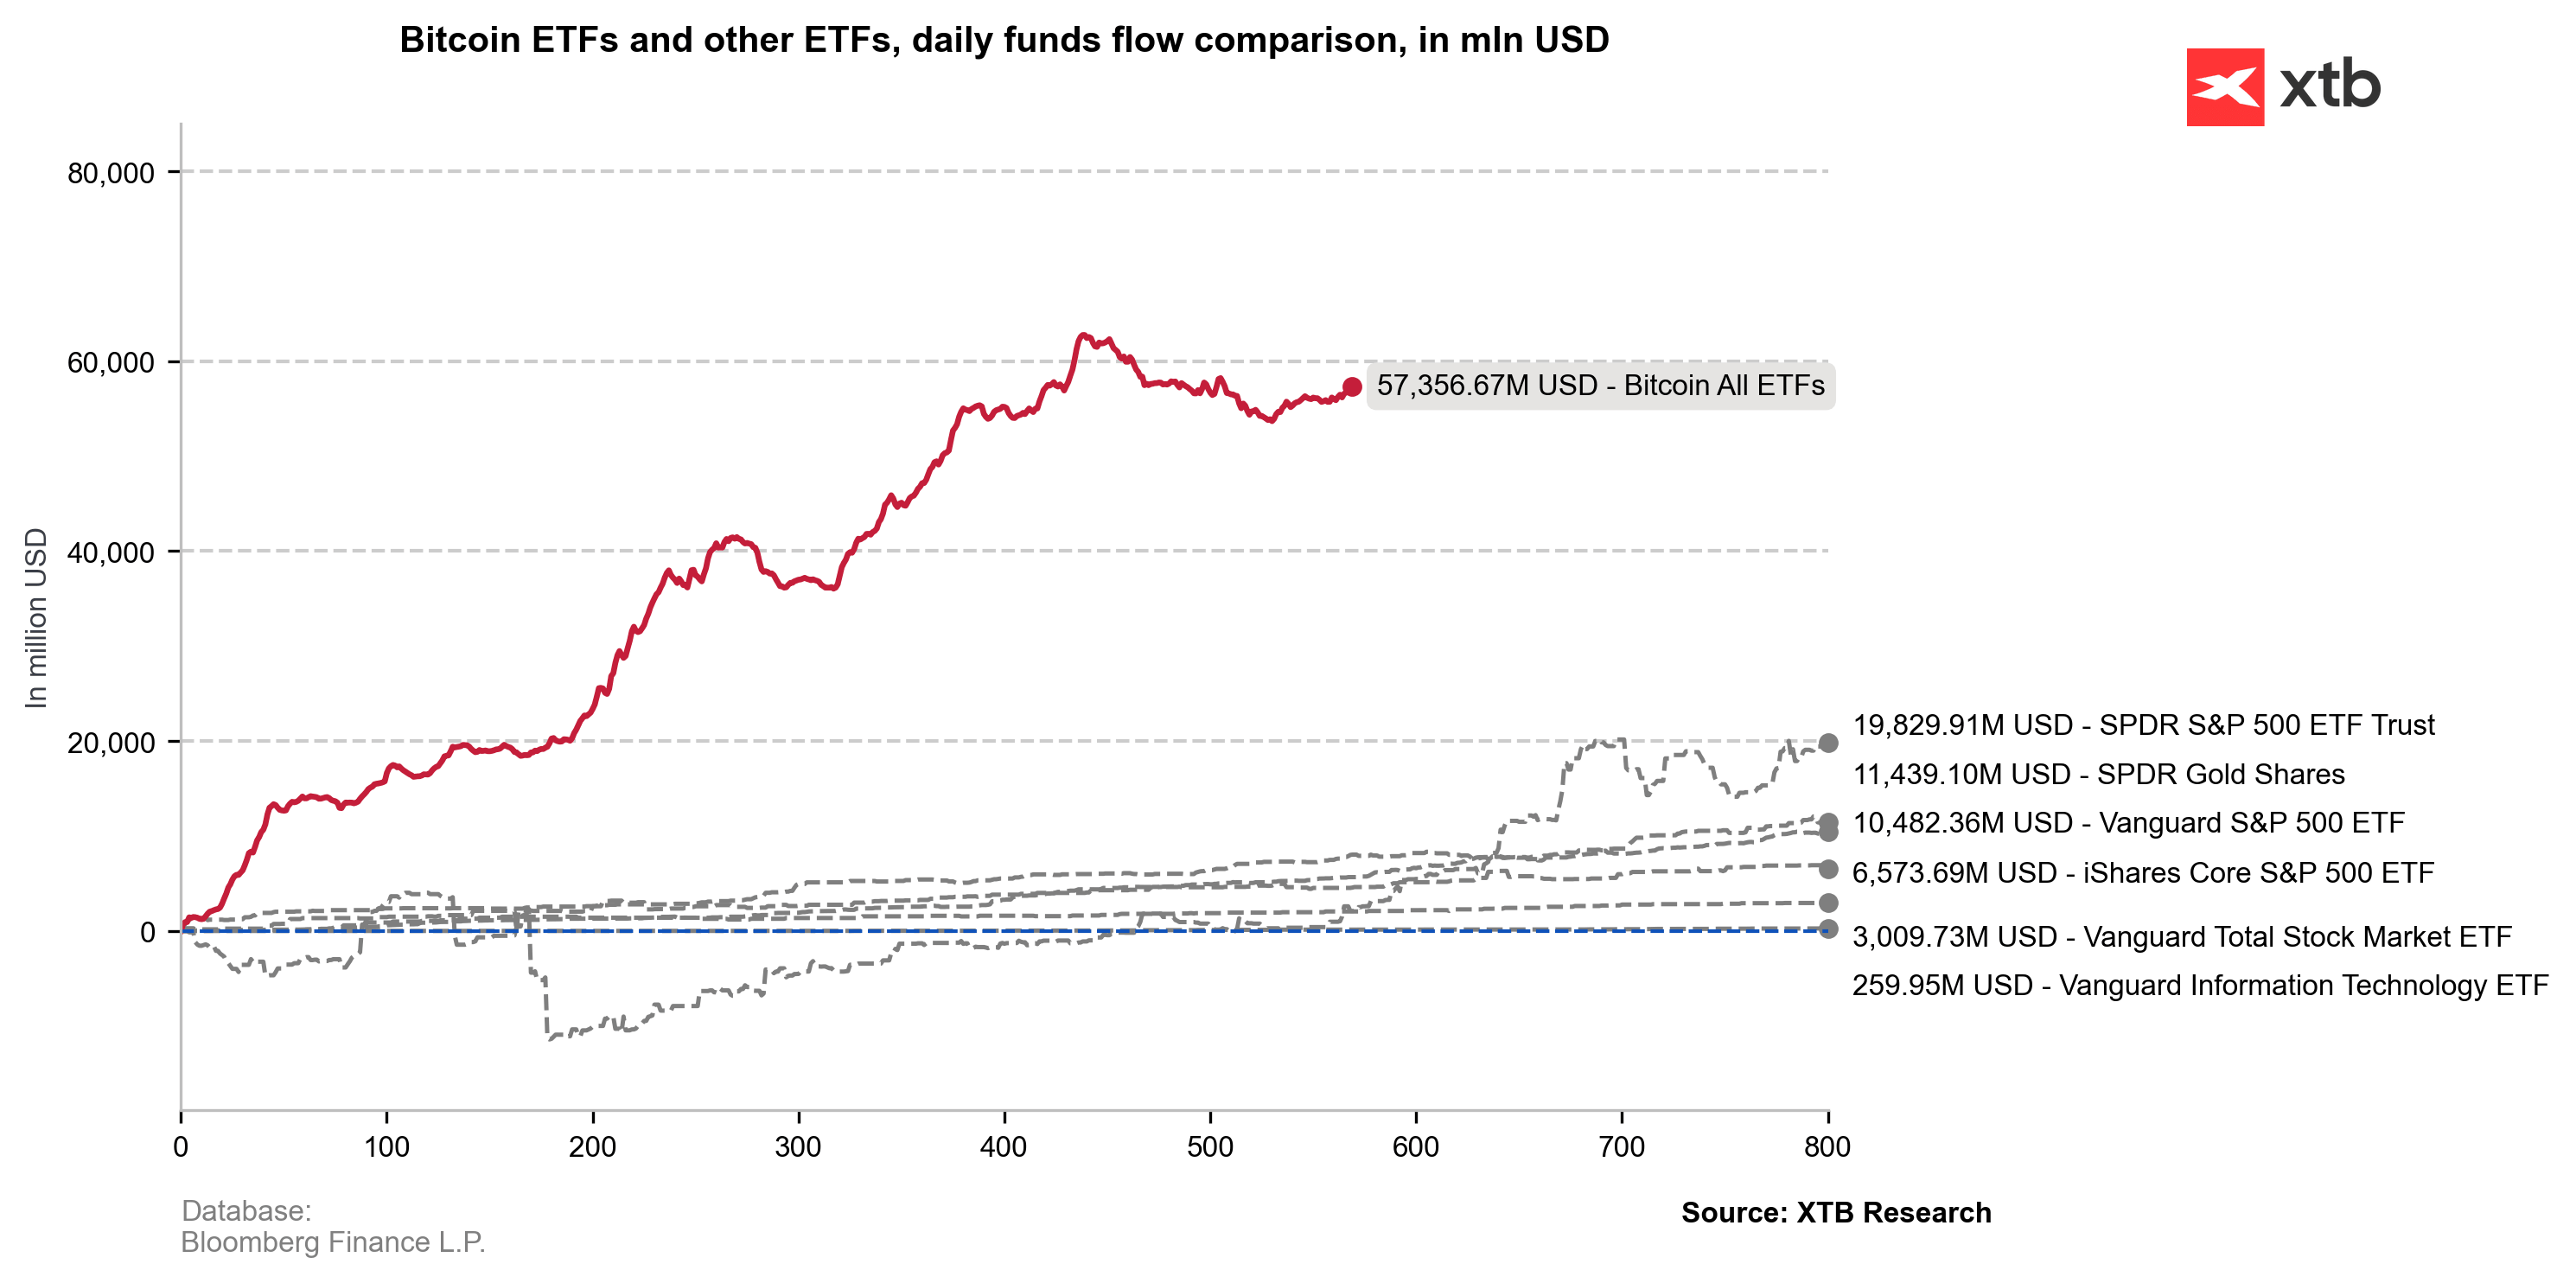
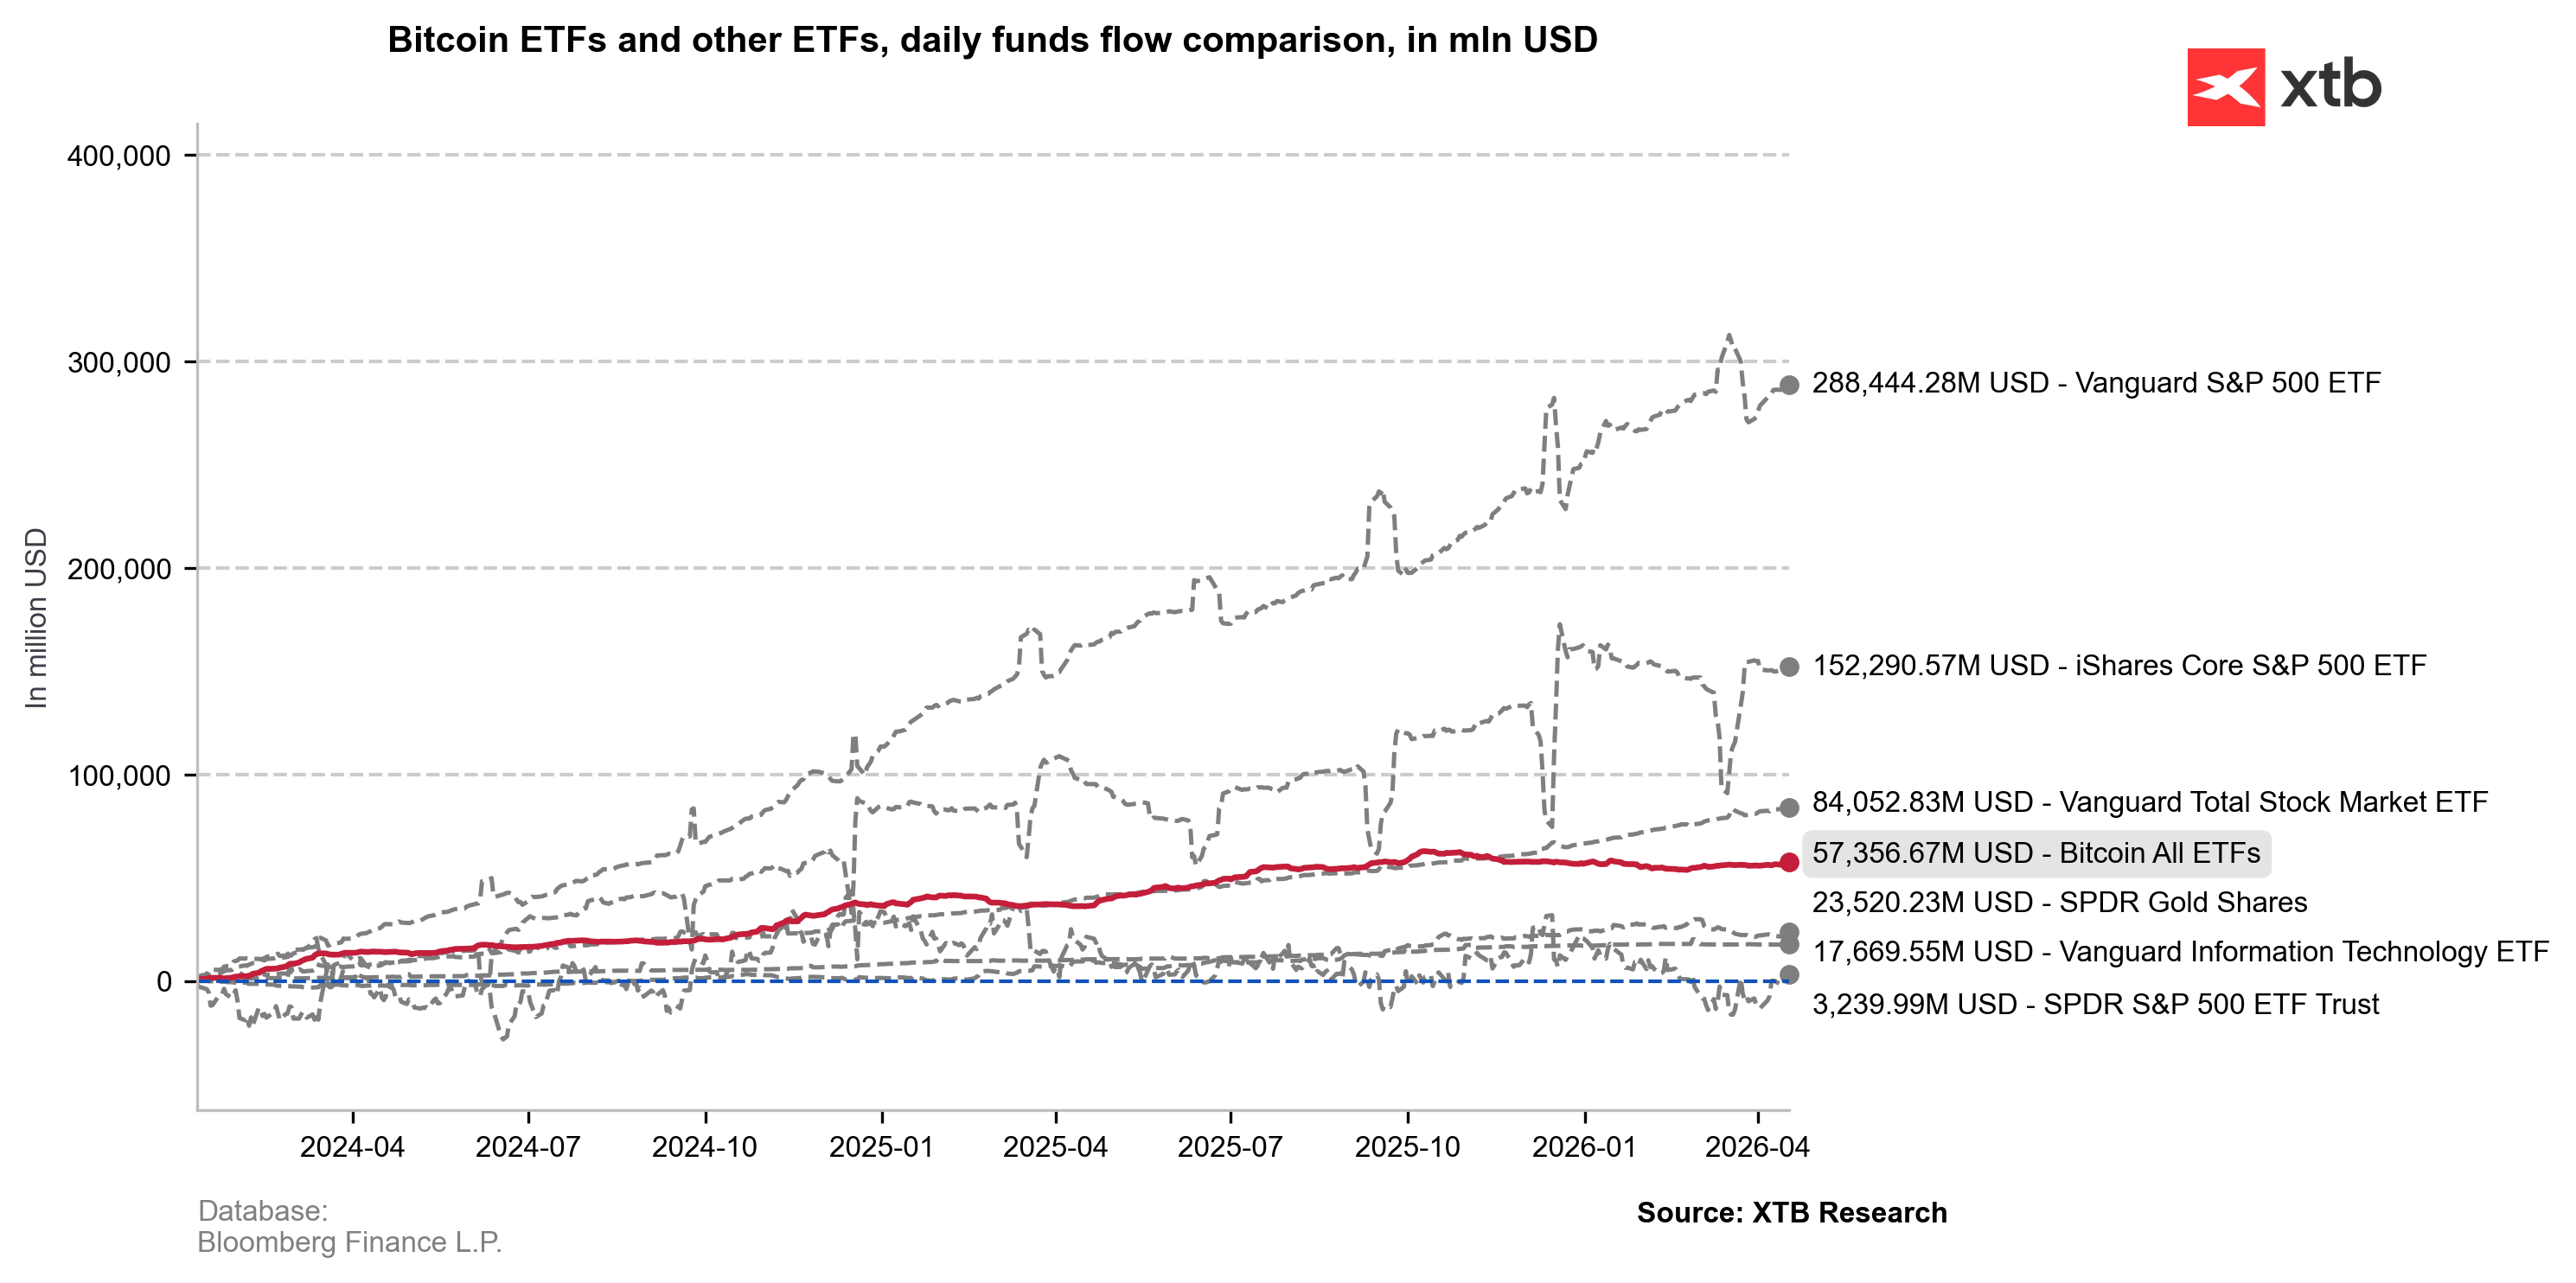
Notably, Solana reversed three consecutive weeks of outflows, while Chainlink ETFs have yet to record a single week of net outflows to date. If we look on the most popular stock market ETFs, we can clearly see that the appetite on Bitcoin ETF IBIT is still very strong.
Source: XTB Research, Bloomberg Finance L.P.
Rebound after a weak first quarter
The current recovery looks more significant when placed in the context of recent market weakness. Following a peak in mid-January, Bitcoin ETF assets declined sharply—from around $128 billion to $83.4 billion by late February , a drop of nearly 35%. Ethereum ETF assets fell even more steeply, losing approximately 46% over the same period. Now, the trend is beginning to reverse. The latest wave of inflows has pushed total Bitcoin ETF net assets back above $100 billion , a symbolic but important threshold. It suggests that the market has not only stabilized but has started to rebuild after earlier losses.
Geopolitics remains a key driver
The recent rebound is not driven solely by technical or market-specific factors. Part of the renewed demand appears to be linked to expectations of a potential de-escalation in U.S.–Iran tensions. Improved sentiment around geopolitical risks has encouraged some institutional investors to increase long exposure via Bitcoin ETFs. However, the situation remains fragile. Alongside signs of possible diplomatic engagement, reports of a U.S. seizure of an Iranian vessel and ongoing tensions around the Strait of Hormuz highlight the risk of renewed escalation. As a result, while sentiment has improved, there is still no clear confirmation that geopolitical risk is fully receding. Bitcoin itself has pulled back by nearly $3,000 from recent local highs.
Bitcoin holds ground, but caution remains. Will the Fed step in?
Despite mixed signals, Bitcoin price action remains relatively stable. In one market snapshot, BTC briefly moved above $77,000 , supporting broader risk sentiment, including gains in equities. At the same time, prices have hovered closer to $75,000 in the short term, suggesting that the market is not yet ready to fully embrace a sustained bullish trend. This reflects a transitional phase: capital is returning, but cautiously. Flows are improving, yet investors remain highly sensitive to macroeconomic and geopolitical developments. In the medium term, the key factor may not be geopolitics but U.S. monetary policy. There is a growing view that a sustained acceleration in crypto ETF inflows will require further rate cuts from the Federal Reserve. This, rather than geopolitical developments alone, may ultimately determine whether the current rebound evolves into a longer-term uptrend. For now, the market is benefiting from improved sentiment, but without a clear shift in the interest rate environment, the upside may remain limited. For investors, this means that while flow data is increasingly supportive, the foundation for a sustained rally is not yet fully in place.
Institutional demand returns, but selectively
The current state of the Bitcoin market is clearly stronger than at the end of the first quarter. We are seeing a third consecutive week of positive ETF inflows, total assets climbing back above $100 billion, and renewed activity across Ethereum and selected altcoins. These are important signals that the market has been waiting for. At the same time, this recovery does not exist in a vacuum. Investors still face geopolitical uncertainty, questions around Federal Reserve policy, and the risk that improving sentiment could reverse quickly if conditions deteriorate. The conclusion is straightforward: institutions are increasing exposure to Bitcoin again, but in a selective and cautious manner. The latest data is clearly positive, but the coming weeks will determine whether ETF flows have entered a new, sustained phase—or whether this is simply a rebound following a deep correction.
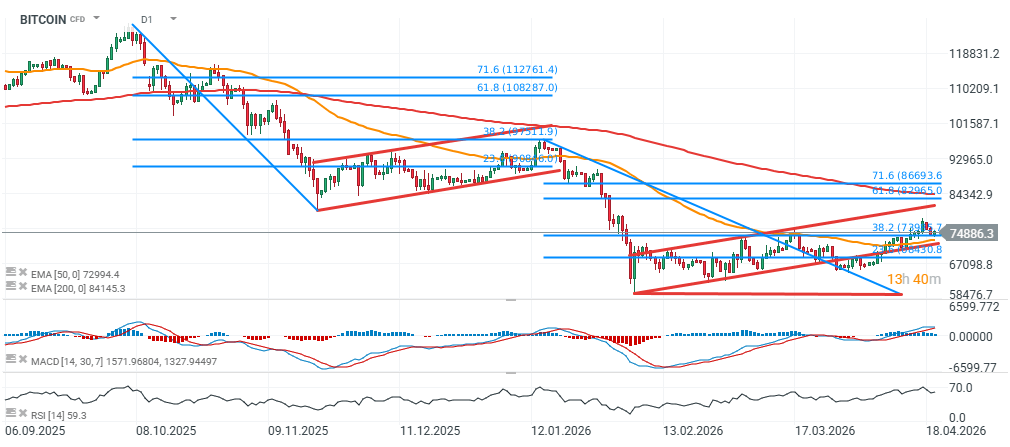
Bitcoin technical outlook (D1)
From a technical perspective, Bitcoin’s price action since autumn 2025 shows notable similarities between the previous and the current downward impulses. This time, the price managed to break above the 38.2% Fibonacci retracement, but the weekend brought renewed downside pressure, pushing BTC back toward the $75,000 area. If a new bearish impulse were to emerge from current levels, a move below $60,000 could not be ruled out. On the upside, key resistance remains in the $77,000–$78,000 zone. A sustained breakout above this range would open the path toward $83,000–$84,000 , where the 61.8% Fibonacci retracement aligns with the 200-day EMA.
Source: xStation5 Looking at the current decline, there are also similarities to the three major downward impulses observed during the 2021–2022 bear market. If history were to “rhyme,” the market could still face one more strong, final sell-off wave from current levels.
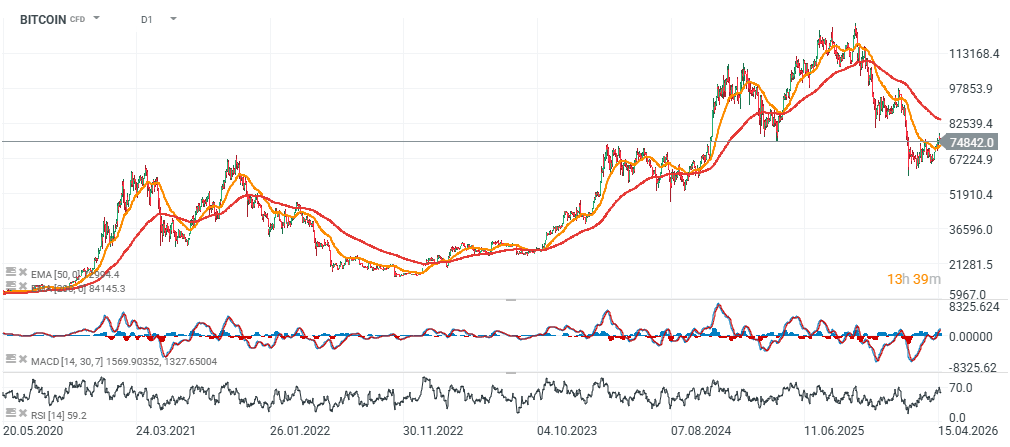
Source: xStation5
The material on this page does not constitute financial advice and does not take into account your level of understanding, investment objectives, financial situation or any other specific needs. All information provided, including opinions, market research, mathematical results and technical analyzes published on the Website or transmitted To you by other means, it is provided for information purposes only and should in no way be construed as an offer or solicitation for a transaction in any financial instrument, nor should the information provided be construed as advice of a legal or financial nature on which any investment decisions you make should be based exclusively To your level of understanding, investment objectives, financial situation, or other specific needs, any decision to act on the information published on the Website or sent to you by other means is entirely at your own risk if you In doubt or unsure about your understanding of a particular product, instrument, service or transaction, you should seek professional or legal advice before trading. Investing in CFDs carries a high level of risk, as they are leveraged products and have small movements Often the market can result in much larger movements in the value of your investment, and this can work against you or in your favor. Please ensure you fully understand the risks involved, taking into account investments objectives and level of experience, before trading and, if necessary, seek independent advice.


