
 EUR /
EUR /  USD — Euro / US Dollar
 JPY — US Dollar / Japanese Yen
 GBP /
GBP /  AUD /
AUD /  CAD — US Dollar / Canadian Dollar
 CHF — US Dollar / Swiss Franc
 NZD /
NZD / 
Trade of The Day – NATGAS
- July 13, 2026
- Posted by: Today Markets
- Categories: Competitive research, Energies, Markets, Technical Analysis
No Comments
Facts:
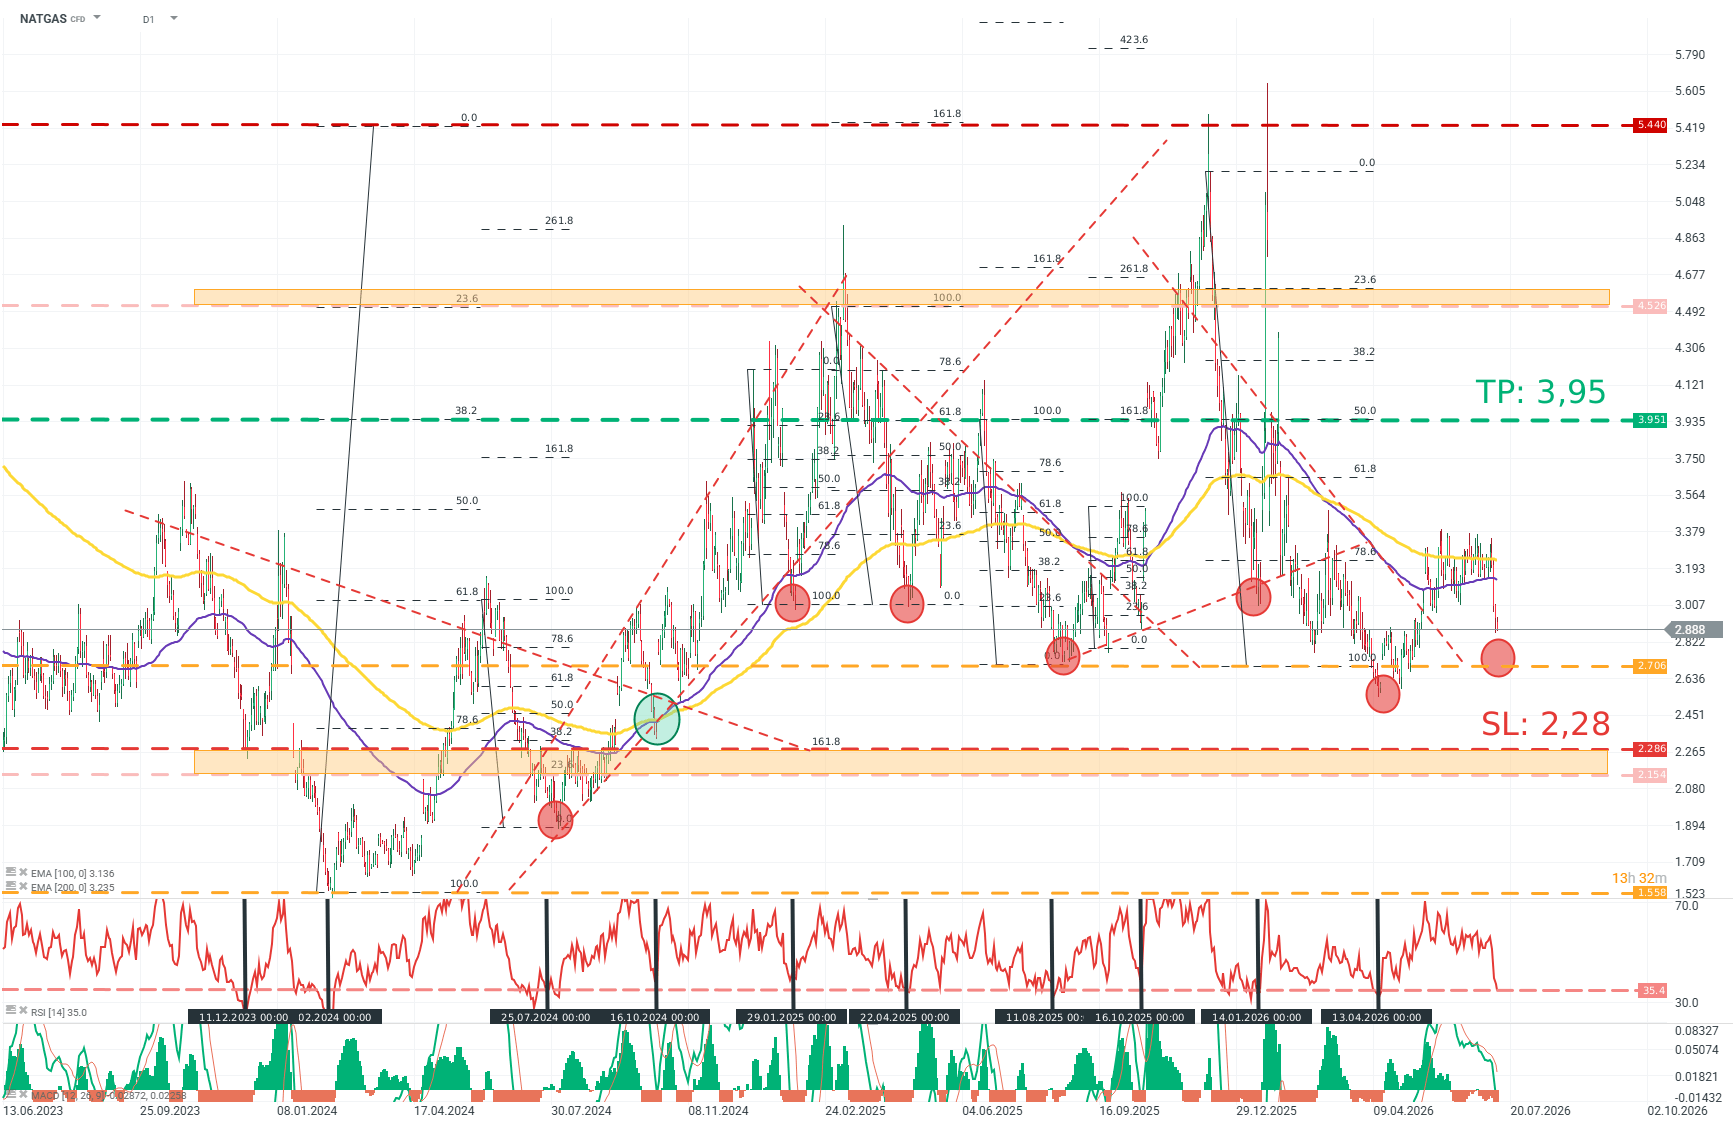
- RSI [14] reached approximately 35.RSI [14] levels near/below 35 over recent months have preceded upward corrections.
- RSI [14] levels near/below 35 over recent months have preceded upward corrections.
- Price defended the support level at 2.7.
- The distance between the EMA 100 and EMA 200 has narrowed over the last 2 months.
Recommendation:
Long position (BUY) on NATGAS at the market price.
- Target price (Take Profit, TP): 3.95
- Stop Loss (SL): 2.28
NATGAS (D1)
Source: xStation5
OPINION :
The market currently appears to be pricing the supply-demand balance clearly in favor of buyers. A combination of expectations regarding HDD/CDD for the coming weeks and relatively high inventories/production pushed US natural gas contract prices to new local lows in April/May. Given where the NATGAS futures market is now, the potential for further declines is clearly limited (for example due to uncertainty surrounding the situation in the Strait of Hormuz), and any upside surprise on the demand side could trigger a sharp upward correction.
Methodology and assumptions:
- The recommendation is based on technical chart analysis, in particular EMA moving averages and Fibonacci levels.
- The target level was determined based on Fibonacci levels.
- The protective stop loss order was set based on a favorable risk-reward ratio and is also based on a Fibonacci level.