
 EUR /
EUR /  USD — Euro / US Dollar
 JPY — US Dollar / Japanese Yen
 GBP /
GBP /  AUD /
AUD /  CAD — US Dollar / Canadian Dollar
 CHF — US Dollar / Swiss Franc
 NZD /
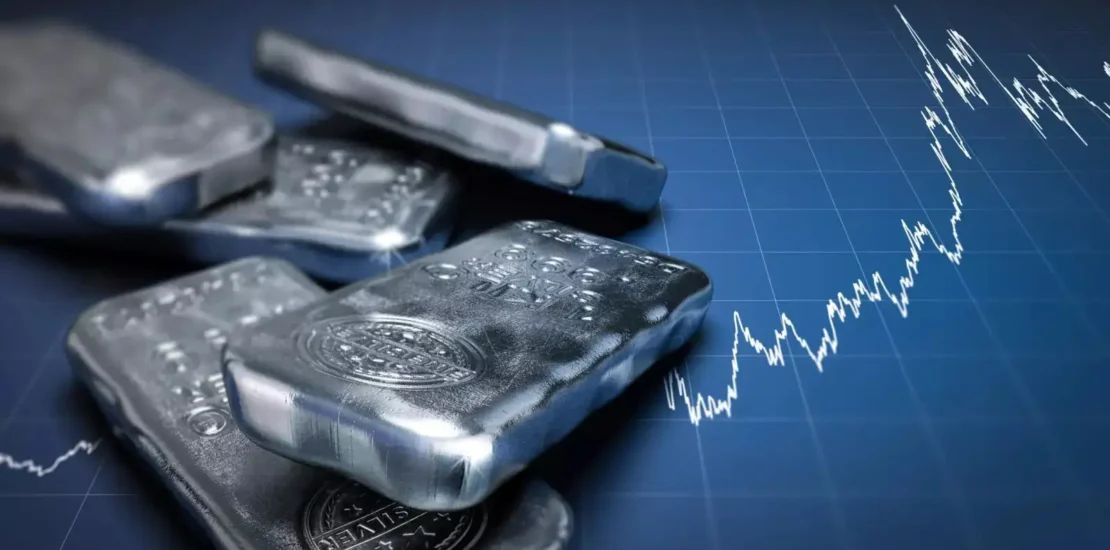
NZD / XAG/USD holds above $80.00, eyes one-month top amid bullish setup
- April 16, 2026
- Posted by: Today Markets
- Categories: Markets, Precious Metals, Technical Analysis
- Silver attracts fresh buyers and remains close to a nearly one-month high set on Wednesday.
- The recent breakout through the 200-SMA on H4 and the 50% Fibo. level favors bullish traders.
- Weakness below the key resistance breakpoints is needed to offset the near-term positive bias.
Silver (XAG/USD) regains positive traction during the Asian session on Thursday and climbs to a fresh daily high, around the $80.50 area in the last hour, though it lacks follow-through. The white metal remains below a nearly one-month high, touched the previous day, and currently trades just above the $80.00 psychological mark, up 1.50% for the day.
From a technical perspective, the overnight modest pullback stalled near the 50% Fibonacci retracement level of the March slide. The subsequent move up favors the XAG/USD bulls. This, along with this week’s breakout above the 200-period Simple Moving Average (SMA) on the 4-hour chart, suggests that the path of least resistance for the white metal is to the upside.
Meanwhile, the Relative Strength Index (RSI) hovers near overbought territory around 69, and the Moving Average Convergence Divergence (MACD) histogram is in positive territory. This further suggests that the momentum remains constructive but also warns that the rally could soon face exhaustion.
On the topside, initial resistance is aligned with the 61.8% Fibo. retracement at $82.86, ahead of a higher barrier at the 78.6% level near $88.83 and the cycle high reference at $96.44. On the downside, immediate support is seen at the 50% retracement at $78.66, followed by the 200-period SMA at $77.49. However, deeper pullbacks would look to the 38.2% Fibo. retracement at $74.47 and the 23.6% level at $69.27 to maintain the broader bullish structure.
(The technical analysis of this story was written with the help of an AI tool.)


