





Today’s trading in the US100 is getting off to a start in a distinctly risk-on mood, driven primarily by a rebound in the oil market and statements from the US and Iran regarding a mutual pause in military attacks. US100 futures are up by around 1.37% on Monday, trading at 28,693 points, making them the strongest of the major US stock indices in this session, outperforming even the S&P 500 (+0.91%) and the Dow Jones.
This move represents an attempt to rebound after two weeks of declines, during which the technology index lost 2.1% last week, whilst falling US bond yields (10-year yields down by 4–5 basis points to 4.63%) are further easing the pressure on growth companies, which are particularly sensitive to the cost of capital.
Investor optimism is, however, selective and fragile, as the geopolitical de-escalation remains merely declarative rather than confirmed by actual data – ship traffic through the Strait of Hormuz remains negligible, and the Houthis are continuing their attacks on Saudi Aramco’s infrastructure.
In the background, the market is awaiting the Fed’s decision on Wednesday (28–29 July), with the market pricing in a 30–38 per cent chance of a rate rise despite earlier expectations of cuts; this represents a real risk factor for the highly valued technology sector, regardless of the temporary support provided by lower energy prices. In addition, this week investors will be keeping an eye on the results of four companies from the Mag7 group and developments regarding Trump’s new wave of tariffs, which experts are already describing as a structural – rather than a temporary – risk factor for global growth.
Technical drawing US100 (D1)
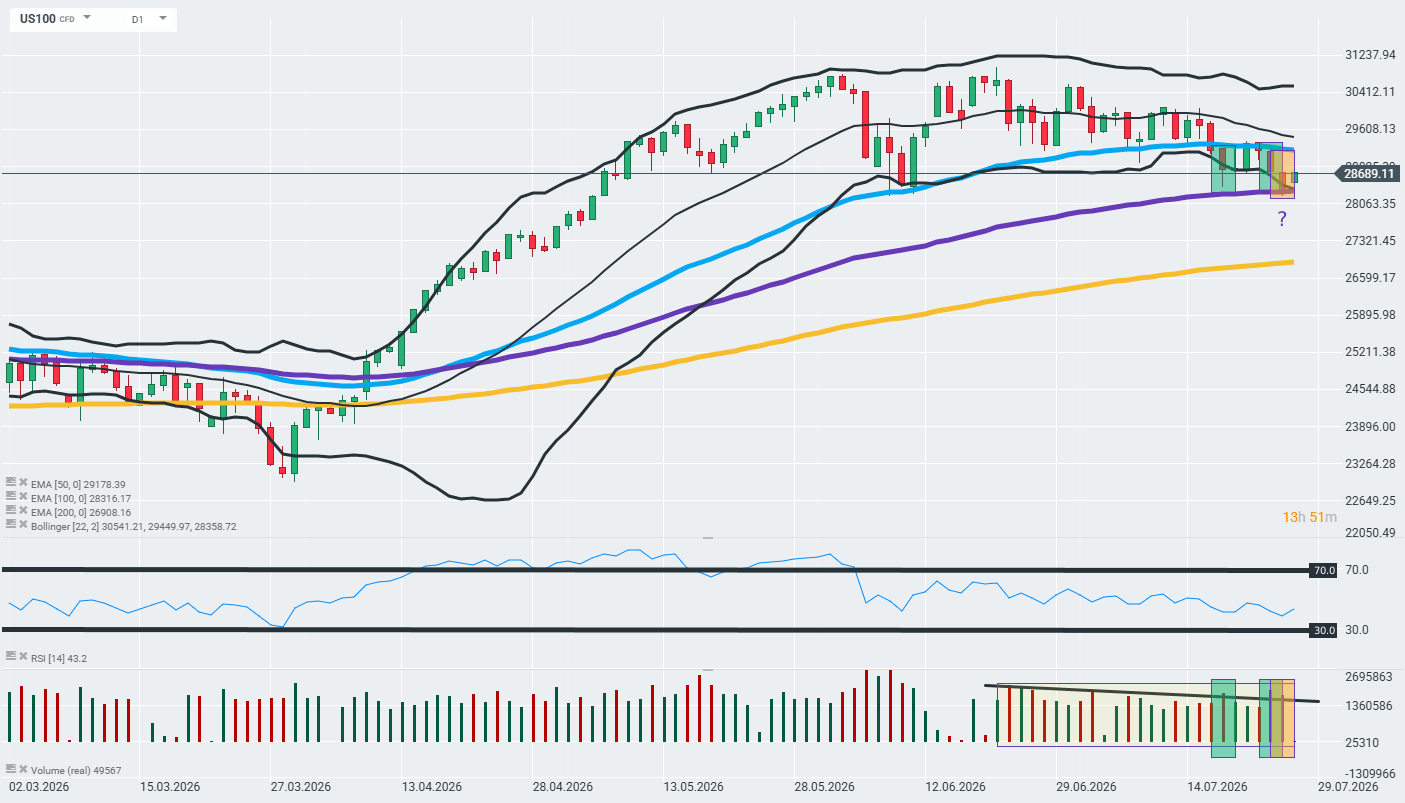
The US100 daily chart shows the index moving within a clear consolidation phase following a strong uptrend from March to June, with the price having fluctuated for several weeks within a range bounded by the upper Bollinger Band (~30,540) and the support and resistance zone around the EMA100 (28,316) and the EMA50 (29,178). On Friday, the market clearly saw stronger volume alongside a fall in price (a bearish candle marked by the yellow zone on the volume chart), without the formation of a significant lower shadow – this suggests that selling pressure at this level was genuine and was not immediately absorbed by the bulls, which, following unsuccessful attempts to retest the upper levels and the EMA100, may indicate a waning dominance of demand in the short term.
The RSI, at 43.2, remains in a neutral, slightly weaker zone, showing neither overbought nor oversold conditions, which is consistent with the index seeking equilibrium following its departure from the upper Bollinger Band and an attempt to stabilise around the EMA50/EMA100. Today’s rebound, driven by geopolitical news (the bullish candle in the top right-hand corner of the chart), partially offsets Friday’s signal of weakness, but with the channel continuing to narrow (as indicated by the trend line on volume in recent sessions), the key factor will be whether buyers can generate volume comparable to Friday’s selling pressure – otherwise, the move may prove to be merely a technical rebound ahead of more fundamental tests in the form of the Fed’s decision, the Mag7 results and a possible resurgence of tensions in the Middle East.