






Learn Technical Analysis
Learn how traders use price action, candlestick charts, trends, support and resistance, and chart patterns to understand market behaviour and identify potential trading opportunities.
What is Technical Analysis?
Technical analysis is a method of studying market behaviour through price and trading activity. Rather than focusing primarily on the underlying value of an asset, technical analysts examine charts to identify trends, momentum, potential turning points and areas where buying or selling pressure may change.
Price tells a story
Every market transaction contributes to price movement. By studying how price behaves over time, traders can look for recurring structures and changes in momentum.
Technical analysis can be used across many markets, including forex, indices, commodities, stocks and other actively traded instruments.
It is particularly useful when traders are trying to improve the timing of entries, exits and short-term trading decisions.
Technical vs Fundamental Analysis
Fundamental analysis generally focuses on factors such as economic conditions, company performance, earnings and long-term value.
Technical analysis focuses primarily on market data, price behaviour and chart structures.
Many traders combine both approaches to create a broader view of the market.
Three ideas every technical trader should understand
Price
Price is the central piece of technical analysis. Charts allow traders to examine how an instrument has moved across different time periods.
Trends
Markets can move upward, downward or sideways. Identifying the prevailing direction can help traders understand the broader market environment.
Market Psychology
Charts reflect the interaction between buyers and sellers. Patterns can therefore provide clues about changing sentiment and market behaviour.
Learn to read candlestick charts
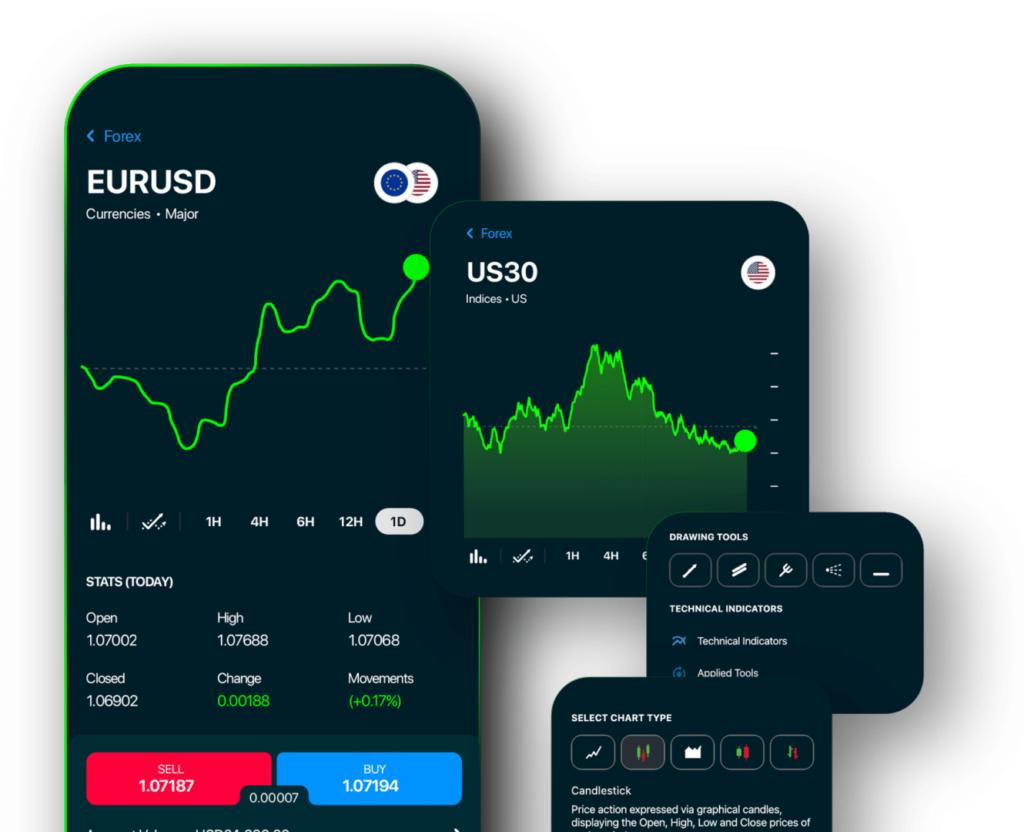
Candlestick charts provide considerably more information than a simple closing-price line. Each candle can show the open, high, low and close for a selected period.
Support and Resistance
Support and resistance are among the most widely used concepts in technical analysis. They represent areas where buying or selling pressure has historically influenced price behaviour.
Support
A price area where buying interest has previously helped prevent or slow further declines.
Resistance
A price area where selling pressure has previously limited or slowed upward movement.
Identify the market trend
Before looking for individual signals, traders often start by identifying the broader direction of price.
Uptrend
Price generally progresses through a sequence of higher highs and higher lows.
Downtrend
Price generally forms lower highs and lower lows as selling pressure dominates.
Sideways / Range
Price moves between identifiable areas without establishing a sustained directional trend.
Common patterns traders watch
Chart patterns can help traders organise price behaviour into recognisable structures. They should be treated as potential signals rather than guarantees of future market direction.
Double Top
A potential bearish reversal structure in which price tests a similar high twice before breaking lower through an important support area.
Double Bottom
A potential bullish reversal structure where price tests a similar low twice before moving higher through a key resistance area.
Head and Shoulders
A reversal formation characterised by three peaks, with the central peak higher than the surrounding peaks.
Breakouts
A breakout occurs when price moves beyond a previously important support or resistance zone. Traders often watch for confirmation and follow through.
How to perform technical analysis
A structured process can help prevent traders from focusing on isolated signals without considering the wider market context.
Choose the Market
Select the instrument you want to analyse.
Select a Timeframe
Examine the market over a timeframe appropriate to your trading approach.
Find the Trend
Determine whether price is rising, falling or ranging.
Mark Key Levels
Identify potential support, resistance and significant price zones.
Confirm the Setup
Consider multiple pieces of evidence before making a trading decision.
Technical analysis is not a guarantee
No chart pattern or indicator can predict markets with certainty. Technical analysis should form part of a broader trading plan that includes appropriate risk management.
Manage Your Risk
- Determine your acceptable risk before entering a trade.
- Consider where your trading idea would be invalidated.
- Avoid allowing a single position to expose you to excessive losses.
- Consider position size as part of your overall strategy.
Avoid Common Mistakes
- Do not treat one indicator as a complete trading system.
- Avoid interpreting patterns without considering the broader trend.
- Remember that historical price behaviour does not guarantee future results.
- Use technical analysis alongside disciplined money and risk management.
Put Technical Analysis Into Practice
Build your understanding of market structure, price action and chart patterns, then explore the markets through the Today Markets trading environment.
Explore TradingThe educational structure of this guide was informed by introductory technical-analysis material from the Stephen D. Cutler Center for Investments and Finance at Babson College, including concepts covering technical analysis, candlestick charts, support and resistance and market trends.