





Commodity Overview
- The current session in the commodity market brings a marked strengthening of the energy sector, driven by escalating geopolitical tensions in the Middle East. WTI crude oil is up 1.90% today, continuing a strong weekly rally of +7.34%, which places both WTI (+1.89σ) and Brent (+1.93σ) at extremely high levels relative to their 5-year averages.
- These sharp surges, driving Brent crude prices toward USD 108, are a direct response to drone attacks on Saudi transmission infrastructure and unrest in the Bab al-Mandab Strait, raising justified concerns over global supply stability. In the agricultural commodities and metals segments, we observe a more mixed market picture. The leader in daily gains during yesterday’s session was orange juice (+6.01%), while lean hogs lost the most yesterday (-3.35%), and today zinc holds the second place in declines (-1.61%).
- Zinc’s weekly discount of 7.66% stems from persistently weak domestic demand in China, although over the long term this metal, similar to copper (+2.46σ), remains historically expensive.
- In the near term, Fed interest rate decisions and news from the Middle East will be crucial for markets, directly determining the further valuation of strategic commodities, including gold (+1.54σ), which remains at high levels.
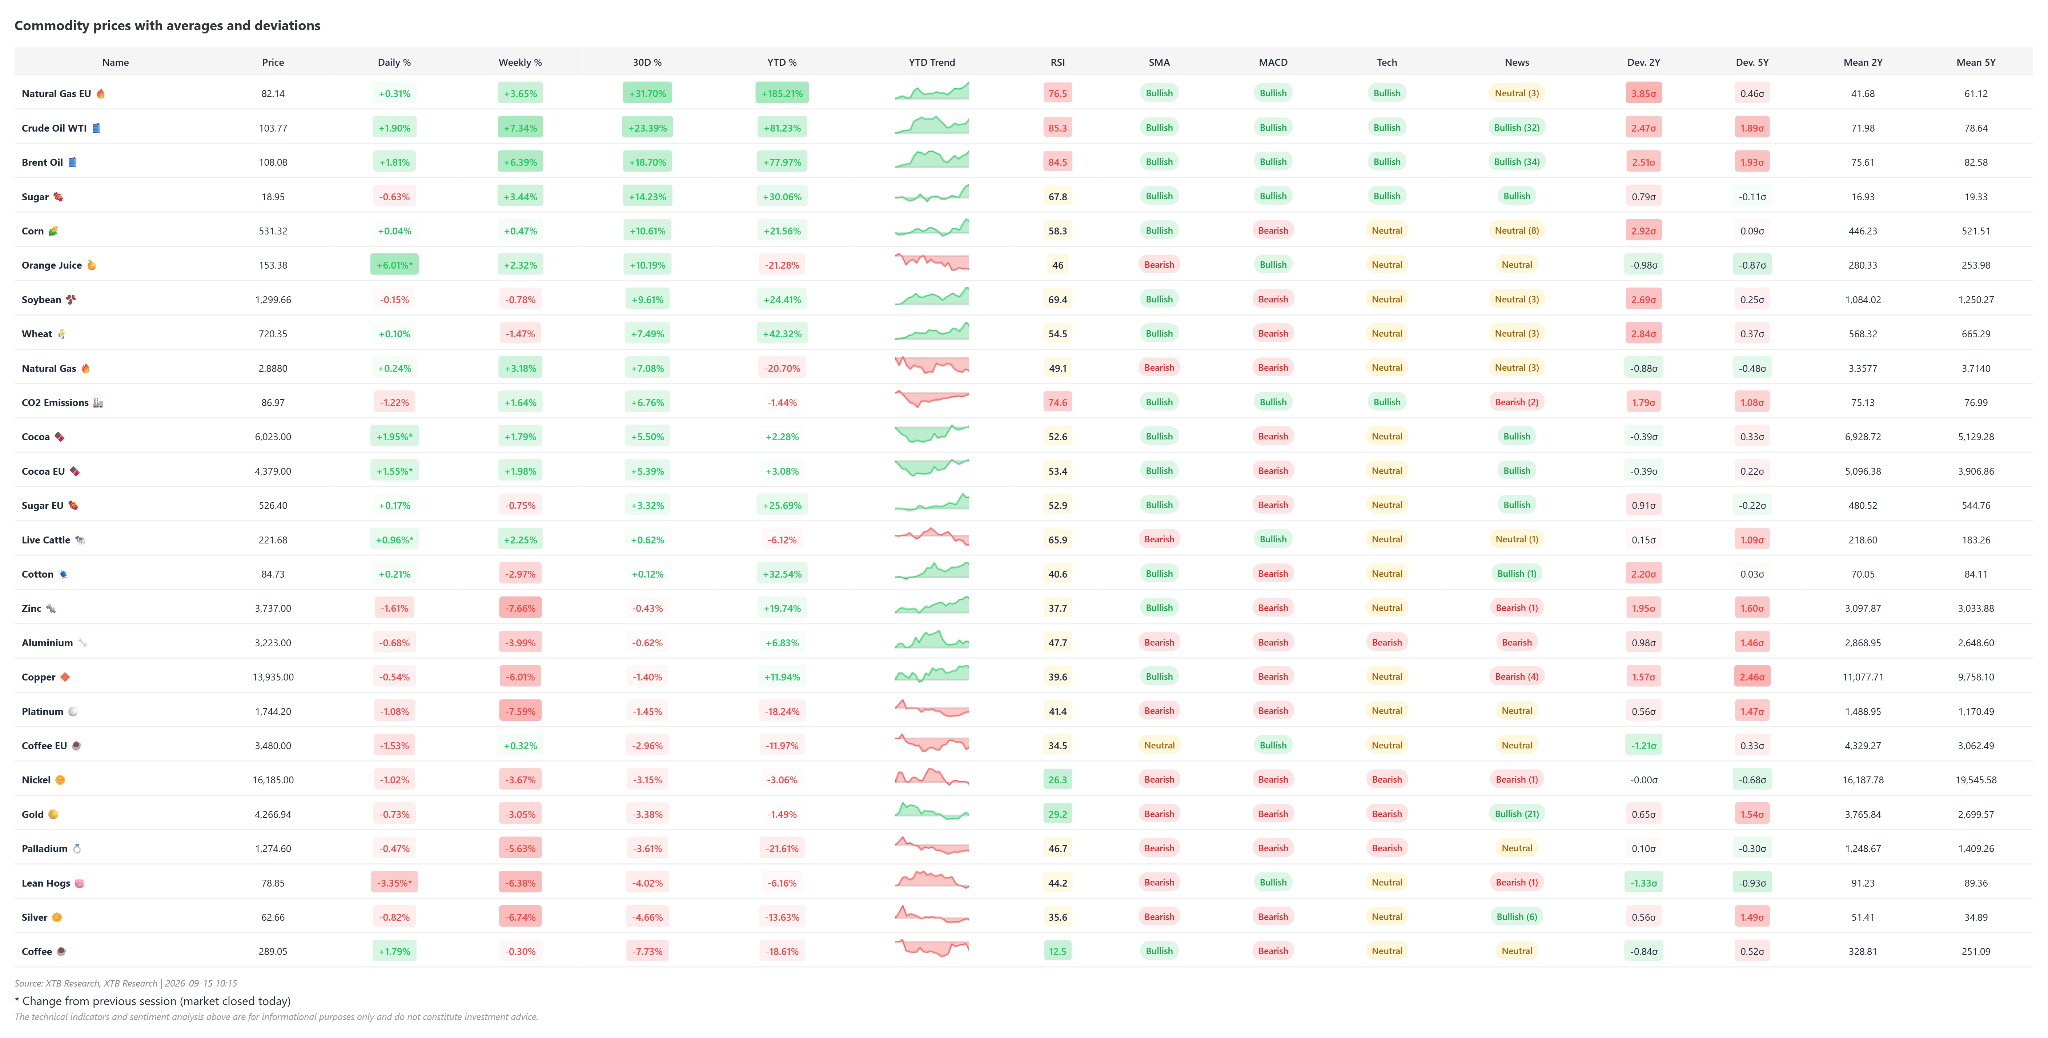
It is worth noting the low RSI on the part of coffee, gold, and nickel, while at the same time an extremely high level is found on oil and European gas. Source: XTB
Natgas
- The natural gas market exhibits significant geographic divergence between Europe and North America.
- European natural gas quotes (NATGAS.EU) as of September 15, 2026, stand at 83 EUR/MWh, showing a powerful upward momentum (+32.26% m/m and +186.42% YTD), fueled by concerns over the stability of seaborne LNG supplies.
- In turn, American natural gas (NATGAS) is valued at 2.878 USD/MMBtu (+6.71% m/m, but -20.98% YTD), remaining in broad consolidation. In terms of technical indicators, NATGAS.EU is in a strong uptrend (RSI at 77 signals strong overbought conditions and proximity to resistance at 85.00), while American NATGAS shows neutral-to-bearish signals with an RSI of 48, key resistance in the 3.00 USD region, and support at 2.75 USD.
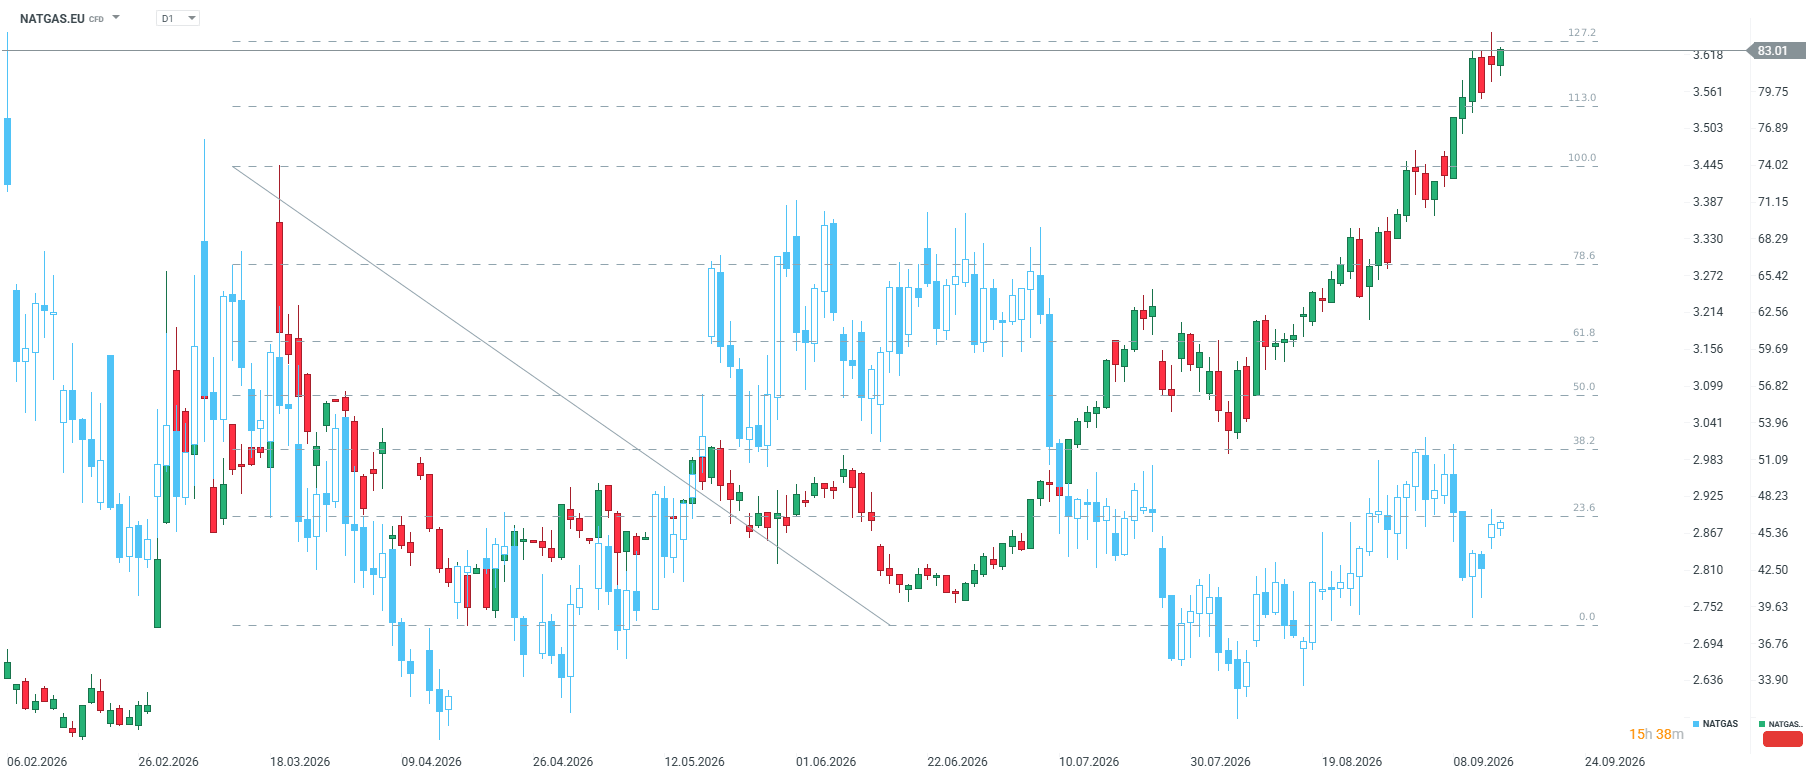
European Natgas is already trading around 83 EUR/MWh, approaching resistance associated with the 127.2 Fibonacci retracement of the March-April downward wave. Source: xStation5
Fundamental and Market Context
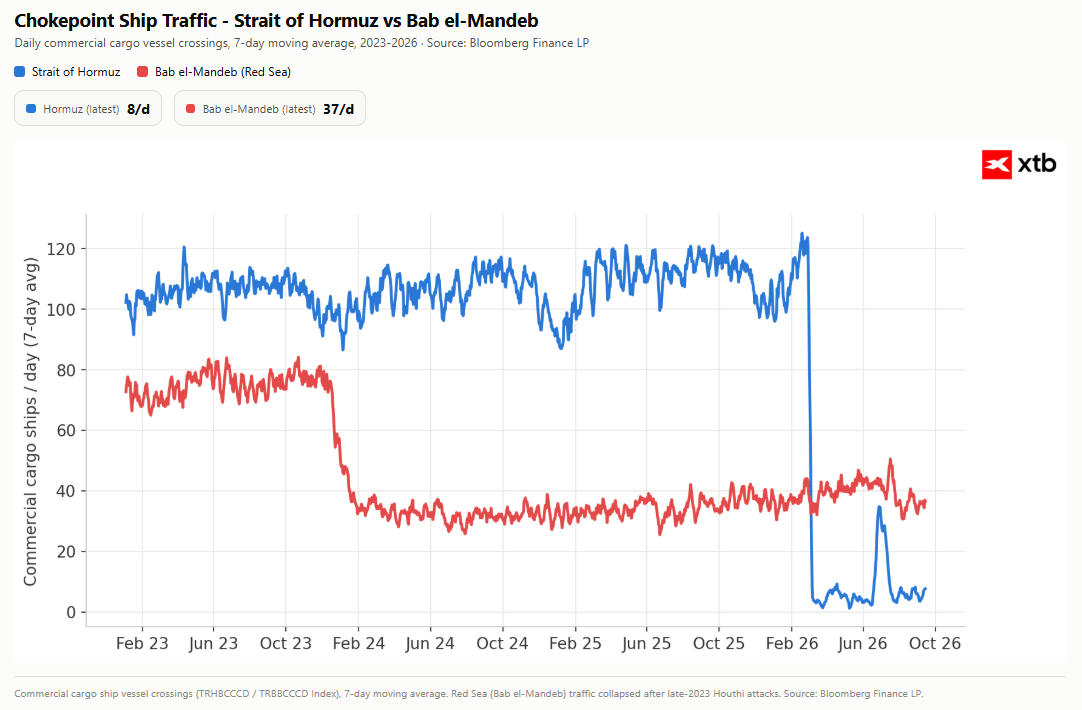
- Geopolitical tensions in the Middle East and the risk of shipping disruptions at strategic chokepoints (including the Strait of Hormuz) are increasing the risk premium across the global energy market and threatening the continuity of LNG supplies to Europe and Asia.
- Chinese refiners are shifting away from depleting their own energy reserves toward an active return to spot market purchases, paying high premiums for cargoes, which intensifies direct price competition for available LNG volumes with European buyers.
- Local seasonal preparations for the winter period in the Northern Hemisphere are forcing European importers to maintain a high rate of storage injection, even at record spot prices.
- The rise in 10-year US Treasury yields above 5% and a strong US dollar elevate financing and gas inventory holding costs, curbing upward price momentum in the US market.
- The latest EIA gas storage report showed a larger-than-expected build, demonstrating that we are exiting the cooling season, while the current El Niño should delay the start of the heating season, potentially driving US gas inventories toward 5-year highs.
- On the other hand, structural long-term trends, including AI technology developments and growing data center electricity demand, sustain natural gas demand as a transition fuel in the energy sector.
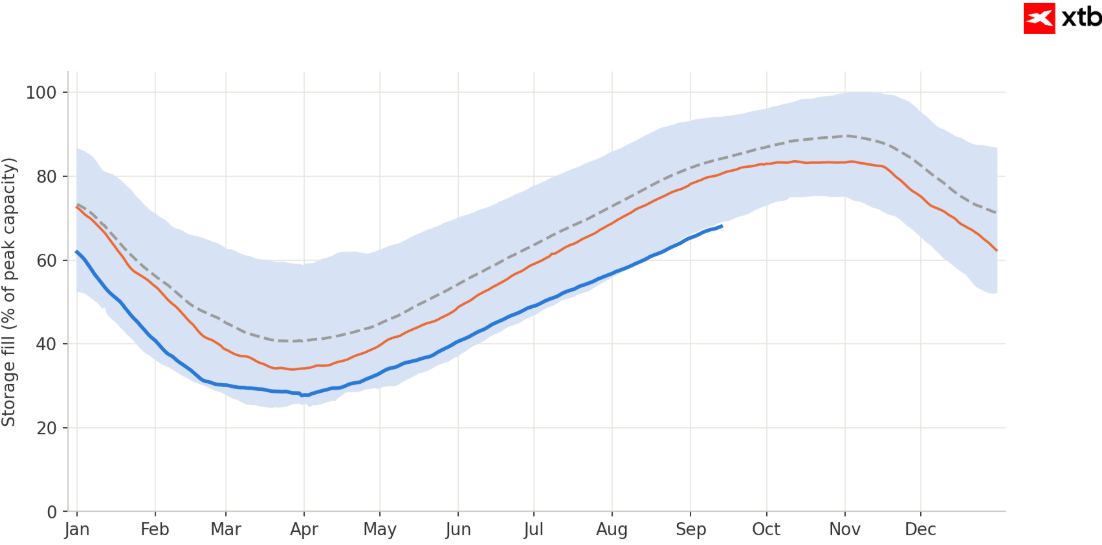
Storage gas levels in Europe currently stand at 68%, compared to a 5-year average of 84%. Source: Bloomberg Finance LP, XTB
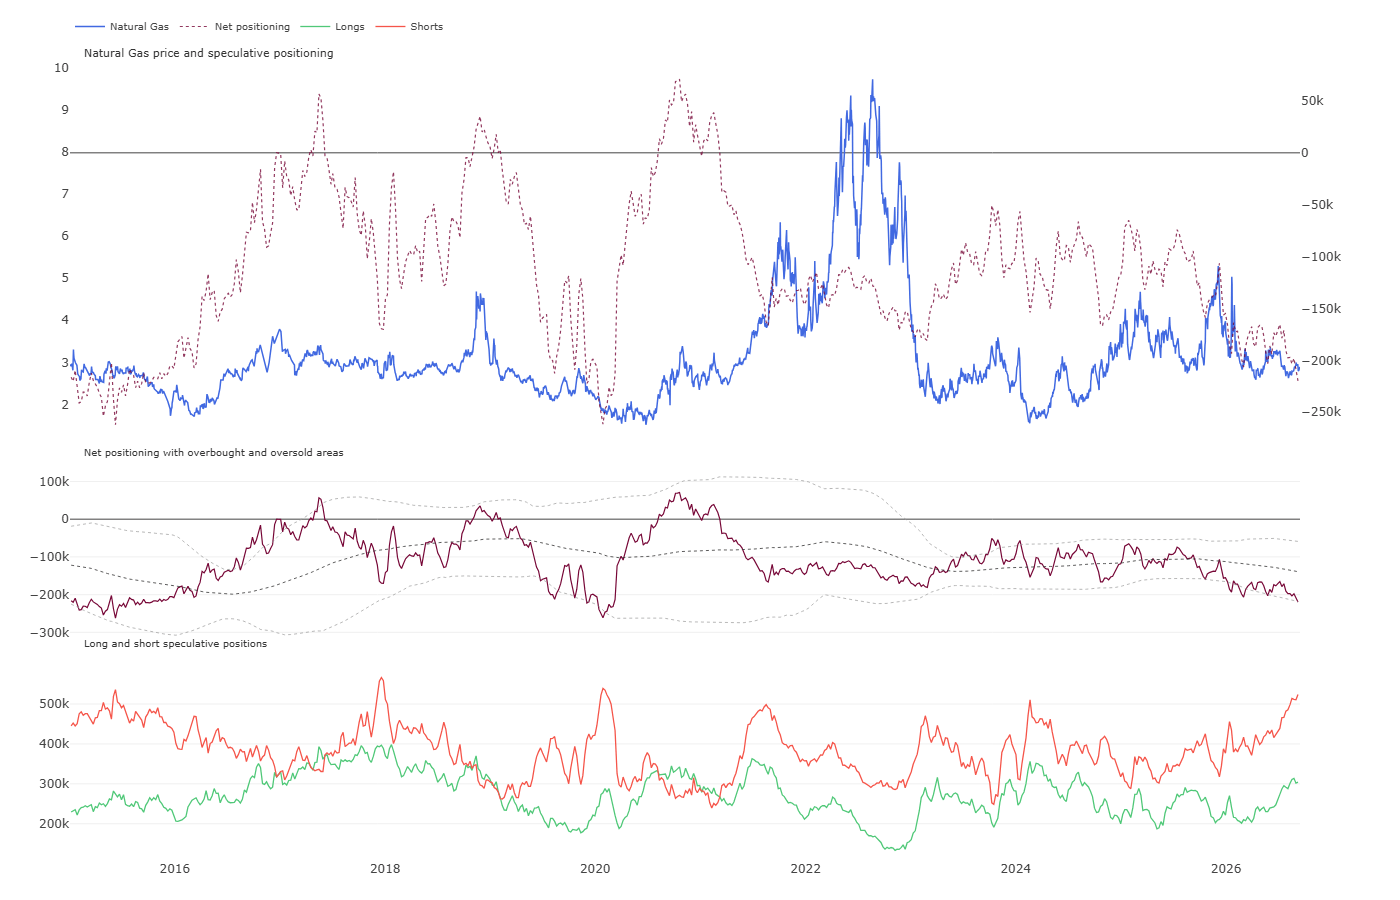
The number of short positions on American NATGAS has risen quite significantly to extremely high levels, similar to 2017, 2020, 2021, and 2024. However, this did not always generate a bullish signal. Nevertheless, net positioning currently resides in deeply oversold territory. Source: XTB
Historical Valuation (Z-score)
- Z-score indicators reflect a clear divergence in valuation between the two gas markets. For European NATGAS.EU, the one-year Z1Y score reaches +2.94, Z2Y stands at +3.88, and the 5-year Z5Y has risen in recent months from -0.40 to +0.47, signaling strong market overheating and a growing geopolitical risk premium.
- Conversely, for American NATGAS, the indicators point to continued undervaluation: Z1Y stands at -0.72, Z2Y at -0.90, and Z5Y sits at -0.48 (following a gradual recovery from -0.61 recorded a month ago).
- This implies that the European gas market carries a high risk of a downside correction in the event of de-escalation, whereas the American market has limited room for further declines and a greater potential for an asymmetric rebound.
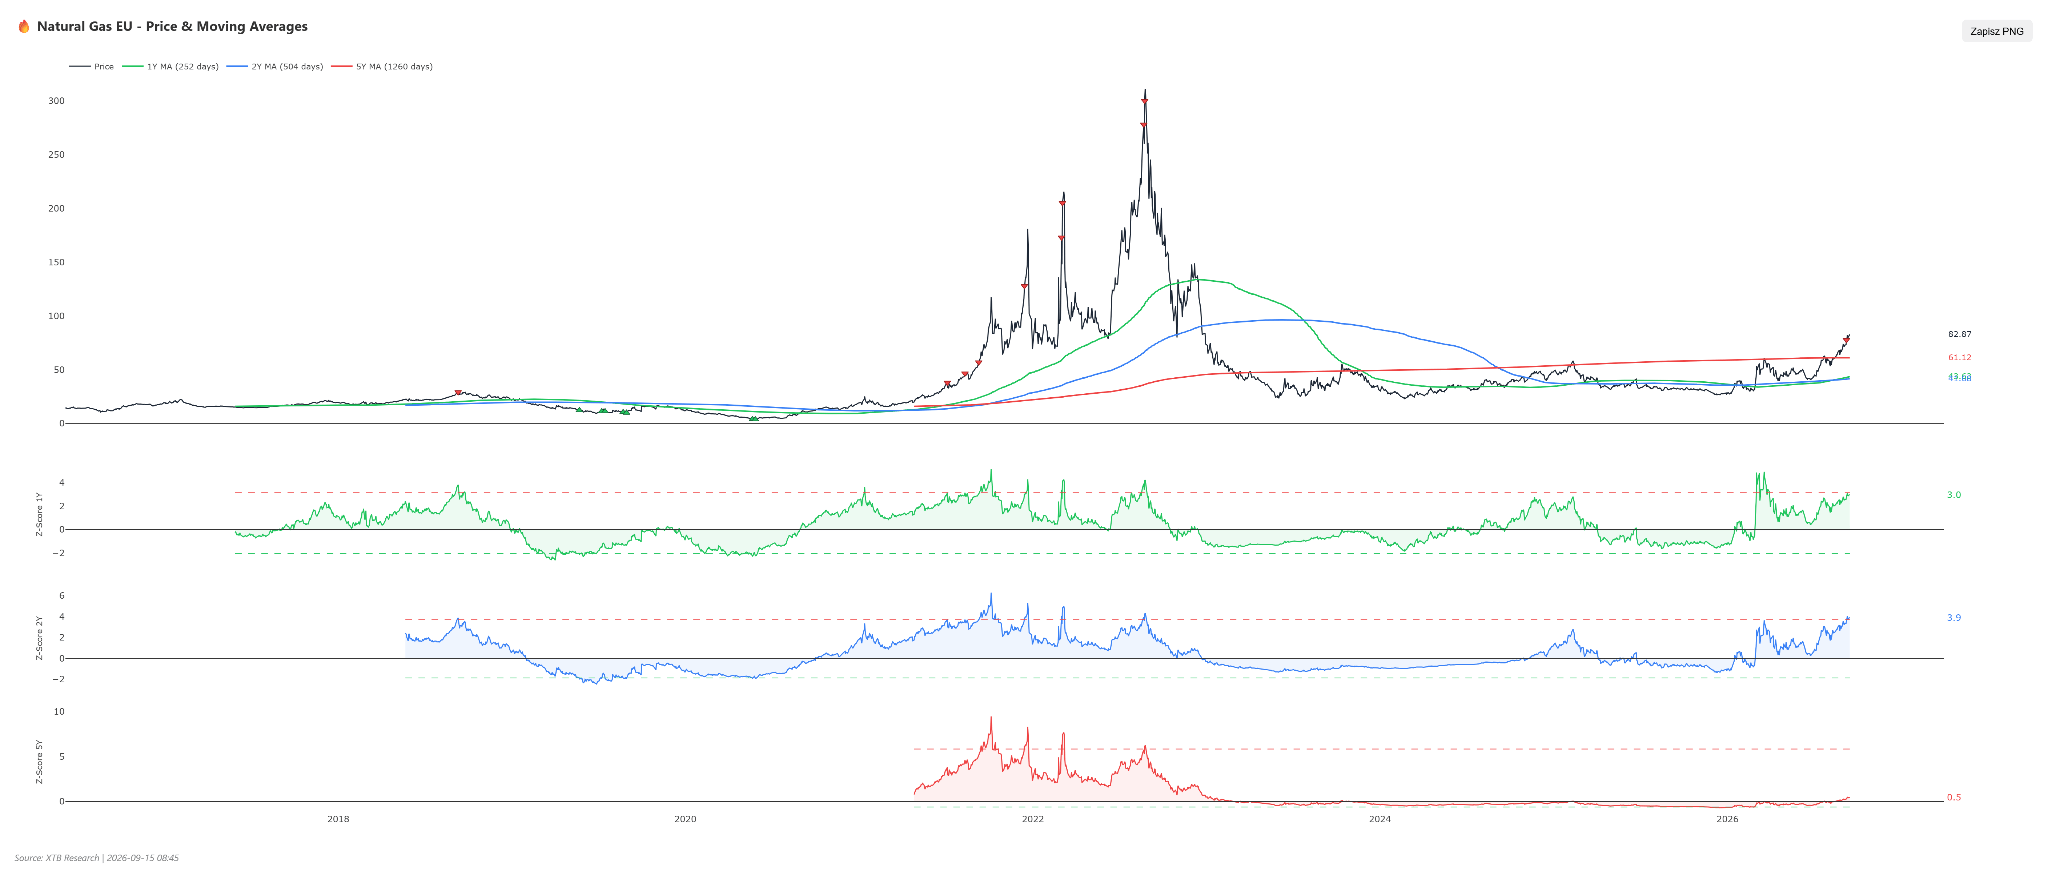
Recently, an overbought signal appeared relative to the 1-year and 2-year moving averages. In the past, such signals offered good prospects over a one-month period. Source: XTB
Scenarios
- Bullish Scenario: Further escalation of Middle East tensions and disruptions in maritime LNG transit, combined with China’s aggressive return to spot purchases and cold weather forecasts ahead of winter, will drive upward waves in both markets. Breaking resistance at 85.00 EUR/MWh on NATGAS.EU will open the path toward 90.00–98.50 EUR/MWh, while a sustained return of American NATGAS above 3.00 USD will unlock room to test the 3.15–3.30 USD levels.
- Bearish Scenario: De-escalation of conflicts, stabilization of LNG transport routes, and higher-than-expected inventory levels during a mild autumn will cool market sentiment. In the European market, profit-taking from extremely high RSI levels will pull NATGAS.EU quotes down toward the SMA50 average (63.50–58.00 EUR/MWh region). In the US market, falling industrial demand and a break of support at 2.75 USD will direct NATGAS valuation toward year-to-date lows at 2.60–2.45 USD.
Coffee
- As of September 15, 2026, coffee prices stand at 289.05, representing a daily gain of nearly 2%, marking an attempt to recover from recent declines.
- From a broader perspective, however, the commodity displays weakness, losing 0.30% weekly and as much as 7.73% on a monthly basis.
- The long-term downtrend is confirmed by negative returns of -18.61% year-to-date (YTD) and -29.23% compared to the same period last year.
- The RSI indicator has dropped to an extremely oversold level of 12, technically foreshadowing an impending turning point, even though the MACD maintains a bearish signal and the price resides 9.48% below its 50-day moving average, despite long-term moving averages remaining structurally bullish (SMA: bullish).
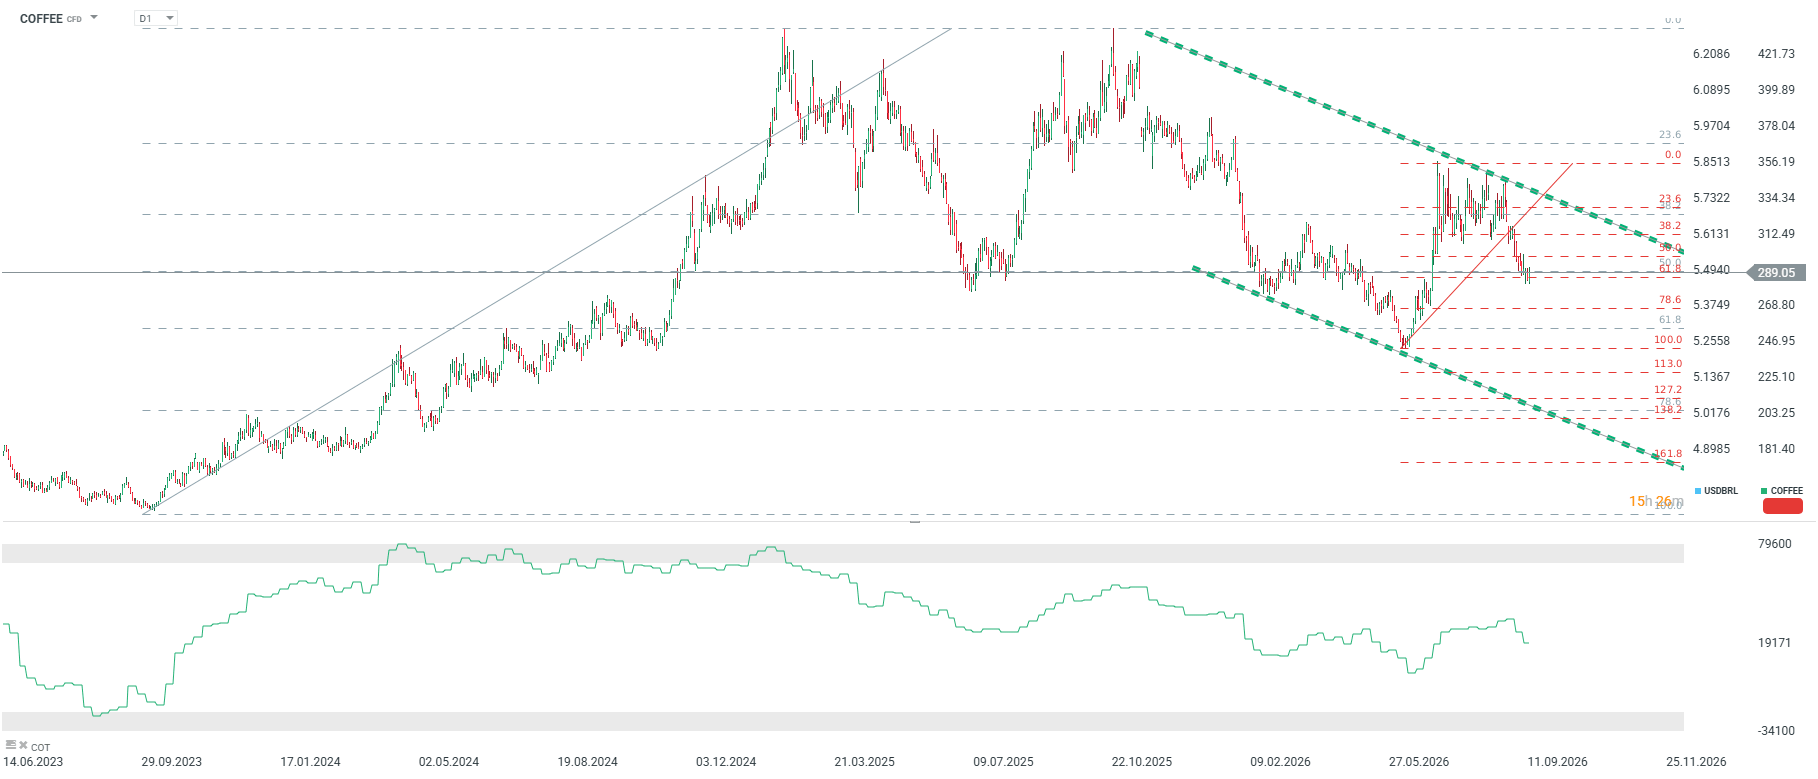
Coffee prices have experienced a clear pullback in recent weeks, but have halted slightly below 290 cents per pound, where support stems from local lows from late July and early August 2025. Additionally, we have the 50% retracement of the major 2023-2025 bullish wave and the 61.8% retracement of the short-term bullish wave from late June and early July of the current year. Source: xStation5
Fundamental and Market Context
- Coffee quotes at 289.05 demonstrate strong daily upward dynamics of 1.79%, significantly outpacing the average daily change for the broader commodity market, which currently stands at 0.42%.
- Weaker-than-projected August retail sales data in China and a deepening decline in construction investments there spark serious concerns regarding coffee demand in this key, rapidly developing Asian market.
- The coffee market contends with strong medium-term supply pressure, highlighted by a 7.73% price drop over the past month, forcing producers to re-evaluate their margins.
- The price decline is linked to the normalization of conditions following the earthquake in Colombia, which had caused a temporary halt in exports.
- A deep annual price discount in coffee reaching 29.23% reflects structural market shifts and growing investor fears regarding global demand stability amid an economic slowdown.
- Current financial investor positioning and market sentiment for coffee are classified as neutral, which, near current price lows, could favor stabilization and local bottom formation.
- Significant price distance below the 50-day moving average (-9.48%) points to severe technical overextension of the downtrend, historically increasing the probability of a sharp, corrective upward bounce.
- An extremely low RSI reading of 12 suggests selling pressure has reached near-total exhaustion, leaving the market highly vulnerable to sudden short-covering by hedge funds.
- Macroeconomic turmoil in Asia, including necessary bond market stabilization measures in South Korea, constrains speculative liquidity and prompts investors to reduce coffee market exposure.
- An economic slowdown in major consuming countries impacts the premium coffee segment, forcing global roasters into conservative inventory management and withholding spot purchases.
- Despite negative signals from the medium-term trend and a bearish MACD indication, long-term moving averages (SMA) maintain a bullish status, indicating that coffee’s multi-year uptrend is not yet definitively broken.
- The main driver dragging coffee prices down is expectations of record harvests in Brazil, Vietnam (despite El Niño), Ethiopia, and Uganda, which are projected to push global coffee production to nearly 190 million bags against a demand of around 180 million bags, which is also expected to be record-breaking.
- However, it is worth noting that forecasts from the USDA and regional institutions like CONAB differ significantly. In previous years, discrepancies in expected Brazilian production reached up to 10 million bags. The USDA estimates production in Brazil above 70 million bags.
- A key moment will be October, when the Robusta harvest begins in Southeast Asian countries, providing insight into production prospects during the El Niño period, which typically brings drought to this region.
- Conversely, Brazil is experiencing abundant rainfall, which usually improves production prospects, though initial indications from the current season showed slightly poorer bean quality, high harvest volumes, and logistical hurdles.
- Notably, Arabica coffee stocks on the ICE exchange have fallen to their lowest level in nearly three years, providing strong support for valuations. Conversely, Robusta valuation is weighed down by rising inventories (highest in 5 months) and a massive YoY export increase of over 20% from Vietnam.
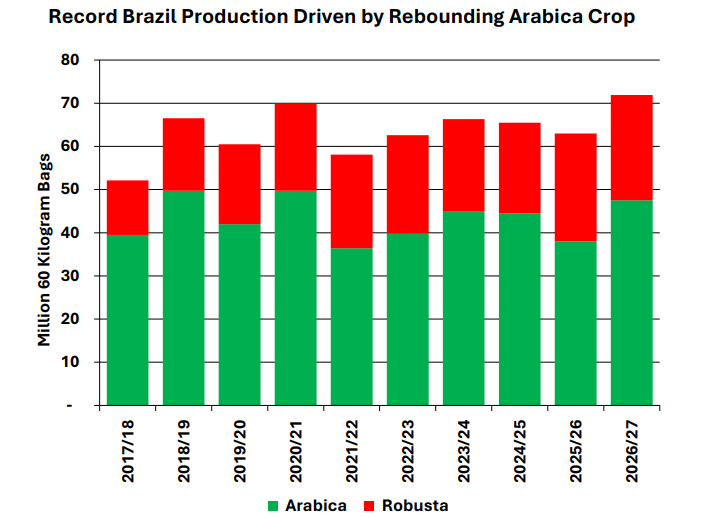
Production in Brazil is expected to reach above 70 million bags due to a significant rebound in Arabica production. Source: USDA
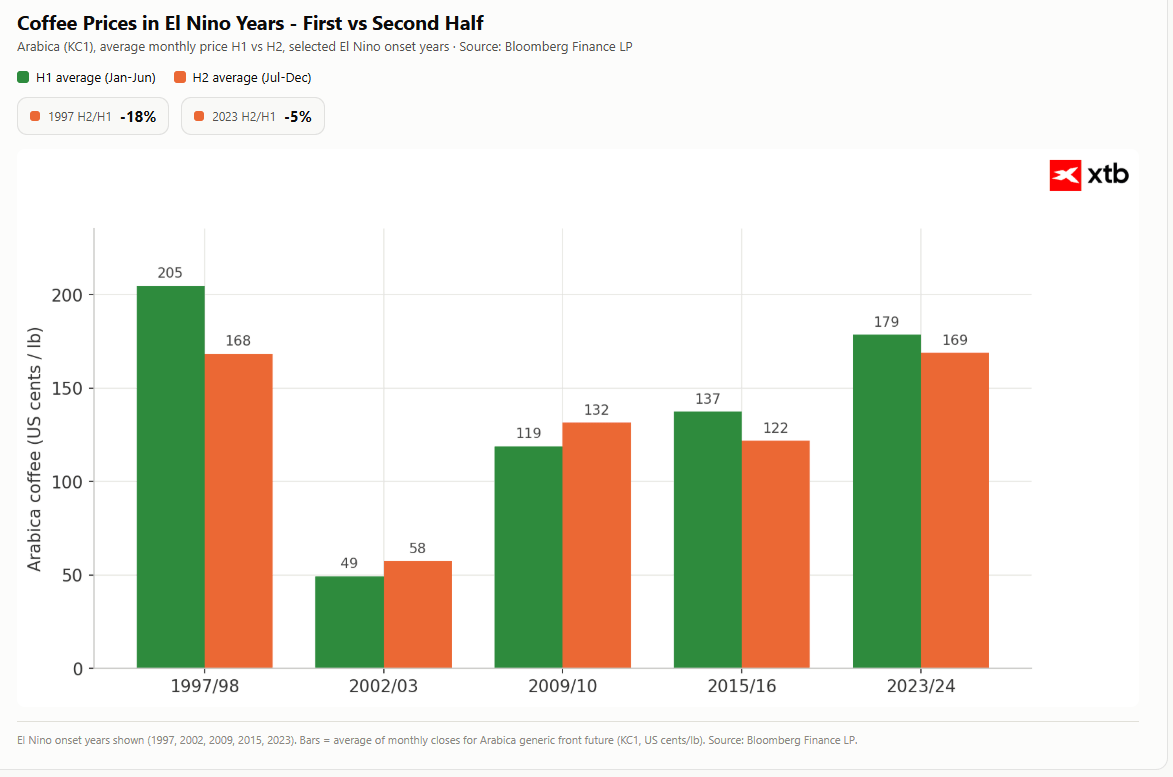
Coffee prices typically fell in the second half of the year when El Niño began. The most significant recent events were 1997 and 2015. Source: Bloomberg Finance LP, USDA, XTB
Historical Valuation (Z-score)
- Historical coffee valuation measured by Z-score metrics shows negative deviations over short- and medium-term horizons, where both the one-year Z1Y and two-year Z2Y current scores stand at -0.84.
- In a 5-year perspective, the Z5Y indicator assumes a positive value at +0.52. Analyzing the dynamics of this long-term indicator over the last six months reveals clear fluctuations in investor sentiment.
- Six months ago, the 5-year Z-score stood at +0.76, after which it dropped significantly in subsequent months, reaching a near-neutral level of +0.02 three months ago.
- Subsequently, this metric rebounded sharply to +1.20 a month ago, before sliding again over the last thirty days to its current reading of +0.52.
- Such volatility suggests that despite the recent strong sell-off, coffee remains relatively highly valued in a broader 5-year perspective compared to its historical mean.
- The current Z-score level signals moderate investment risk, where room for further drastic price declines is gradually diminishing, yet the market has not reached extreme undervaluation levels over a multi-year horizon, warranting caution when building long-term positions.
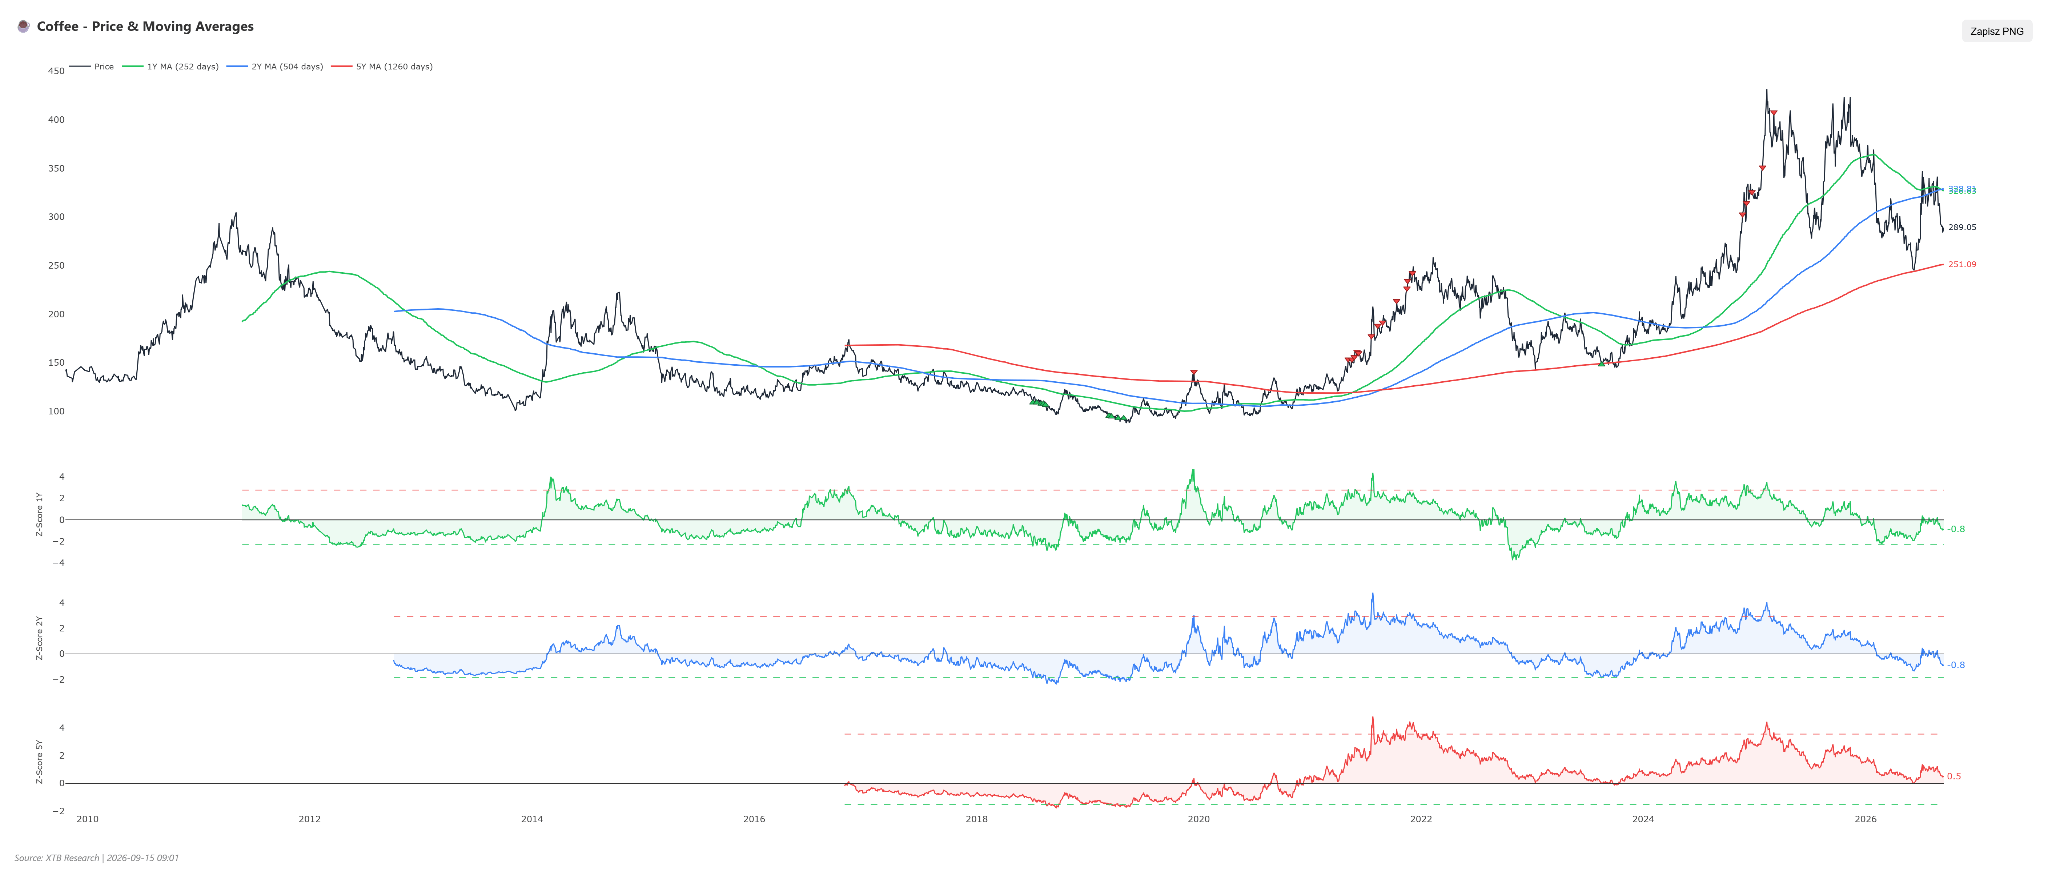
It is worth noting that coffee is trading below its 1-year and 2-year averages, but these do not yet represent extreme oversold conditions. Nevertheless, the 5-year moving average has served as support for coffee since September 2025, currently residing above the 250 cents per pound level. Source: XTB
Scenarios
- Bullish Scenario: For a sustained reversal of the negative trend, the coffee market must respond to extreme technical oversold conditions signaled by the RSI indicator at 12, initiating a wave of short-covering by institutional investors. A fundamental catalyst would be a weakening US dollar triggered by declining US Treasury yields and improved consumer sentiment in Asia, particularly China. From a technical analysis perspective, breaking through the 50-day moving average barrier will open the door to a more durable recovery. Under this setup, coffee prices should bounce dynamically, aiming first at resistance at 315.00, and with a stronger demand impulse, toward 335.00.
- Bearish Scenario: Continuation of the downtrend will occur if weak macroeconomic data from China translates into a real drop in bean imports, and persistently high US interest rates continue to support the dollar, placing pressure on soft commodities. Technically, a lack of demand response to extremely low RSI readings and further negative signals generated by MACD will confirm total bear dominance. In this scenario, upon breaking psychological support at 280.00, coffee prices will enter another sell-off phase. The target level for sellers will then become the 265.00 area, with potential deepening down to long-term support at 250.00.
Oil
- The global crude oil market is experiencing a strong, dynamic upward surge, driving quotes for both major benchmarks above the 100 USD per barrel threshold for the first time since July 2026.
- As of September 15, 2026, WTI crude stands at over 103 USD (+22.41% m/m, +79.79% YTD), while Brent crude is valued at 107 USD (+17.65% m/m, +76.39% YTD).
- Both benchmarks trade significantly above their 50-day moving averages (WTI by +21.16%, Brent by +19.13%).
- Technical indicators from MACD and SMA unequivocally favor the demand side; however, RSI readings (85 for WTI, 84 for Brent) signal extreme overheating and heavy overbought conditions for both assets.
- Key resistance lies at 103.40 USD (WTI) and 110.00 USD (Brent), with primary support levels located at 99.00 USD and 103.00–100.00 USD, respectively.
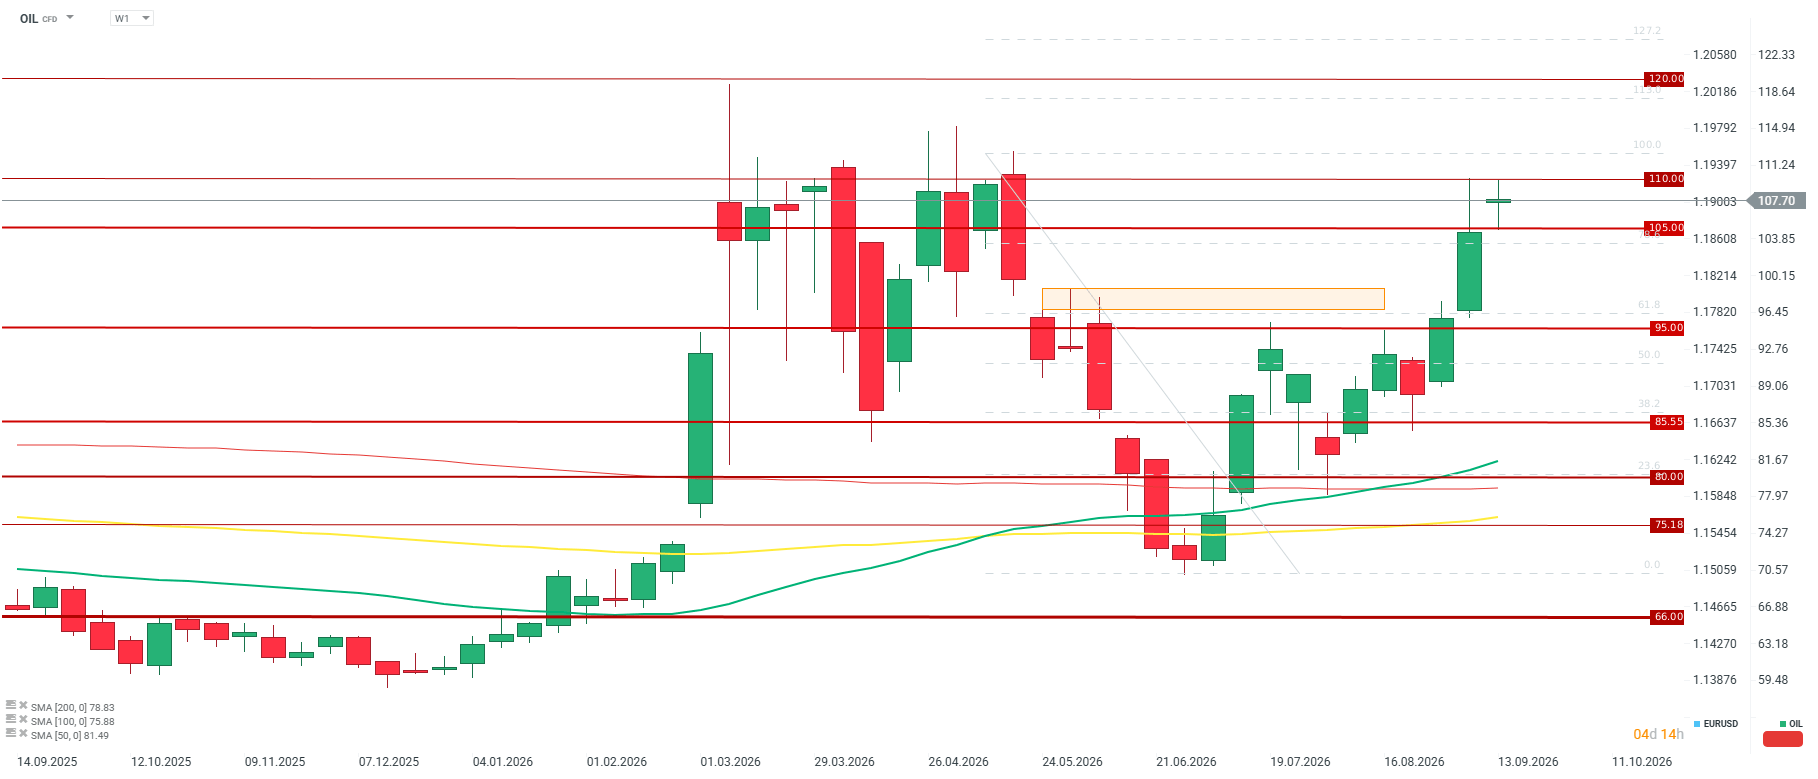
From a weekly perspective, oil clearly struggles to break above the 105–110 USD per barrel zone, while a strong supply zone sits above 112 USD. Source: xStation5
Fundamental and Market Context
- Escalating geopolitical conflict in the Middle East, including attacks on Saudi oil infrastructure and tanker incidents in the Persian Gulf, drastically elevates risk premiums as well as freight and marine insurance costs.
- The threat of navigation paralysis through the Strait of Hormuz has sparked global supply constraint fears, driving a rapid surge in valuations and speculation regarding potential further price spikes.
- Speculation regarding pumping station repairs on Saudi Arabia’s East-West pipeline suggests work could extend to 5-6 weeks. Conversely, reports indicate partial operability could be restored within a few days.
- The Houthis taking control of the Yemeni coastline near the Bab el-Mandeb Strait raises fears over vessel departures from Yanbu port heading toward Asia. However, data does not show a drastic shift in the actual situation yet.
- Chinese refineries, facing depleted capacity to draw from strategic reserves, have aggressively returned to spot market purchasing, paying record premiums for cargoes from Russia, Africa, and the Americas.
- A rebound in Chinese petroleum product exports alongside solid industrial production figures encourages domestic refiners to maintain high crude throughput despite weaker retail consumption data.
Historical Valuation (Z-score)
- Historical Z-score analysis for both oil grades reveals very similar, extreme levels of deviation from long-term moving averages.
- For WTI crude, the one-year Z1Y stands at +1.61, Z2Y reaches +2.41, and the 5-year Z5Y surged over the past month from +0.23 to +1.82.
- For Brent crude, these values stand at: Z1Y at +1.64, Z2Y at +2.44, and Z5Y at +1.86 (up from +0.48 a month ago).
- This metric evolution clearly demonstrates that the oil market transitioned from equilibrium to deep statistical overvaluation in a very short span.
- Elevated Z-score readings combined with overbought momentum indicators highlight significant risk of a severe corrective pullback should geopolitical risk factors ease.
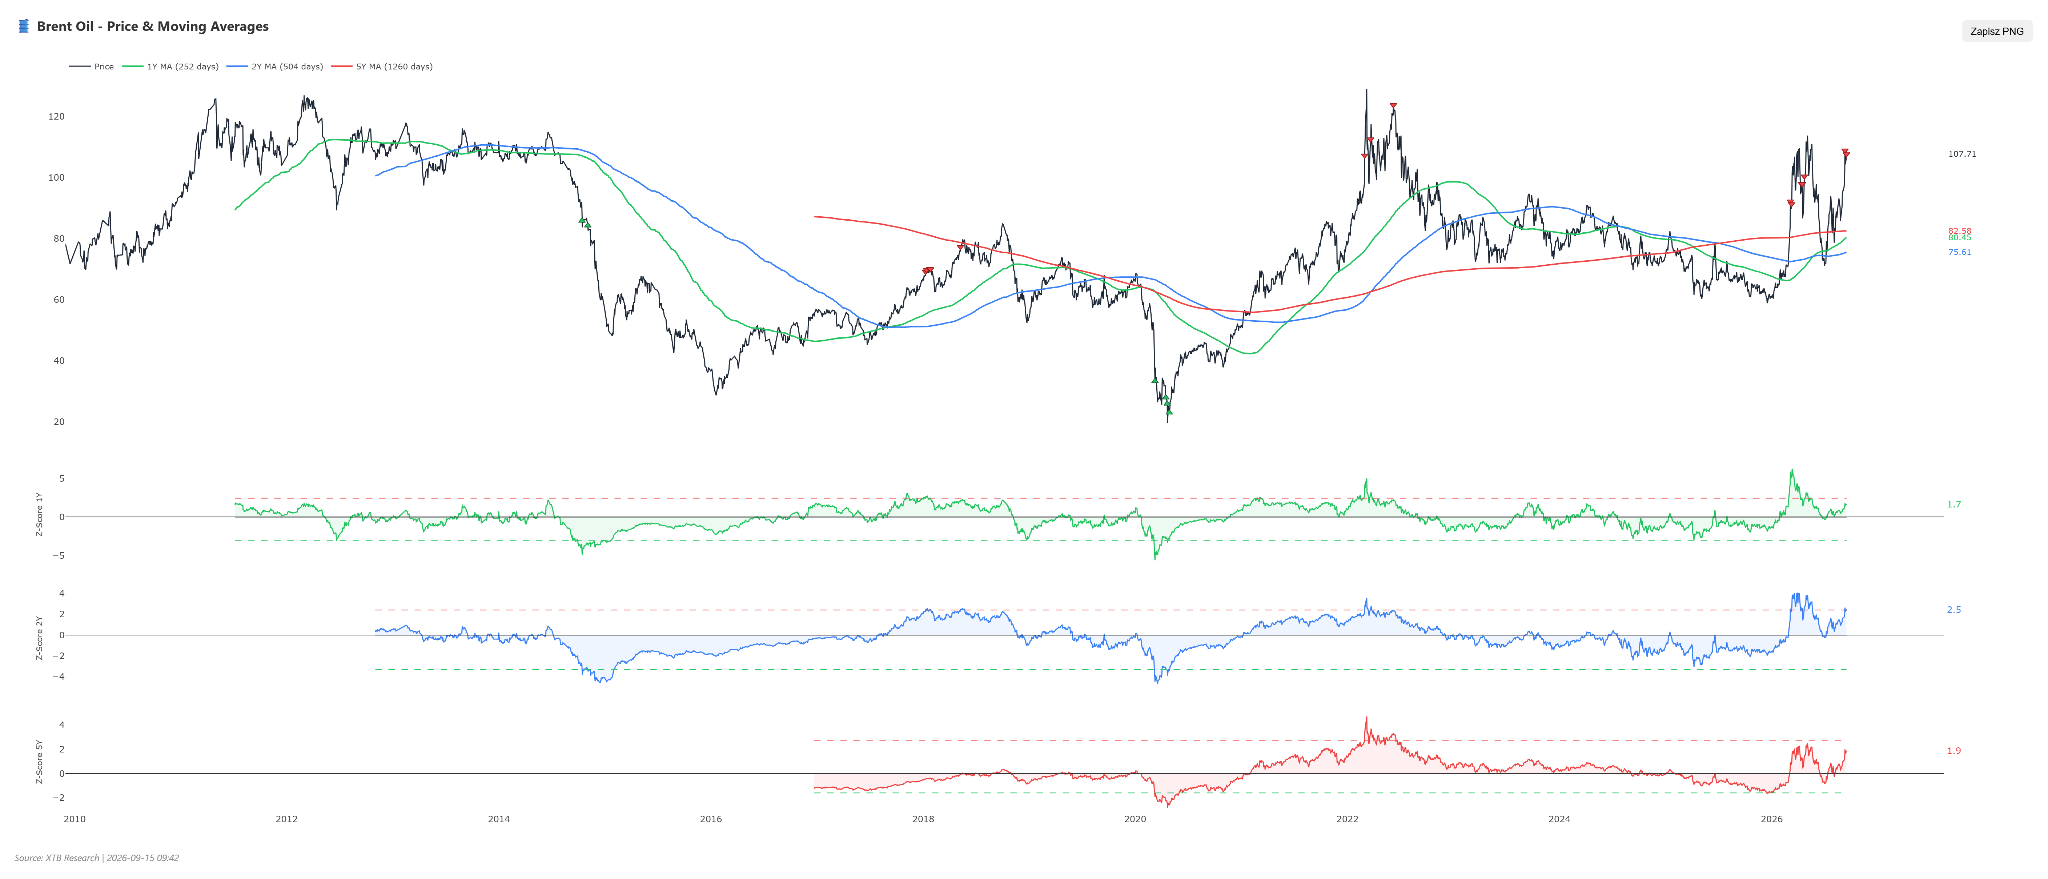
An overbought signal appears on Brent crude relative to its two-year average, whereas no clear overvaluation is observed relative to the 1-year and 5-year averages. Source: XTB
Scenarios
- Bullish Scenario: Further military escalation in the Middle East, additional attacks on production infrastructure, and a prolonged blockade of the Strait of Hormuz will cause supply deficits. The need to rebuild inventories by Asian refiners will further boost spot market rates. A sustained breakout above resistance at 103.40 USD (WTI) and 110.00 USD (Brent) will open the path toward further upside target ranges of 108.00–112.00 USD per barrel for WTI and 115.00–125.00 USD per barrel for Brent.
- Bearish Scenario: Diplomatic de-escalation of the conflict and restoration of safe maritime navigation will lead to an immediate deflation of the geopolitical premium. Given extremely high RSI readings (84–85), rapid profit-taking, long liquidation, and a price slide will ensue. Breaking support at 99.00 USD on WTI and 103.00 USD on Brent will bring quotes down toward 95.00–92.00 USD for WTI and 100.00–95.00 USD for Brent, respectively.
Gold
- Gold price as of September 15, 2026, stands at USD 4,276, representing a noticeable pullback of 2.39% weekly and 2.73% monthly.
- Year-to-date (YTD), the precious metal is down a symbolic 0.82%, though on an annual basis it maintains a solid gain of 16.42%.
- The RSI indicator has dropped to a borderline level of 30, signaling strong market oversold conditions, while moving averages (SMA) and the MACD generator render explicitly bearish signals.
- Despite this, current valuation resides slightly above the 50-day moving average, and overall market sentiment remains neutral, pointing to key support around USD 4,250–4,270 and resistance at USD 4,350.
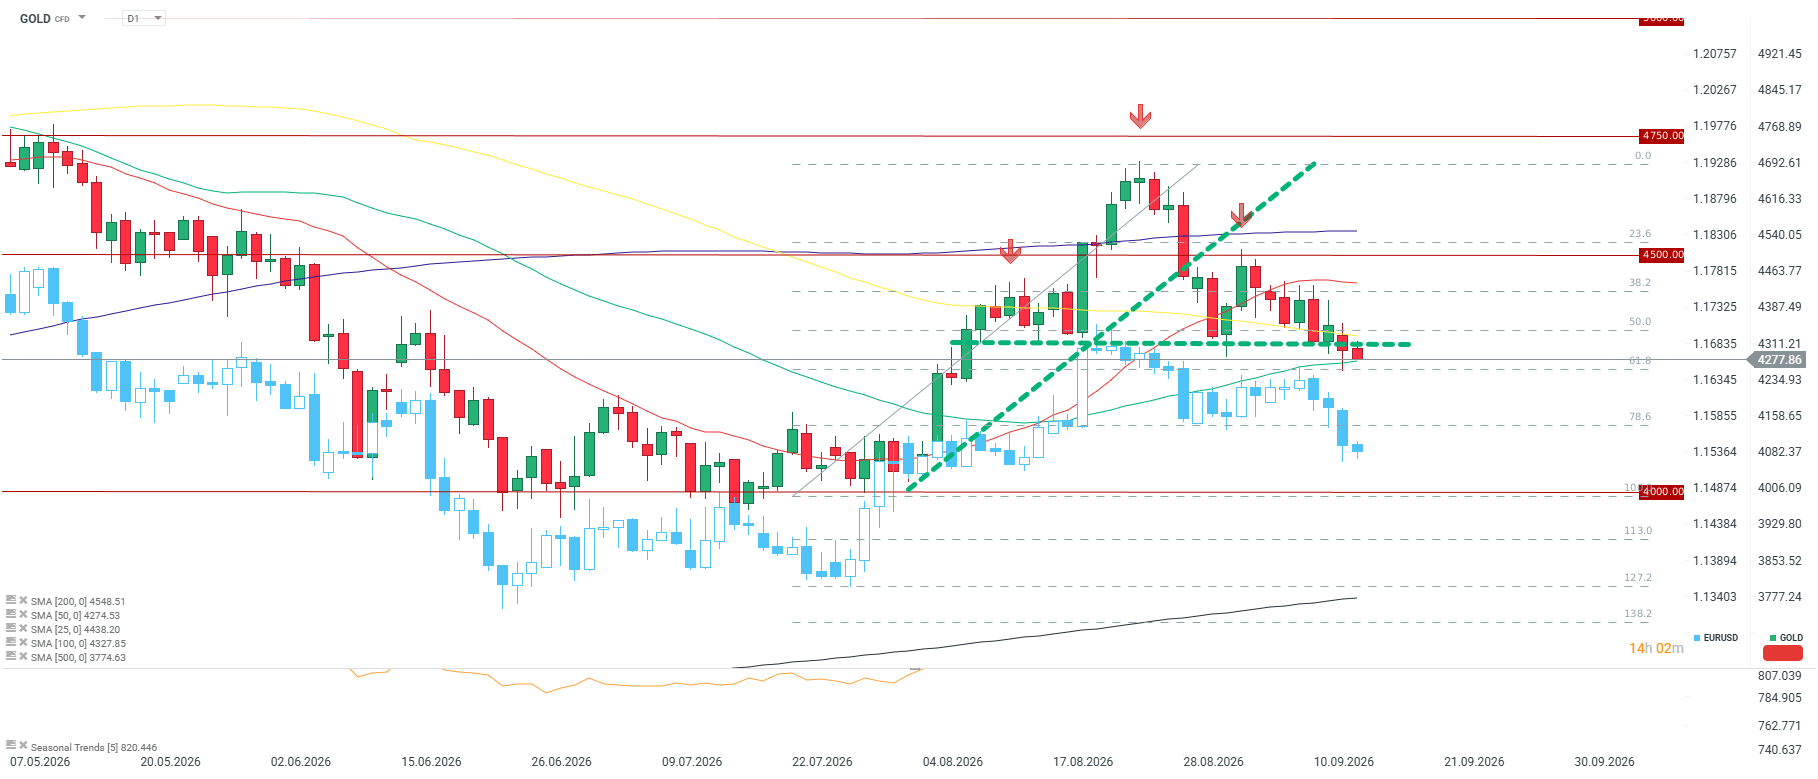
Gold potentially breaks below the neckline of a Head and Shoulders (H&S) pattern, but simultaneously remains above support linked to the SMA-50 and the 61.8% Fibonacci retracement of the latest upward impulse. Source: xStation5
Fundamental and Market Context
- Gold prices in the key Indian market stabilized in mid-September, exhibiting minimal volatility and remaining nearly unchanged, reflecting a temporary balancing of physical supply and demand.
- Yields on 10-year US Treasuries crossed the 5% threshold, exerting strong downward pressure on gold valuation by raising the opportunity cost of holding non-yielding assets.
- South Korea’s Ministry of Economy and Finance declared readiness to take immediate steps to stabilize the domestic bond market if necessary, indicating growing stress across global debt markets that could translate into volatile capital flows into safe-haven assets.
- Escalating Middle Eastern geopolitical turmoil, including renewed attacks on critical infrastructure and commercial vessels in the Persian Gulf region, maintains an elevated risk premium that historically offers strong support for bullion prices.
- Concerns regarding East Asian debt market stability and the need for tight yield monitoring by local policymakers force institutional investors into cautious positioning, limiting aggressive gold sell-offs.
- Growing pressure on Beijing to deploy additional economic stimulus packages could boost gold demand over the medium term if announced reforms and liquidity support achieve their intended effect.
- Increased investor interest in multi-manager hedge funds in 2026 influences futures market positioning structures, with managers emphasizing hedging strategies against macroeconomic volatility using gold.
- Gold remains a key reserve asset, evidenced by continued central bank purchases in Q3 of this year, with central banks from Poland, China, and Uzbekistan extending their buying momentum.
- Recent actions by certain central banks, such as the Netherlands, to repatriate gold reserves from the US to Europe to enhance reserve liquidity are also worth noting.
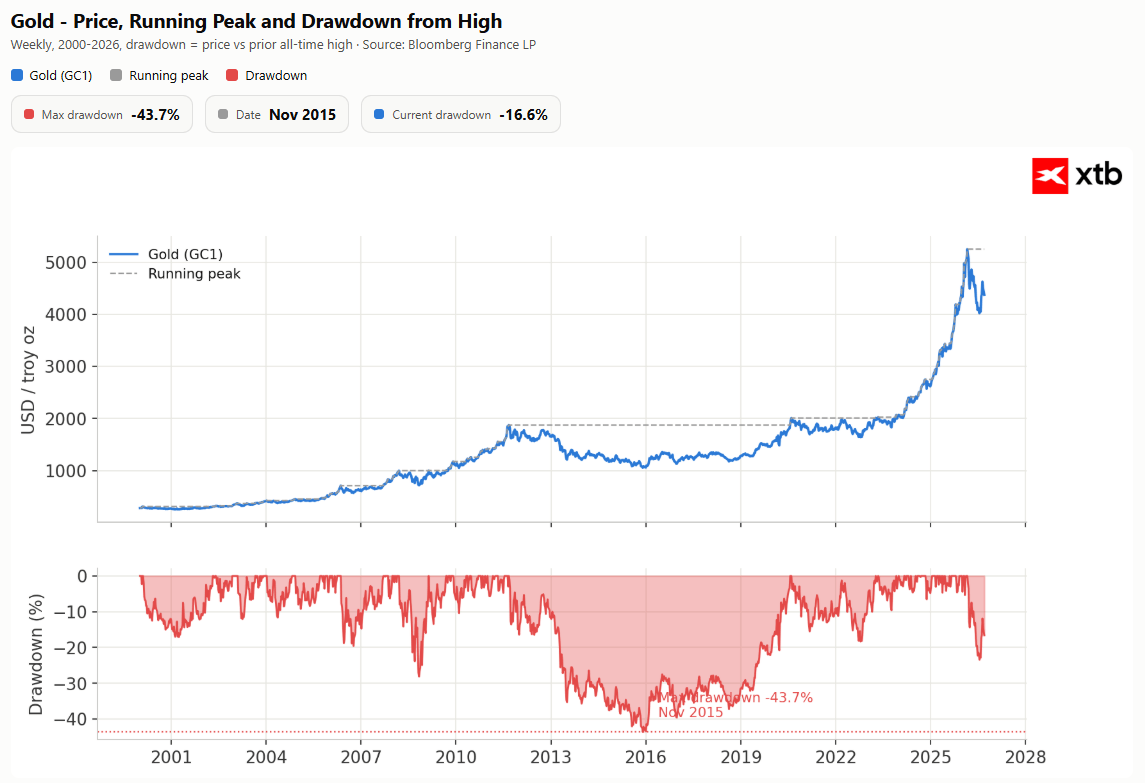
The current drawdown closely resembles the 2008 pattern, suggesting potential for a return to all-time highs within a 1-2 year horizon. Source: Bloomberg Finance LP, XTB
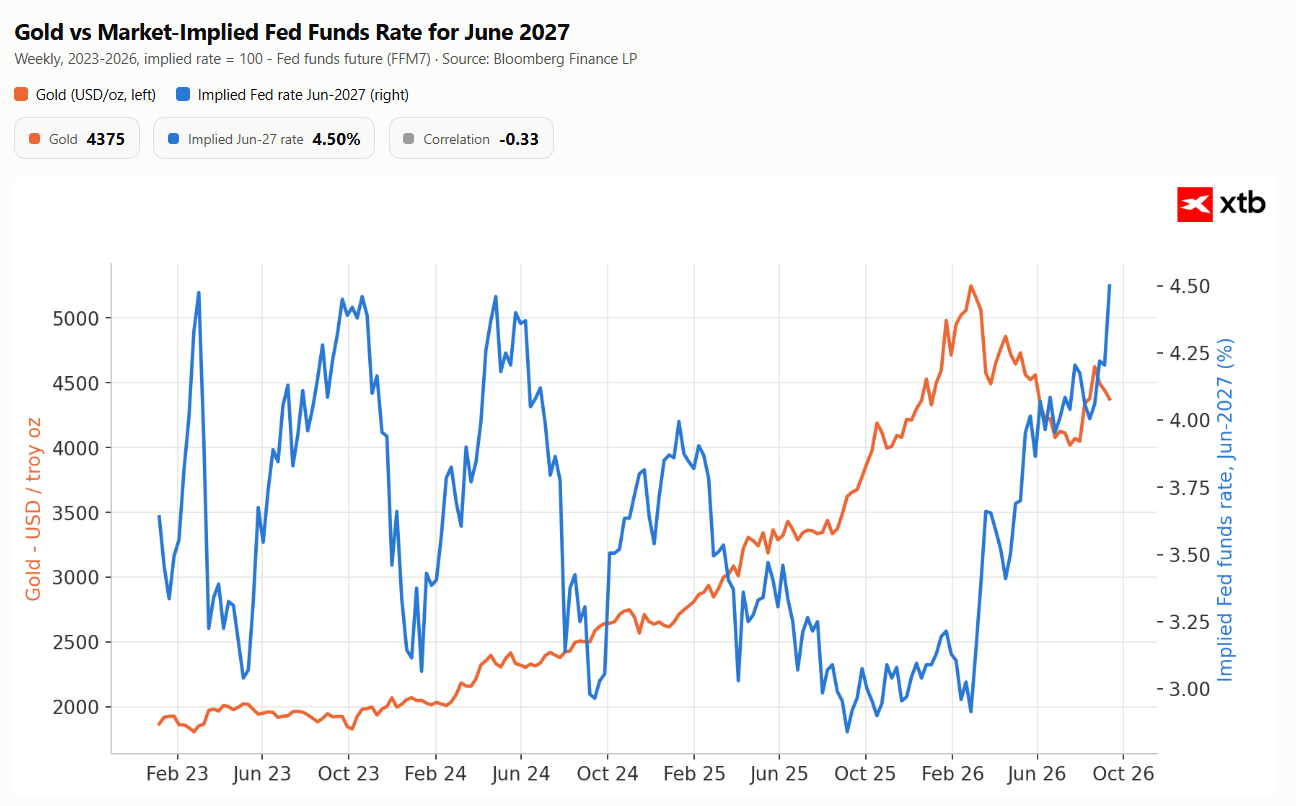
Market-implied Fed funds rate for June 2027 stands at 4.5%. Similar conditions in 2023 marked local peaks or consolidation phases. Source: Bloomberg Finance LP, XTB
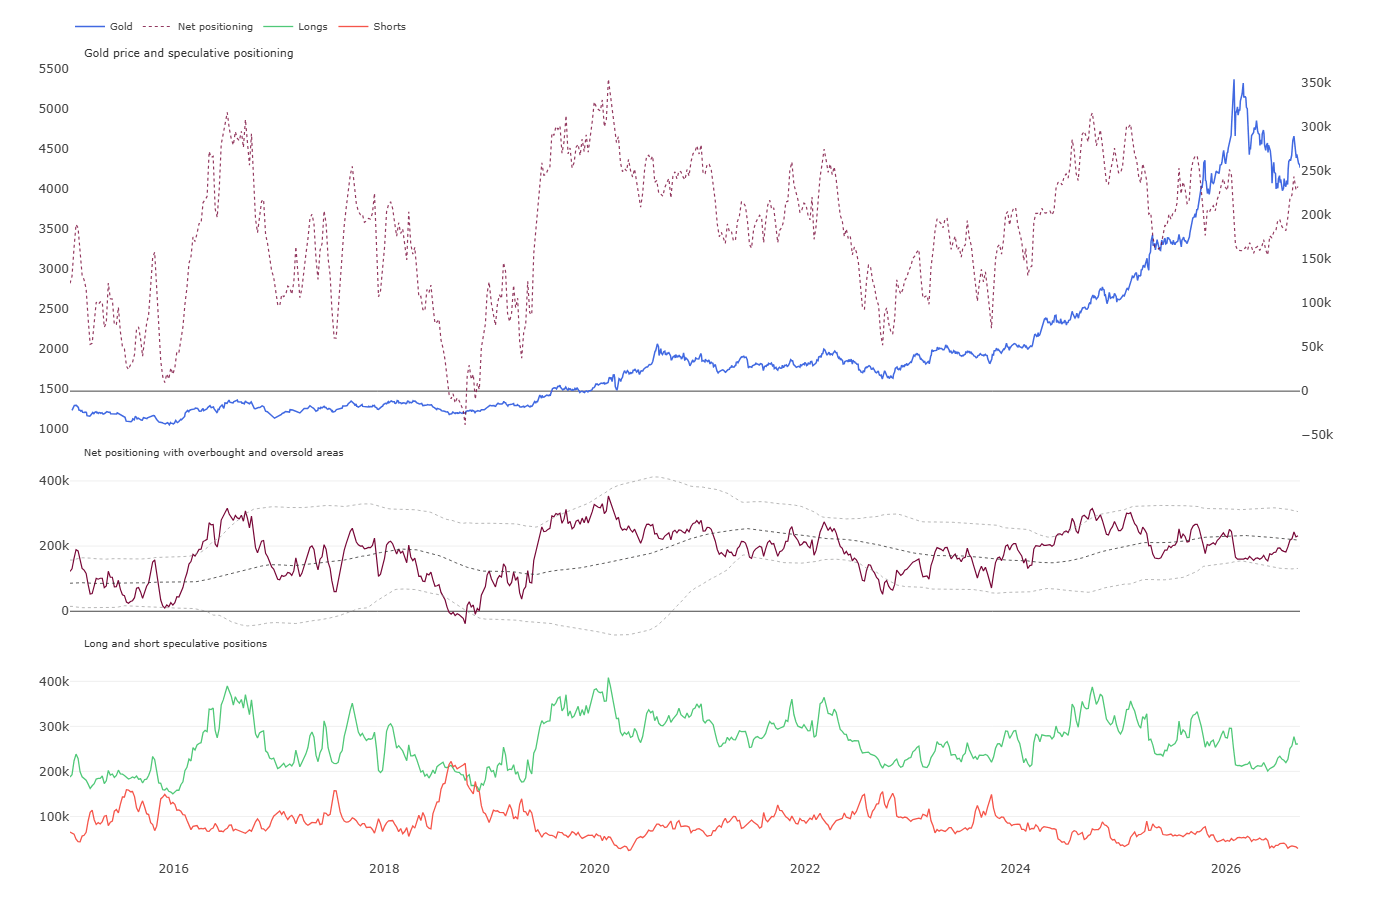
Long positions have recently increased alongside a reduction in short positions; however, net positioning sits barely above its 2-year average, leaving ample headroom for prospective buyers. Source: CFTC, XTB
Historical Valuation (Z-score)
- Z-score metric analysis points to varying degrees of gold valuation across different time horizons.
- The annual Z1Y indicator currently stands at -0.43, suggesting mild short-term undervaluation, while the two-year Z2Y metric sits at +0.69, and the five-year Z5Y reaches +1.57.
- Examining the trajectory of the five-year Z-score over the past six months reveals a distinct downward trend.
- Six months ago, this score stood as high as +3.05, before dropping to +1.80 three months ago and +1.73 last month, reaching its current level of +1.57.
- This systematic compression of the five-year Z-score indicates a gradual unwinding of historical gold overvaluation and a return toward balanced levels.
- From a risk assessment standpoint, this dynamic reduces the likelihood of a sharp, disorderly price correction, rendering current levels more appealing to long-term investors, though still requiring prudence given the metric’s position above historical means.
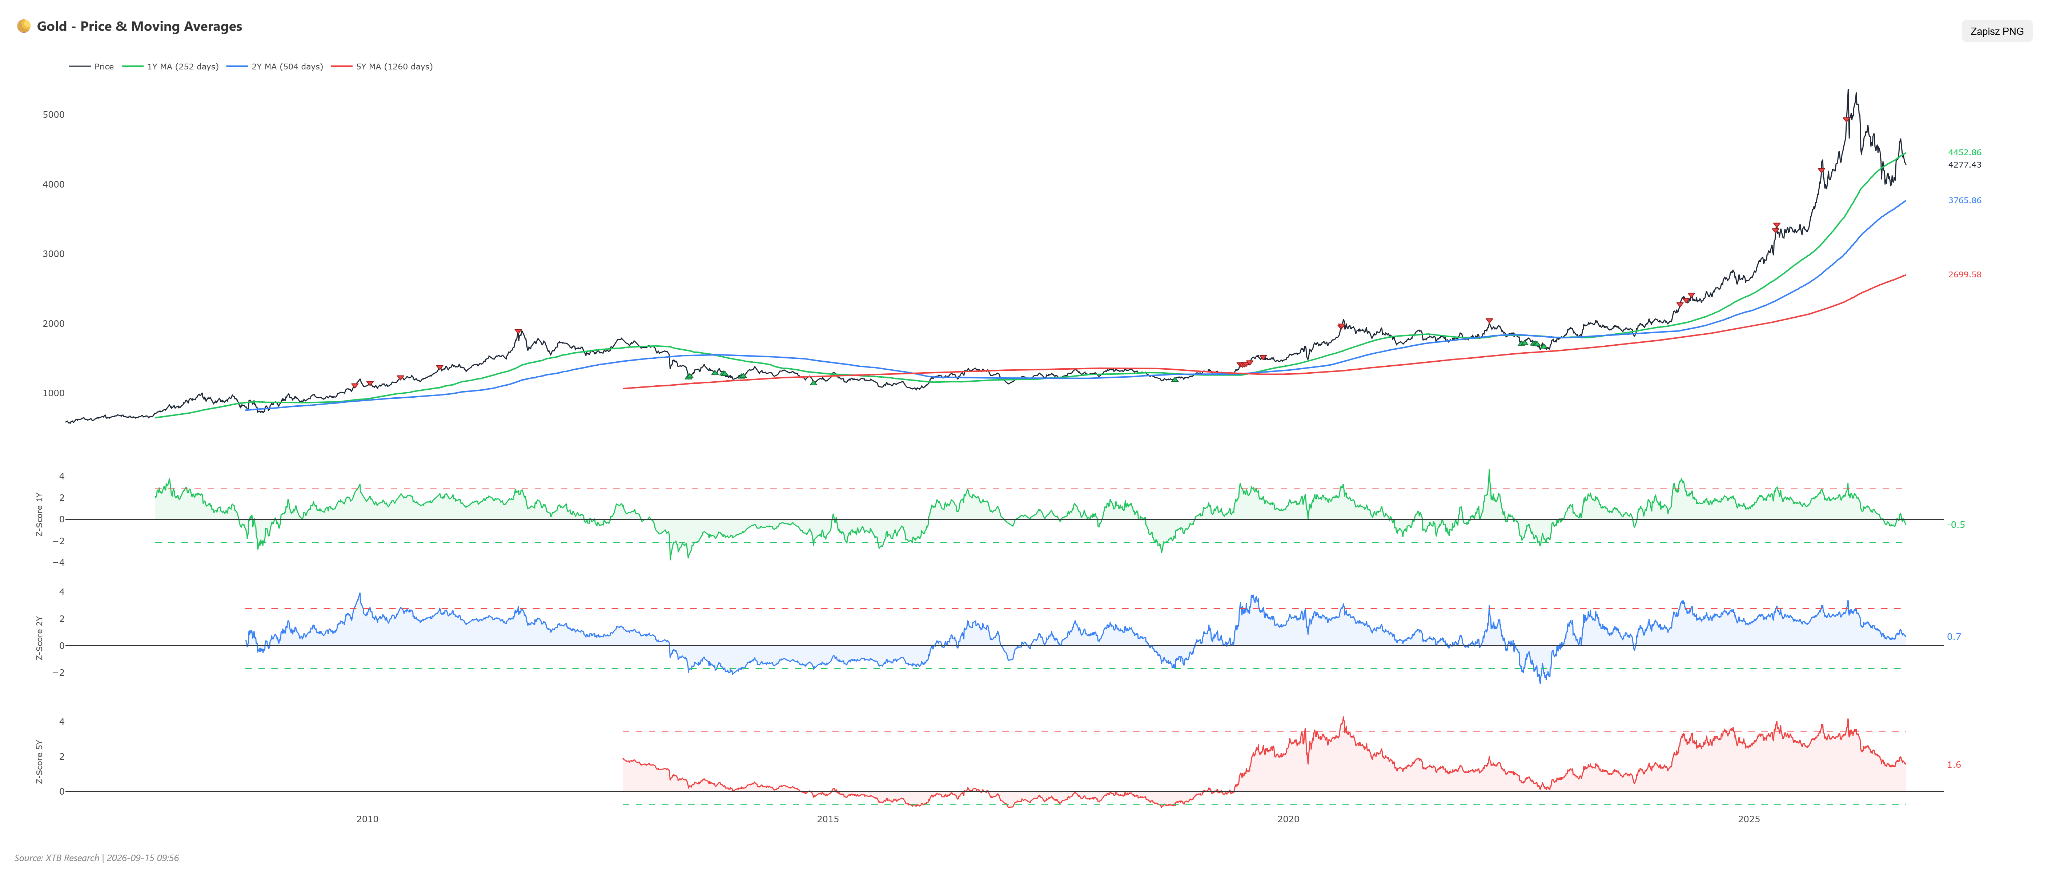
Gold currently displays no overvaluation signals, yet fails to indicate relatively low valuation versus recent historical levels. Source: XTB
Scenarios
- Bullish Scenario: A necessary prerequisite to reverse the current pullback is a decline in US Treasury yields below the five percent threshold and a renewed escalation of Middle East geopolitical stress, driving capital back into safe havens. From a technical view, strong oversold conditions signaled by the RSI at 30 must trigger a decisive demand response around support near USD 4,270. An added impulse would stem from aggressive stimulus measures announced by Beijing to revive domestic retail demand. Under these conditions, gold prices should breach resistance at USD 4,350 and head toward USD 4,500 per ounce.
- Bearish Scenario: Persistent 10-year US Treasury yields above five percent, coupled with a deepening economic slowdown in China and weak retail sales data, could permanently tilt the scale toward sellers. If Asian bond markets destabilize further and global investors favor cash over precious metals, a firm breakdown below the 50-day moving average will occur. Bearish signals from SMA and MACD indicators would strengthen, which, in the absence of support defense, will deepen the sell-off and push gold prices down first to USD 4,200, and in an extreme case, to test the psychological USD 4,050 per ounce barrier.