




Shift in narrative
Just a few days ago, the market was heavily fearing a return of crude oil prices to new all-time records during the ongoing war. However, now investors are starting to play out a completely different scenario: the collapse of the Iran blockade. Although oil prices are rebounding significantly during the last Monday of September, today’s picture in the oil market appears to be extremely interesting, yet at the same time difficult to predict. There is still no agreement announced in recent days, Iran is not softening the conditions for opening Hormuz, and Trump has completely rejected Iran’s proposal. Despite this situation, an increasingly strong narrative supported by data is emerging that oil exports from the Middle East are returning to a greater extent. It can be said that although the market did not get a diplomatic breakthrough, it found a workaround on its own. This is a situation that can be called a cold war in the oil market: the conflict continues, which will largely sustain the geopolitical premium, the risk does not disappear, but trade goes on. It is simply longer, more expensive, and definitely more dangerous. Before moving further, an important caveat about the data. Most of the figures on flows, tanker shuttles, and STS transfers come from private data, but more and more analyses confirm the growing numbers. Although the exact scale of the export recovery is hard to assess, the direction seems clear, which is also being priced in by the market further out. The question arises, however: is it also time for a sharp drop at the short end of the oil curve?
What actually changed? The return of exports
The most important fact of the rapidly ending month. Total Middle East crude exports, which plunged to around 40% of January levels in March, were expected to rebound in September to around 17 million b/d, which according to some calculations is nearly 90% of the baseline from the beginning of this year. This is a massive change compared to the spring collapse. Furthermore, a clear rotation of routes is visible, and it is at the heart of this story. When Persian Gulf exports ground to a halt in spring, the Red Sea took the burden (Saudi Arabia redirected cargoes). When the Houthis closed the southern exit through Bab al-Mandab in the summer, and strikes on the East-West pipeline cut off flow to the Red Sea in September, exports returned to the Persian Gulf, which is now recording very high figures. The world’s largest oil exporter could not afford to let crude stop flowing completely. It simply decided to take on greater risk and, with U.S. assistance, is releasing more and more barrels through the Strait of Hormuz. Now the question arises. If crude flow through the Strait of Hormuz has returned to very high levels, why isn’t oil falling? The answer, of course, is risk and high freight rates. Oil flows without an agreement, but at the same time the market must pay a higher price if it wants to get the coveted barrels.
New export mechanism: the Hormuz shuttle and breeding season in the Gulf of Oman
How does the new workaround look physically? Something analysts call the “Hormuz shuttle” has emerged. Tankers transport crude out of the Persian trap along the Omani coastline, staying close to the shore of Oman rather than taking the central route or hugging the Iranian coast, then offload the cargo via ship-to-ship (STS) transfers in the Gulf of Oman before returning for another batch. Hence the explosion in STS transfers, dubbed the ship “breeding season.” The volume of these operations grew from near zero during spring to over 8 million b/d in September. According to estimates, around 116 tankers are engaged in the Hormuz shuttle. ADNOC (the UAE state oil company) started as early as May (around 11 vessels), and later Saudi Aramco and Kuwait copied the model. Added to this is a military element: the US Navy coordinates tanker transits through the strait, designating routes and time windows, which allows concentrated air defense over the passage. All of this happens with transponders turned off, so only by using satellite data are companies like Kpler able to estimate how much crude actually exits the Strait of Hormuz. Oil is flowing, but the costs involved in getting it out to the open sea are significantly higher than standard.
Why oil remains high: the cost of the workaround and fading Iran
Currently, it seems that mainly three things are holding prices elevated despite the return of volumes. First, the shuttle cost is huge. Freight on the route from the Gulf to China (TD3c index) shot up to over $200 per ton, translating to up to nearly $30 per barrel. For a 2 million barrel VLCC cargo, that is roughly $58 million for a single voyage. This cost doesn’t disappear; it gets absorbed into the delivered oil price. In other words, even if barrels are plentiful, getting them to market is expensive, and that supports prices. Second, Iran itself is dropping out of the game, which is a supply-tightening factor rather than an easing one. Iran has practically not loaded crude since August at its main Kharg Island terminal, as exporting Iranian oil and returning for the next shipment carries the highest risk. Bessent claims that only about 15 million barrels of Iranian crude remain on the water, with the last deliveries to China completing within two weeks. Real volume is thus leaving the market, even if others are replacing it. Third, geopolitical risk remains active. Houthi drones and missiles are still flying toward Riyadh and Aramco installations (alerts in Abha and Jazan). As long as energy infrastructure remains a target, the risk premium will stay in the market.
Confirmation from the futures market
The futures market shows that the short-term situation remains tight. If the return of volumes were actually easing the physical market, we would see it in the futures curve; currently, we observe a stabilization of this state instead.
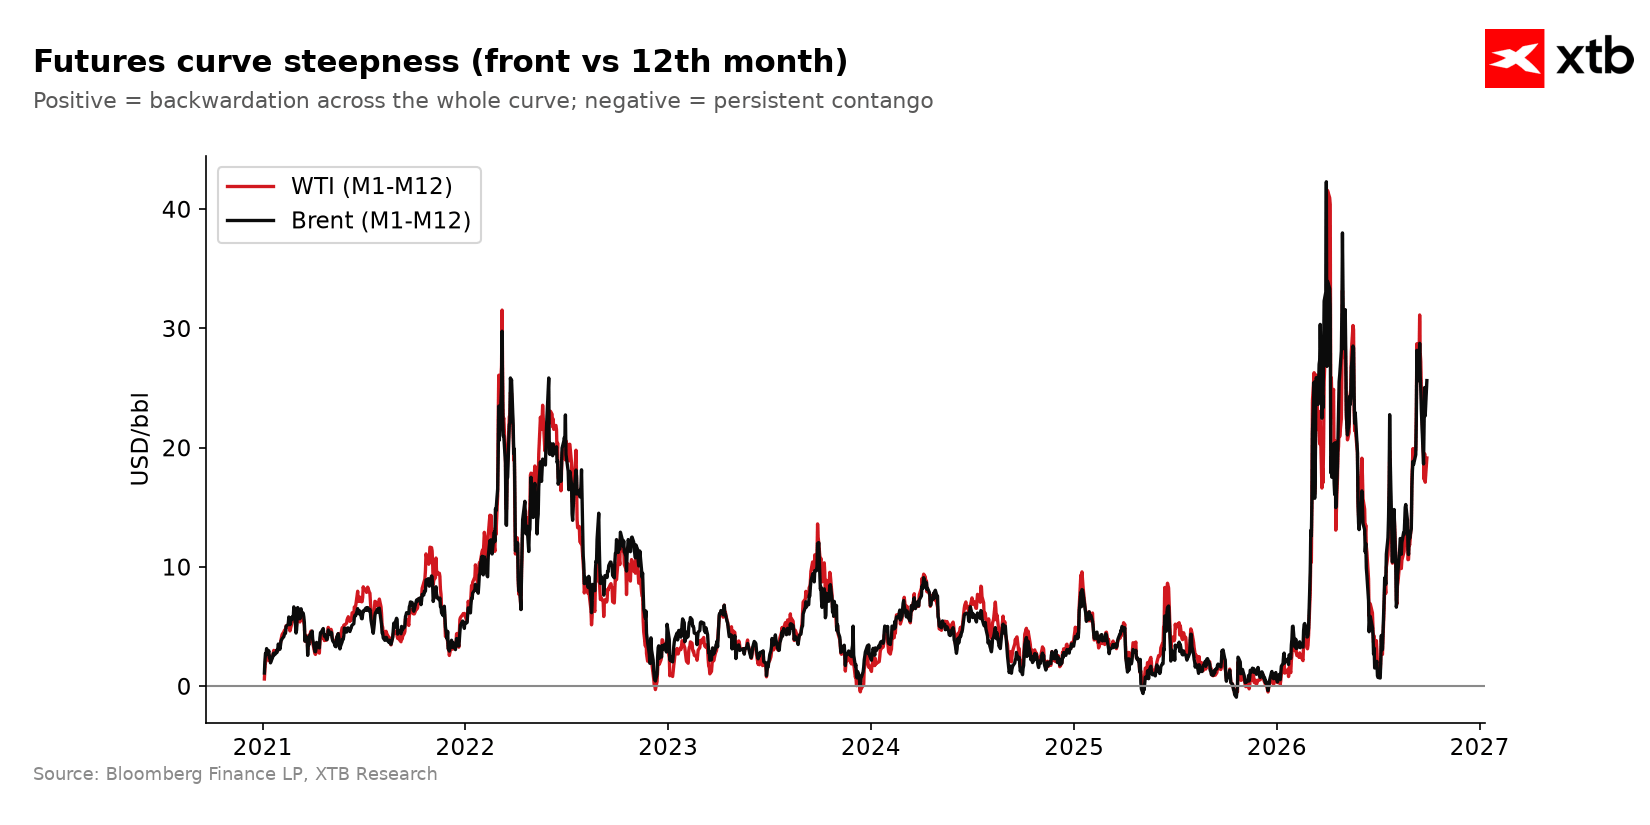
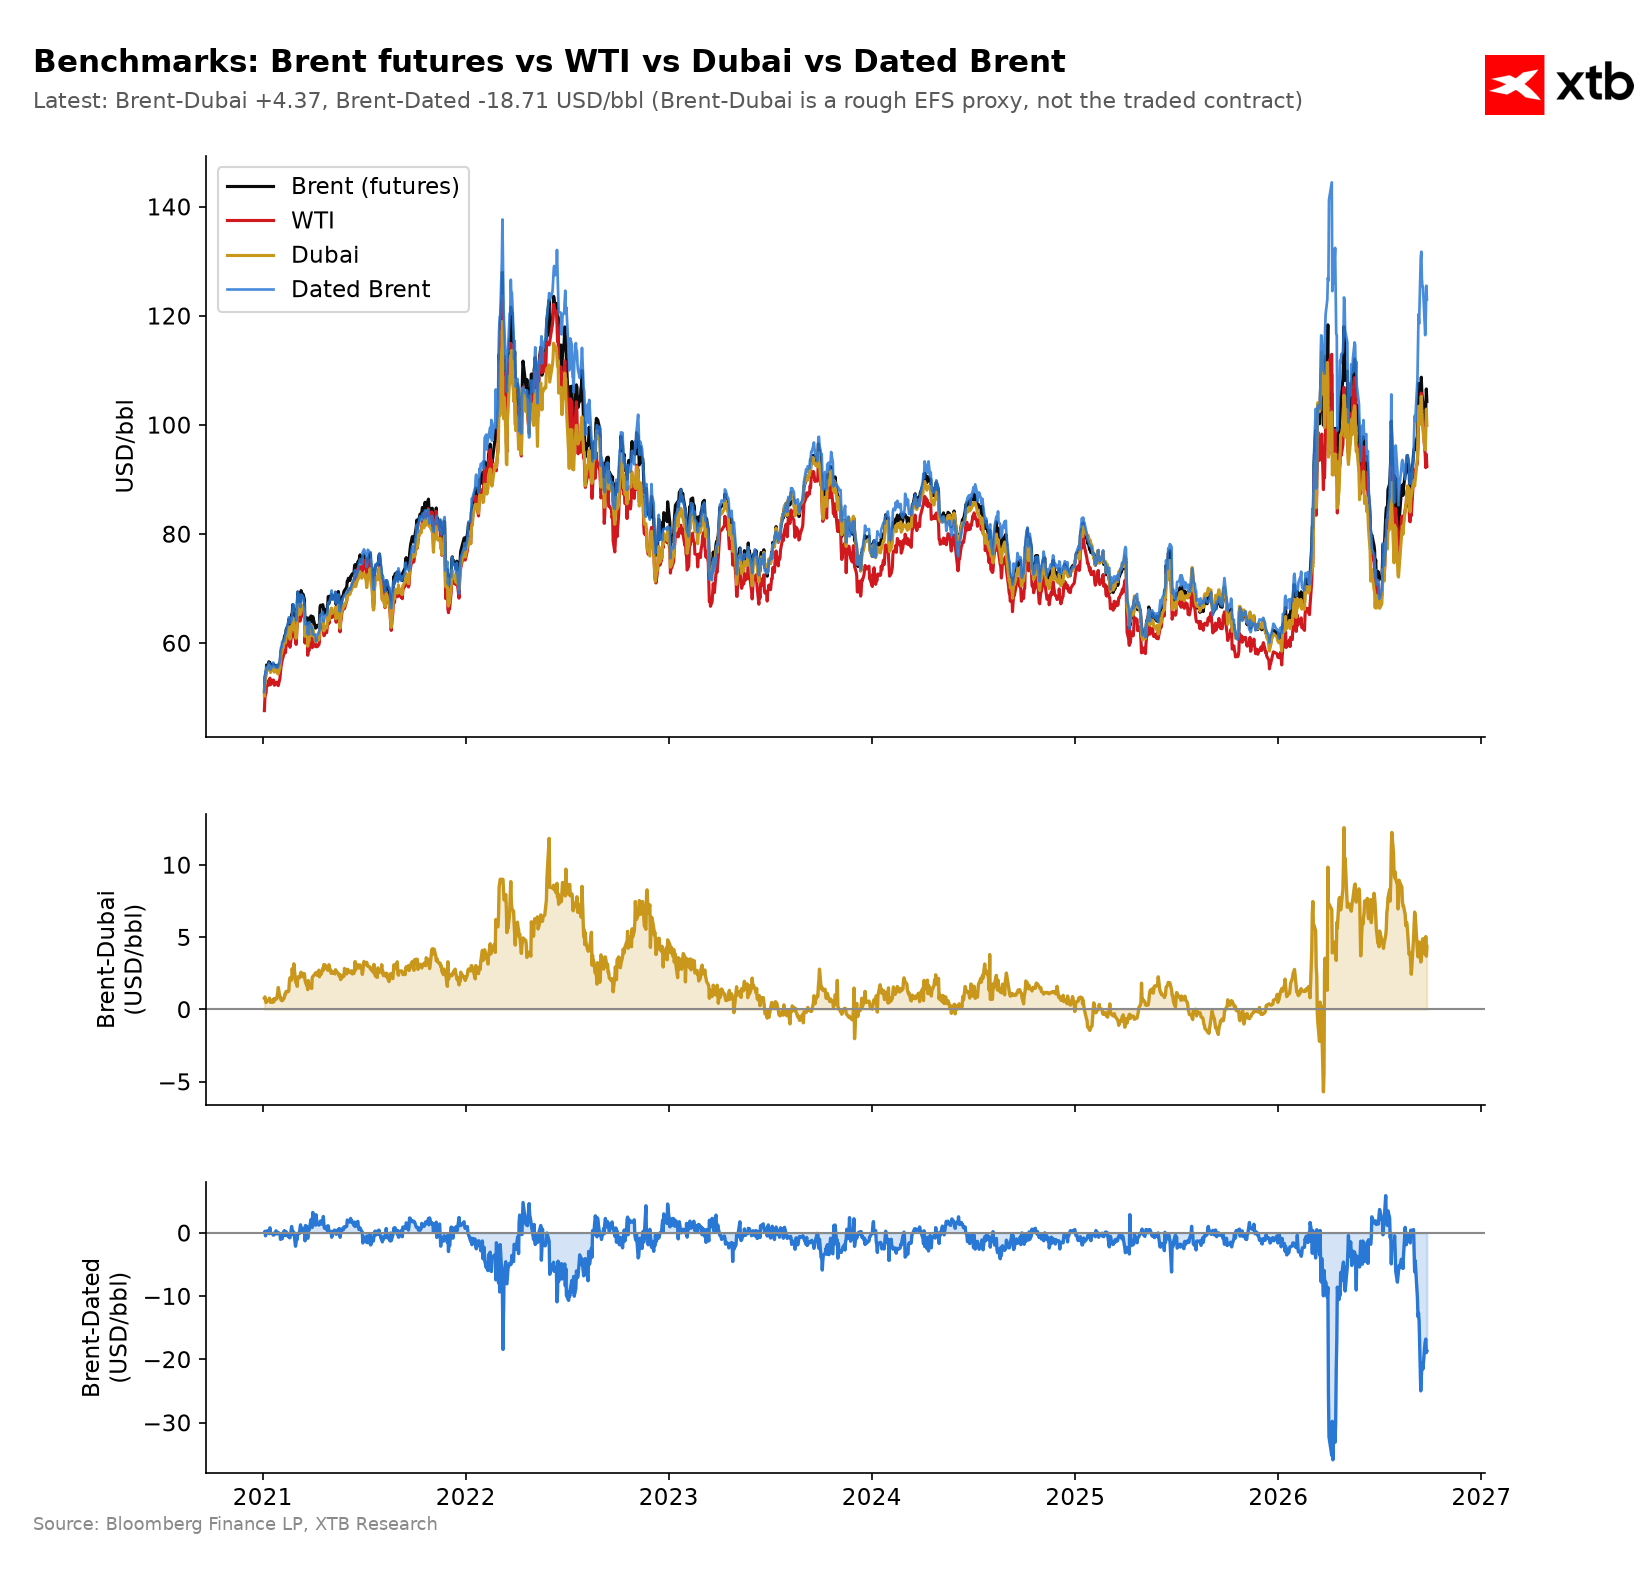
Backwardation on Brent crude—the premium of the front-month contract over the 12-month contract—is deep and has actually widened: normally this premium was only a few dollars, and a few weeks ago it stood at $10, which was already high. Currently, this premium for the expiring front contract has surged to as much as $27. The entire curve lifted upward, including the 12-month end. Meanwhile, physical crude (Dated Brent) is trading at a record premium of +$23 over paper front-month futures. Three independent signals indicate that the physical market remains tight.
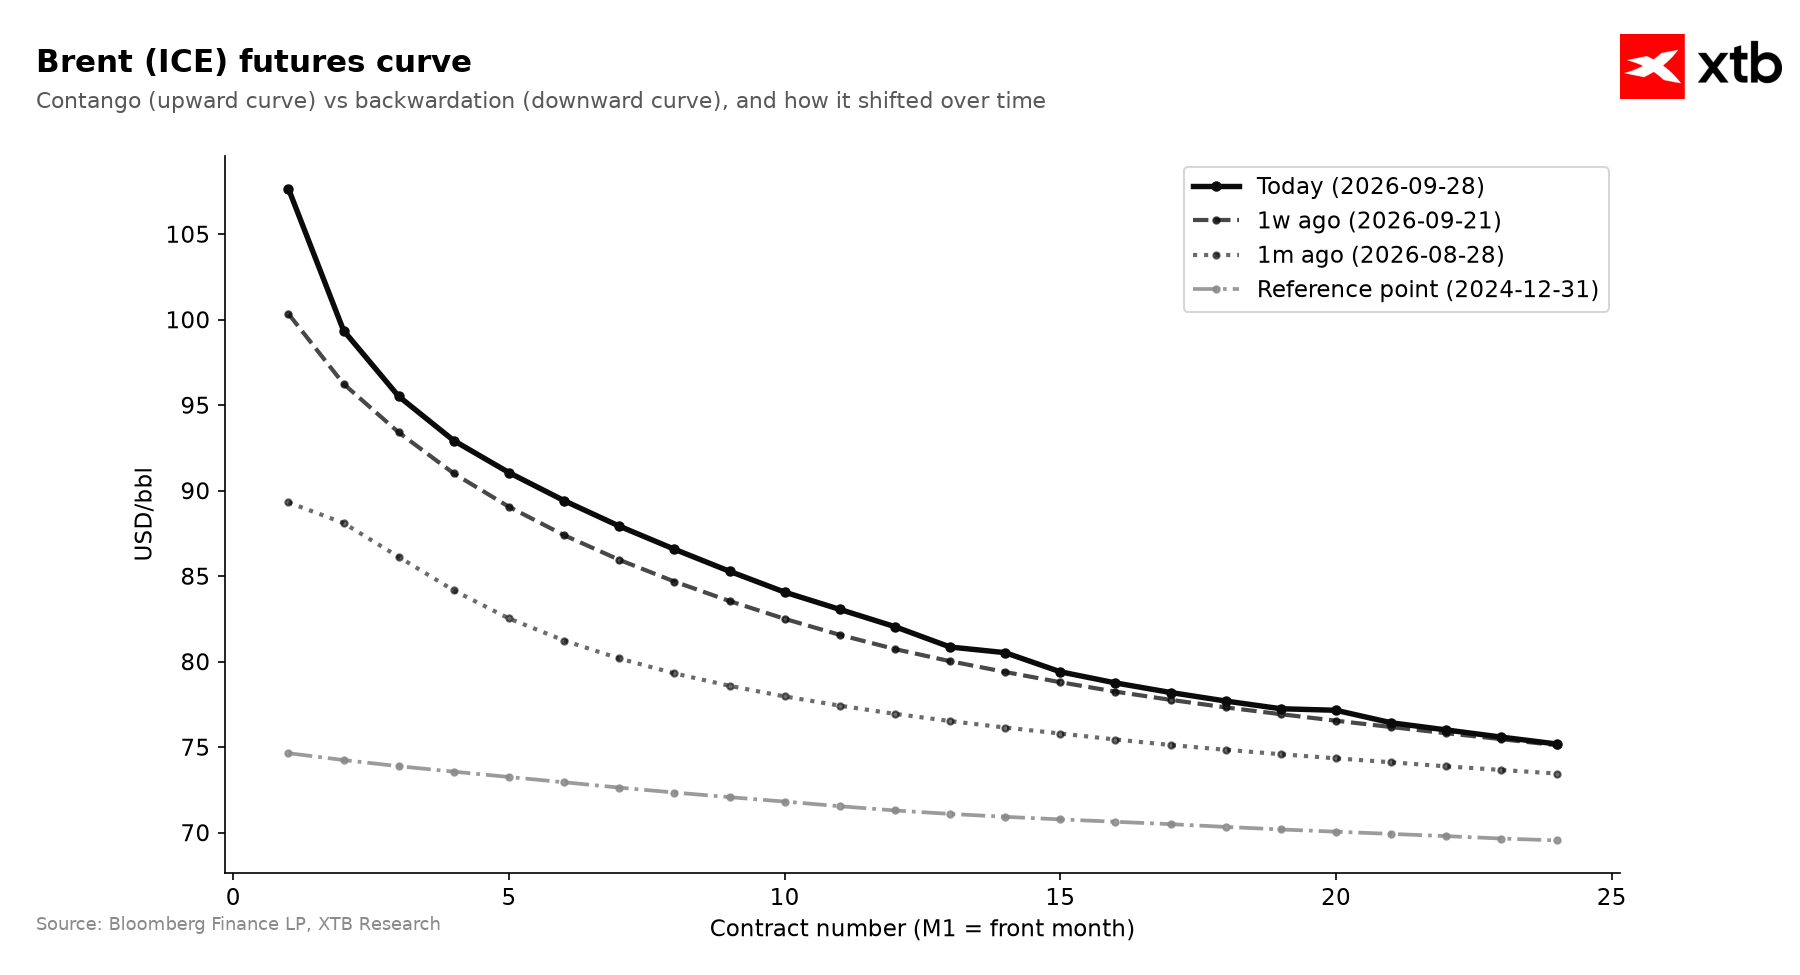
How does all this look alongside the strong recovery in oil exports? Volume is returning, but it comes more expensively, via longer routes, and excluding certain grades (Iranian), so the physical availability of the right barrel in the right place remains limited. Added to this is the restricted supply of refined fuels. The curve and flow data do not contradict each other; they tell two sides of the same story: plenty of barrels in transit, but expensive and fraught with issues.
Technical analysis of Brent crude
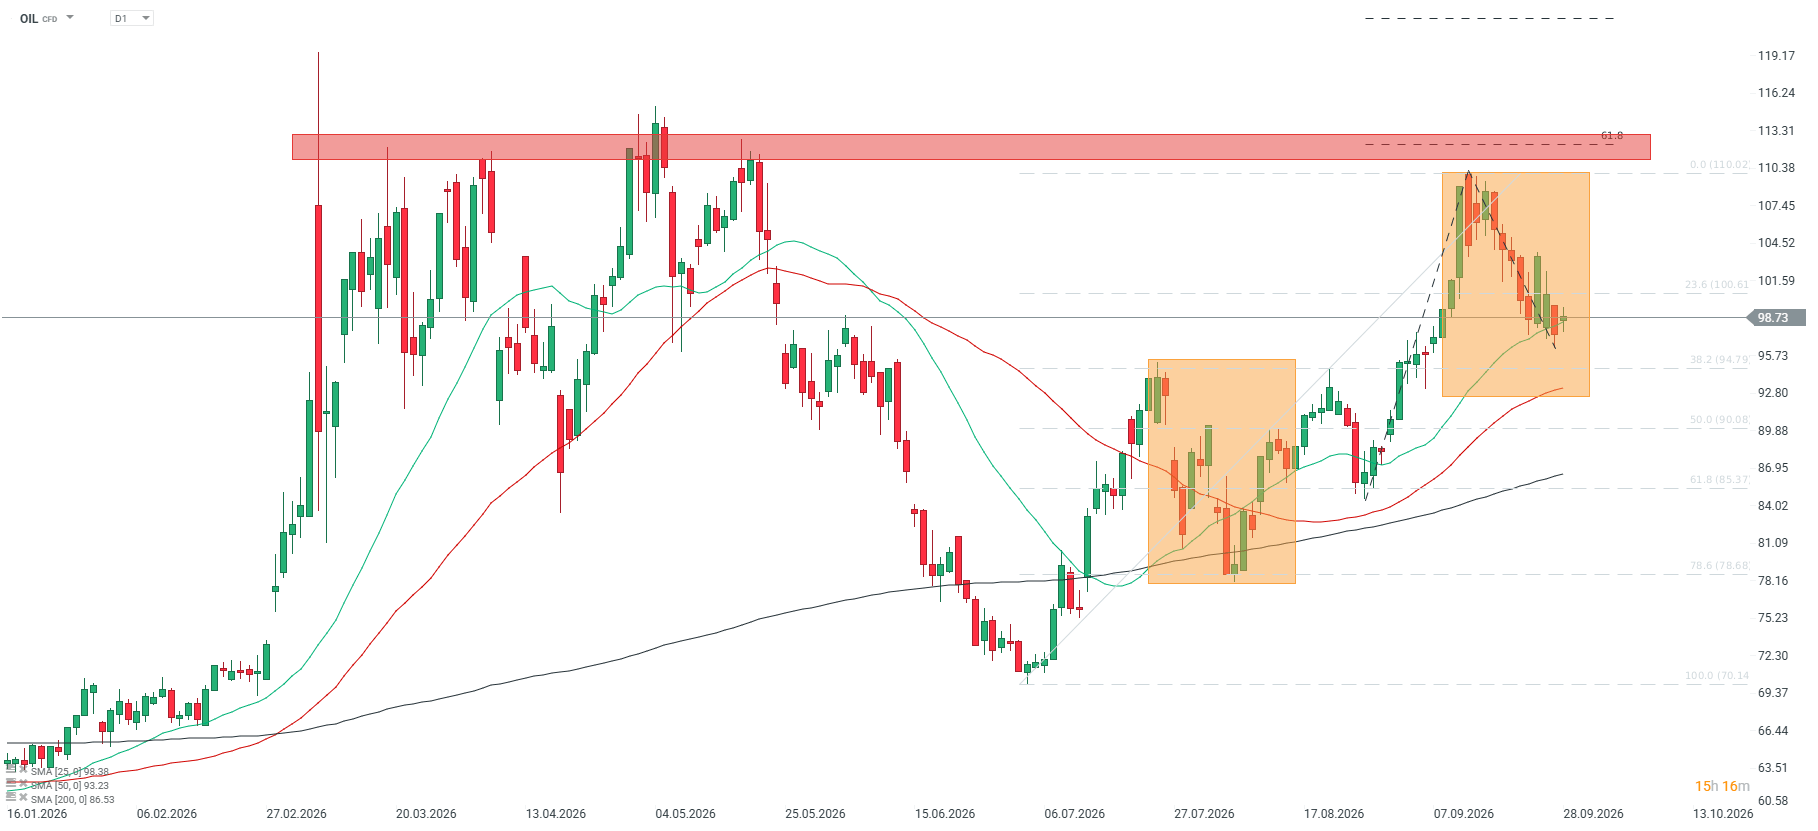
The technical picture supports the same thesis. Brent, after bouncing off the $110–$113 resistance zone, pulled back toward $99–$100 (the current xStation contract is already the December contract trading below $100—the expiring November contract is quoted at $107 per barrel, significantly inflating calendar spreads), but it remains firmly above all three key moving averages: 25-, 50-, and 200-period. The averages are stacked in a classic bullish alignment: SMA25 (around 98.6) above SMA50 (around 93.8) above SMA200 (around 87.2). This is a textbook definition of an uptrend, and as long as this structure holds, pullbacks are treated as pauses within the trend rather than the start of a sell-off. The key zone is $93–$95, representing the bulls’ defense line. Three factors converge here: the 50-period moving average around $93, the 38.2% Fibonacci retracement of the latest rally near $95, and a round psychological level. As long as price defends this region, there is no talk of a trend reversal. A signal of a trend shift to bearish would only emerge with a sustained break below $95 and a drop under the 50-period moving average. A mere pullback to this zone is not enough; a daily close clearly below it is required, confirmed by crossing SMA50 from above. Only that would open the path toward lower Fibonacci retracements, namely 50% near $90 and 61.8% at $85. For now, such a signal is absent. Conversely, a move back above $110–$113 would resume the push toward new highs.
What next for oil prices?
Putting all this information together, the longer-term direction should remain unchanged—moderate declines. On the other hand, the short term remains difficult to assess. However, investors can take some comfort. Supply can rebuild without a formal deal; the workaround mechanism (shuttle, STS, convoys) is operating and expanding almost daily, while Iran is losing control over the strait. This removes fuel from extreme bullish scenarios predicting oil soaring to all-time highs. Given that prices currently sit above estimated demand destruction levels, a scenario of $120–$150 oil does not appear to be the baseline. On the flip side, we currently have a cold war and a plateau. Normalization of supply comes at a very high cost, estimated at up to $30 per barrel. Additionally, Iran is dropping out of supply, and the risk of attacks persists. For investors, this means looking for downside opportunities is attractive yet highly risky, while playing long-term positions makes little sense due to massive backwardation. Nevertheless, if headlines trumpet an agreement again (and Iran is increasingly backed into a corner), a sharp pullback is possible, though none of the tension indicators currently show extreme overbought conditions.
Price scenarios
Base scenario, probability ~60%: Brent ranges between $93 and $108; the cold war in oil continues. Exports remain restored despite no deal, but workaround costs and risks keep prices elevated. The curve remains in deep backwardation, penalizing short futures positions heavily. Price respects the $93–$95 support and $110–$113 resistance. Bearish scenario, probability ~25%: Brent slides toward $88–$93. The prerequisite is either a real diplomatic breakthrough (opening of the Strait of Hormuz, lifting of the blockade at least on Iran’s side) or a significant drop in current operational costs alongside fewer attacks by Houthis and Iran, lowering the geopolitical risk premium. Confirming signals to watch for together: M1 minus M12 spread below +$12, Dated Brent premium below +$5, TD3c freight drop from ~$200/ton, and technically, a session close below $95 and a break of the 50-period average. Bullish scenario, probability ~15%: Brent above $115. Escalation in the Hormuz area, a successful attack on critical Aramco infrastructure, or a total breakdown of the workaround. Technically, this would mean a return above $110–$113 and a push toward new highs.
Conclusions
Without a deal, but with a functional workaround, oil enters a cold war phase: exports are returning, dampening extreme bullish scenarios, but shuttle costs, Iranian loss, and deep backwardation keep prices on a high plateau. If a breakthrough occurs in either direction, there will be an opportunity to break out of the current levels near $100 for an extended period.