







Key takeaways
- US natural gas trades below 3.00 USD per MMBtu amid strong oversupply pressure.
- Mild winter expectations and high inventory levels keep future gas prices flat.
- Extreme short positioning creates risks of a sudden price rebound if weather turns cold.
US gas prices retreat ahead of storage report US natural gas (NATGAS) is down 1.2% today, with its price below the psychological threshold of $3.00/MMBtu. The market is under strong oversupply pressure, and bearish sentiment also dominates in Europe, where supply concerns are mitigated by stable LNG transit and favorable weather. What to expect during the winter season?
- Gas prices for the upcoming winter are generally very flat compared to subsequent years (very small calendar spreads). This is a direct result of market expectations regarding a relatively mild winter, comfortably high inventory levels, and LNG export capacities that are not large enough to cause local gas availability issues.
- Estimated prices for spring and summer have fallen sharply, reaching around $2.70–$2.80.
- US weather forecasts through mid-October point to temperatures close to the multi-year average, eliminating the risk of a sudden spike in heating demand in the near term.
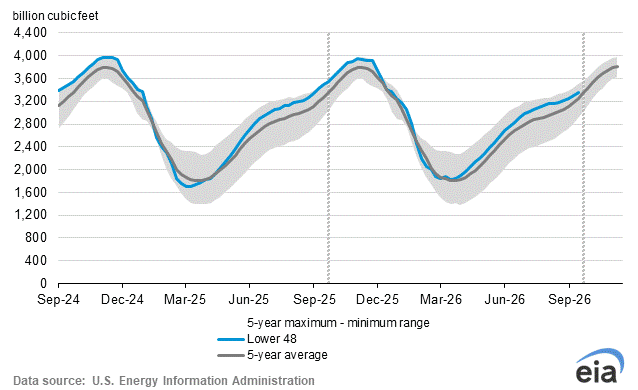
Inventories remain above the 5-year average. Source: EIA
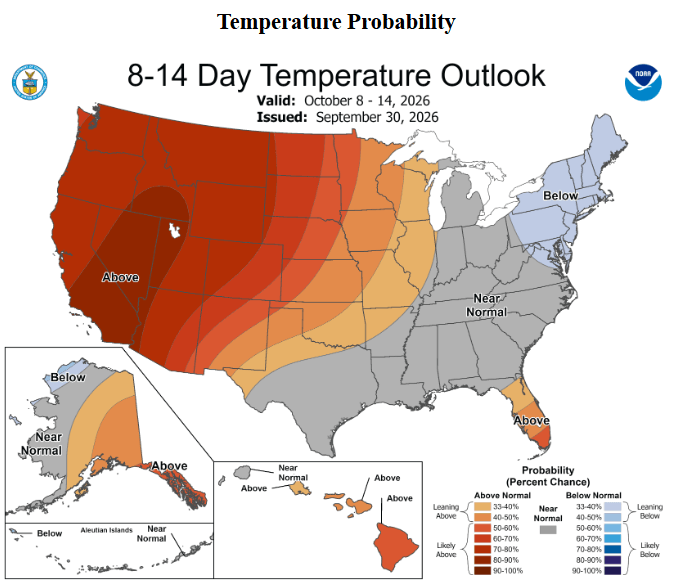
Higher temperatures are visible in the West (maintaining elevated cooling consumption), while the East shows little prospect of an early start to the heating season. Source: NOAA Today’s storage data (EIA):
- Today’s report is expected to show a US gas inventory build of 63 billion cubic feet (Bcf).
- This is below the 5-year average for this period, which stands at 80 Bcf.
- Most likely, however, once the heating season fully begins, inventory changes will work in favor of further building supply and reducing the current market surplus.
NATGAS technical analysis
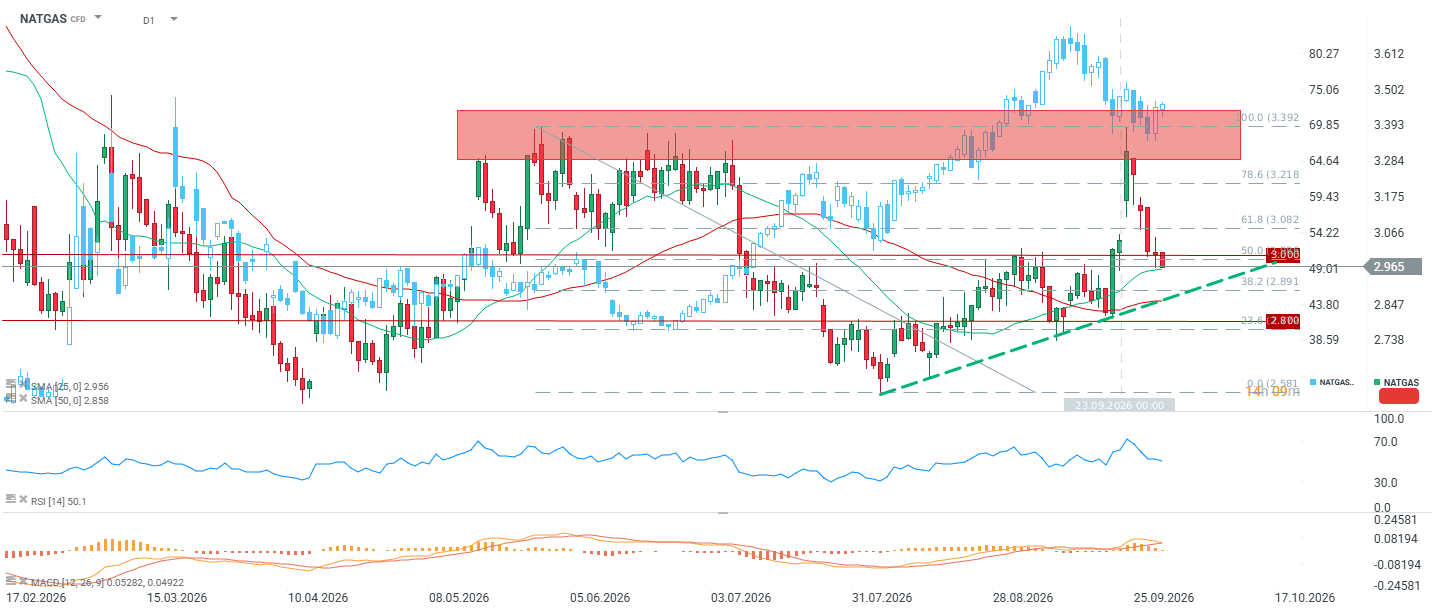
Gas has fallen into the 2.96 to 3.00 zone, where several key levels converge at once: the 50% retracement of the move from 3.392 to 2.581 (61.8% is at 3.082, while 50% falls near 2.99), the 25-day moving average at 2.956, and the round 3.00 barrier. Sitting at 2.965, the price is positioned right in the middle of this cluster. The past week brought a sharp pullback from the red resistance zone between 3.28 and 3.39, which previously held the market back in May and June. The strong gains earlier were driven by rollover effects and a temporary shutdown of a US pipeline. This marks the third failed attempt on this zone this year, serving as a clear signal of distribution. At the same time, an ascending trendline running from the July low at 2.58 currently passes through the 2.93 area. This leaves the market in a tightening wedge between that trendline and overhead resistance. With RSI perfectly neutral at 50.1, it offers no directional clues. MACD is fading following the September bullish impulse. Key risks: Although the market is fundamentally bearish, speculative positioning (extreme short dominance) creates an asymmetry of risk. A sudden cold snap in the second half of October or unexpected disruptions in global LNG supply chains could trigger aggressive short covering (a so-called short squeeze) and a dynamic price rebound.