







Key takeaways
- US natural gas prices rose over 4% to around 3.1 USD per MMBtu, driven by short covering.
- Speculative funds hold near-record net short positions, creating high volatility on weather shifts.
- A rare stratospheric warming event threatens early cold weather and potential price breakouts.
US natural gas is rebounding this week with clear momentum, in contrast to the situation in European gas. Henry Hub contract prices rose over 4% on Monday to around $3.1/MMBtu, the highest since October 15, and this morning the market continues its move toward $3.2/MMBtu. Since the beginning of November, the price has already gained nearly 10%, although it is still down 11.1% year-to-date and 28.4% year-on-year. Fundamentals are not yet clearly supportive of gains: inventories are growing faster than average for this time of year, and November forecasts point to warm weather. However, positioning provides the fuel. Funds are as heavily short as they rarely have been in history, and the first sign of cold weather in weeks has appeared in weather forecasts.
Inventories favor the bears, but they are not calling the shots now
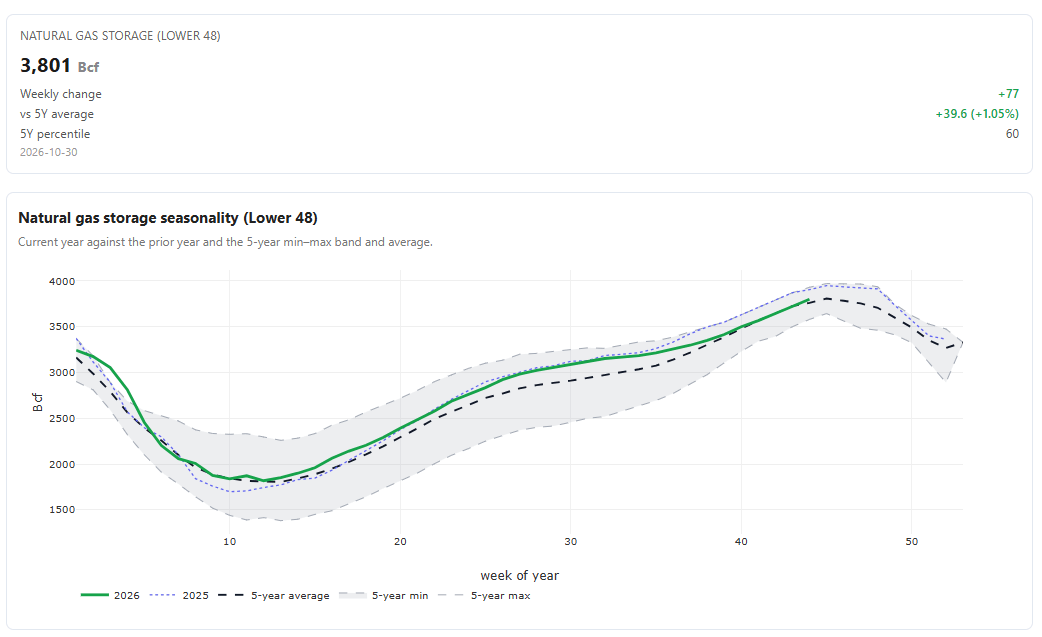
The latest EIA report showed a storage build of 77 billion cubic feet (Bcf) for the week ending October 30. That is 4 Bcf less than the market expected, but 16 Bcf above the five-year average for the week. Total working gas in storage stands at 3,801 Bcf, which is 54 Bcf (1.4%) above the five-year average and 109 Bcf lower than a year ago. The direction is important: the surplus relative to the average is growing for the second consecutive week, after ten weeks of declines from +198 Bcf in August. NGI estimates that Thursday’s report will add 67 Bcf, raising the surplus to around 81 Bcf. This is due to a warm autumn: according to NOAA data, the number of Heating Degree Days (HDD) during the October 30 – November 5 period was 21% below normal, and NGI notes El Niño is already leaving its mark on the heating season. This may also be a warning sign for overly bullish investors. Although the current rebound is distinct, it could turn into declines just as quickly.
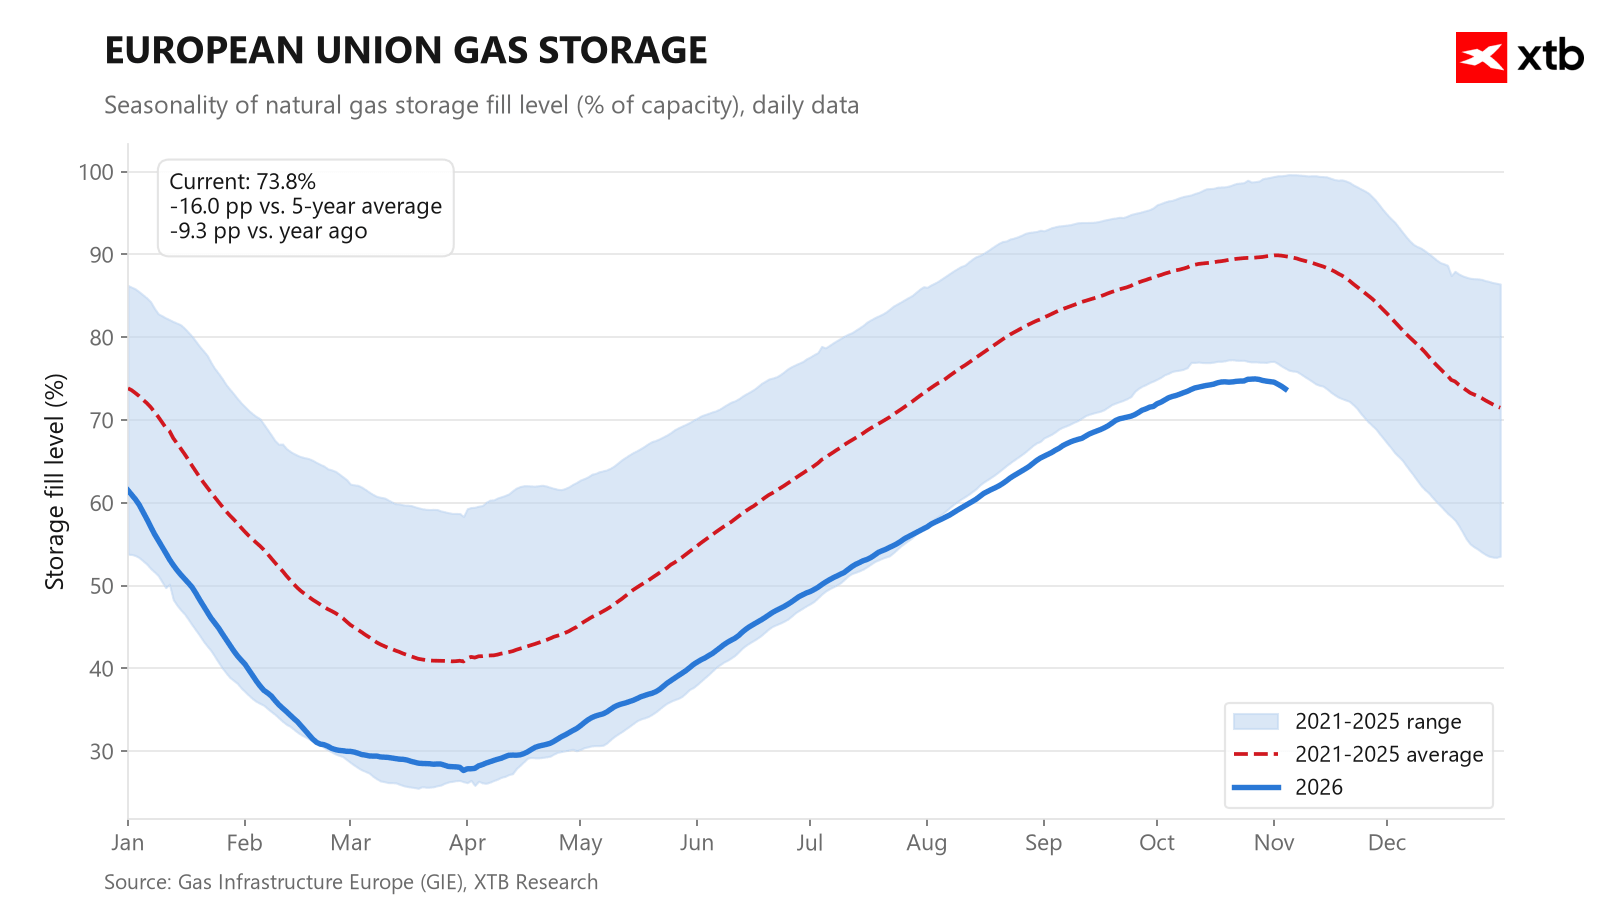
Demand is supported by other factors, however. Production in the Lower 48 states dropped last week by 3.3 Bcf/d to 108.8 Bcf/d, and some northeastern producers are announcing curtailments. LNG exports remain near record highs as Europe still faces a supply deficit. European TTF fell 17.7% last week to 85.6 EUR/MWh as the market priced in an agreement with Iran instead of renewed attacks. Nevertheless, European storage facilities have been withdrawing gas since October 27, and Qatari exports will not return to normal for a long time.
Weather: El Niño vs. polar vortex disruption
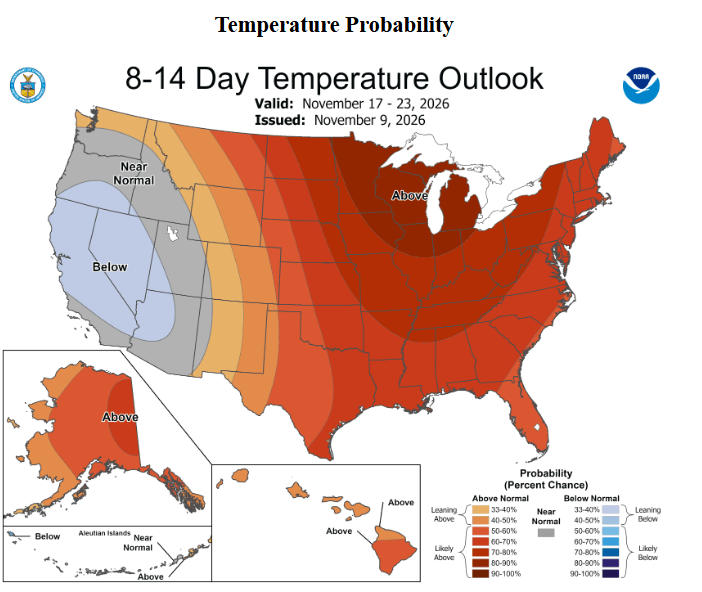
NOAA’s monthly outlook for November still indicates above-normal temperatures across most of the US, consistent with typical El Niño impacts. However, a wild card has emerged that the market had not previously priced in. Models signal a disruption of the stratospheric polar vortex, and even a Sudden Stratospheric Warming (SSW) event next week. A November SSW is very rare, and its effects can last up to two months, usually through a negative Arctic Oscillation phase and an influx of cold air. In the short term, over 160 million Americans will experience below-normal temperatures through November 14, primarily in the Great Lakes, Ohio Valley, and Northeast regions. 6–10 and 8–14 day forecasts show cold zones for the first time in weeks.
Positioning: fuel for a short squeeze
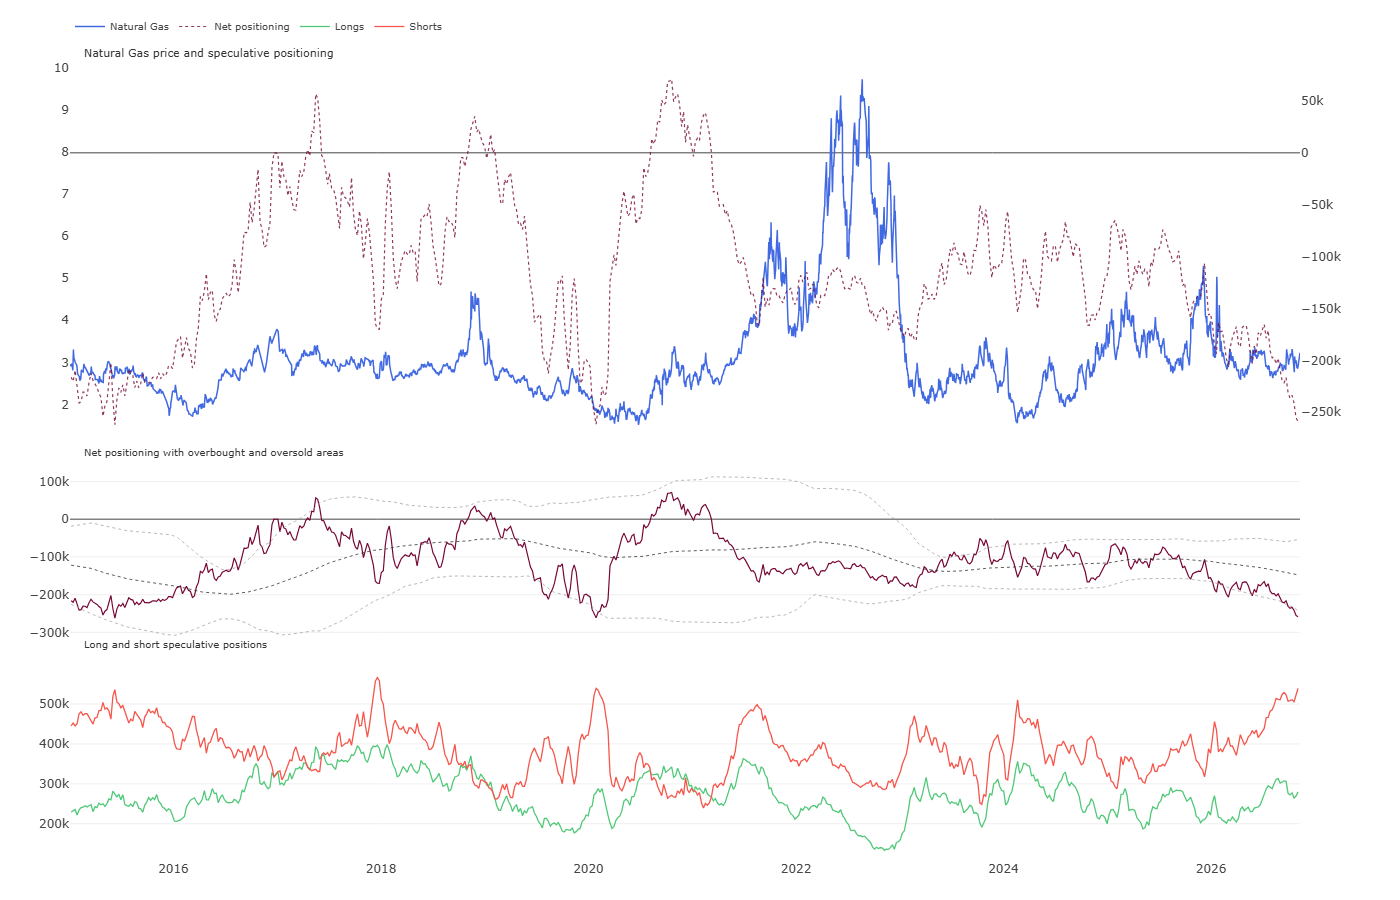
Key to the current movement is the balance of power in the futures market. According to CFTC data, speculative funds hold a net short position of around 259,000 contracts, corresponding to just the 0.2 percentile historically. Short positions reached around 540,000 contracts, the highest in years, while the share of long positions dropped to 34.2%. Over the last week, funds added further short positions, but the momentum is clearly slowing. With such a crowded market, a prolonged cold wave is not needed—only a spark to trigger short covering. CFTC positions date back to Tuesday when the December contract was priced around $2.90. Since then, the price has risen over 10%, meaning a significant portion of short positions is now deep underwater.
NATGAS Technical Analysis
Gas prices broke above the 75-day moving average ($2.94) and reached the 1-year moving average (around $3.2), which has consistently capped gains since the beginning of 2026.
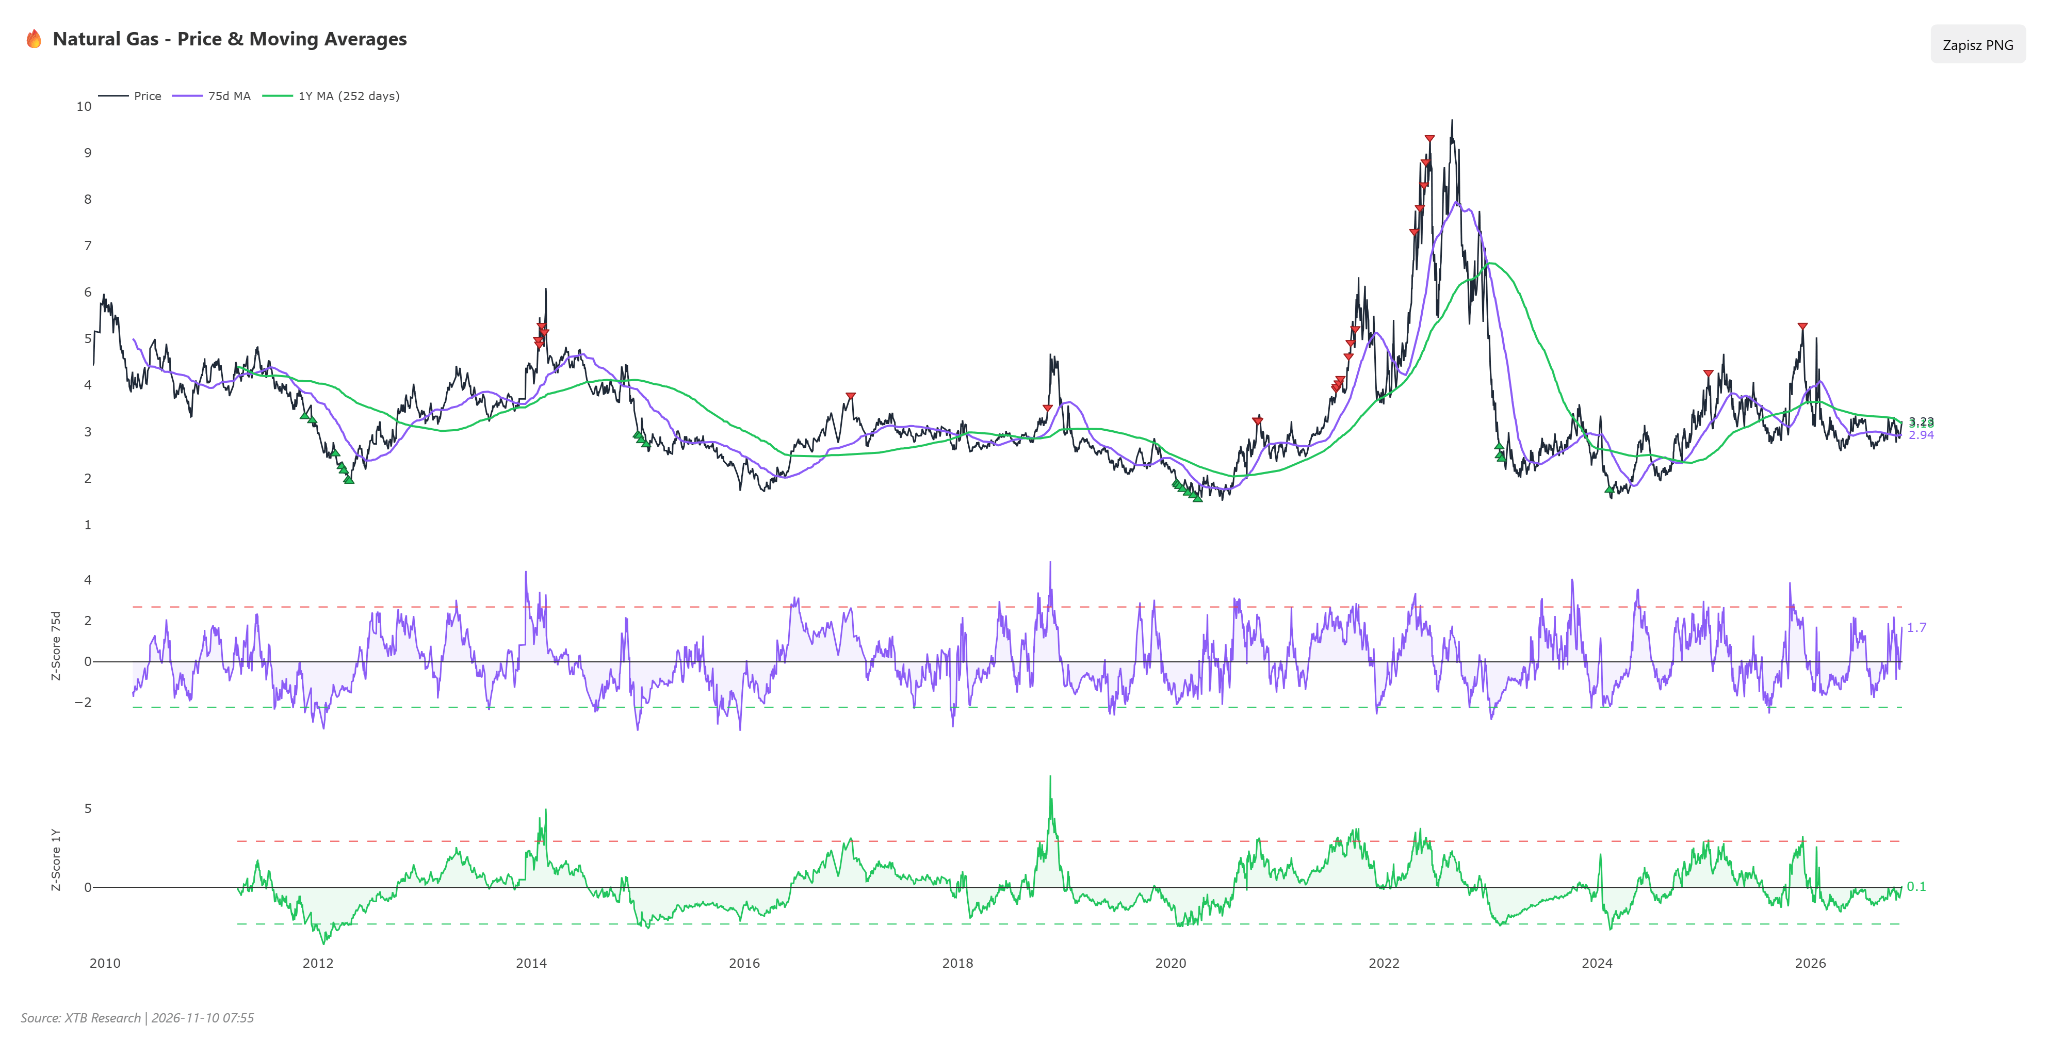
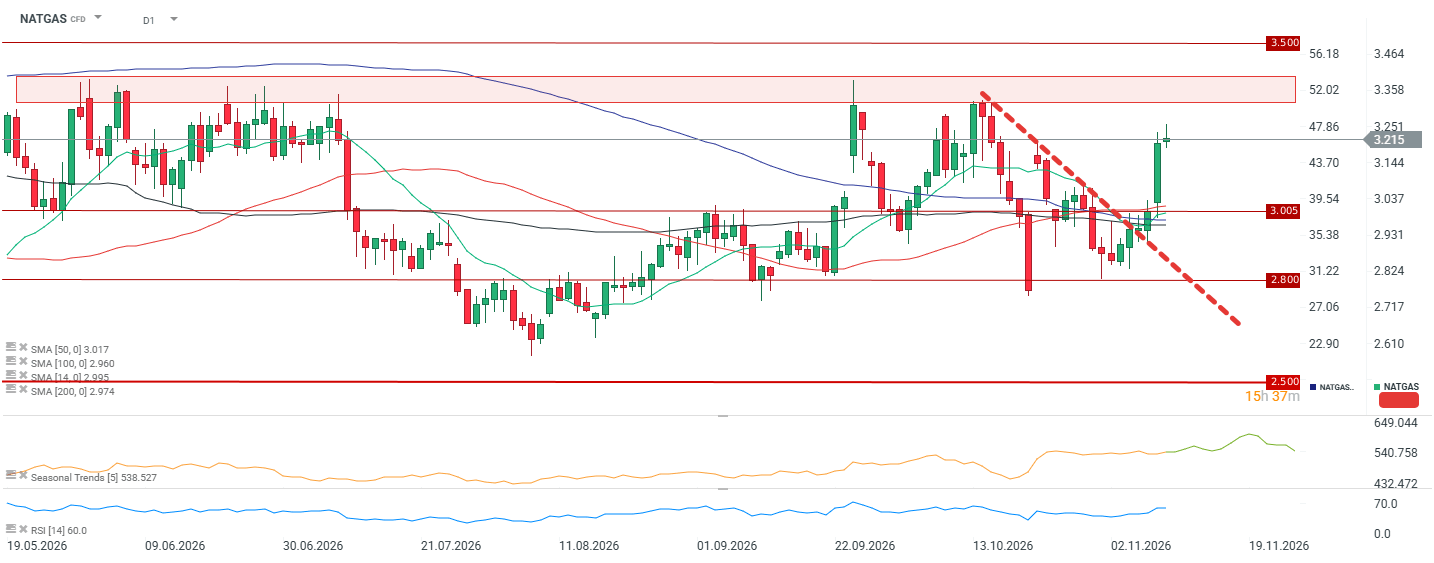
RSI(14) at 61 shows buyers in control, but not yet overbought. SMA and MACD issue buy signals, and the price is 7.3% above the 50-session moving average. The Z-score relative to the 75-day average is 1.7, indicating a dynamic but not extreme move. Relative to the 1-year average, valuation is neutral (0.1). The market has thus closed the undervaluation of recent months, but is not yet overheated. A sustained breakout above the 1-year average would be the first signal of a medium-term trend change in many months. Looking at the technical chart, it is worth noting that we have a clear breakout above the downtrend line, but the key resistance zone lies around $3.35.
What’s next for the price?
Fundamentals do not justify a lasting bull market for now: storage surplus is growing, and NOAA’s monthly forecast remains warm. However, a market with record short fund positioning does not need strong fundamentals, just a spark. That spark could be the cold wave through November 14 and the risk of a rare November SSW. If cold weather persists and production remains below 111 Bcf/d, a breakout above $3.4–$3.5 could trigger a cascade of short covering toward $3.8–$4.0. If forecasts for the second half of November moderate and Thursday’s EIA report confirms a further surplus build, the breakout could prove false. A move below $3.0 would then restore control to the bears and open the door toward $2.6–$2.7. The immediate catalysts are today’s STEO report from the EIA, Thursday’s inventory data, Friday’s COT report, and updated NOAA forecasts.