




Ferrari (RACE.US, RACE.IT) has released its results for the third quarter of 2026. They are slightly better than expected, even though car sales have stalled. Maranello is raising its full-year forecast for the third time this year.
Ferrari is once again making more money while selling the same number of cars. In the third quarter, it delivered 3,368 cars to customers, 1% fewer than a year ago. Despite this, revenue rose by 7% and operating profit by 12%. Three factors are making the difference: the product mix, customizations, and the F80 supercar.
Results vs. Expectations
- Deliveries: 3,368 units (consensus: 3,371 units), -1% year-over-year
- Revenue: 1.896 billion EUR (consensus: 1.89 billion EUR), +7% year-over-year, +10% at constant exchange rates
- EBITDA: 753 million EUR (consensus: 734–739 million EUR), +12% year-over-year
- EBITDA Margin: 39,7%, +180 pb r/r
- EBIT: 563 million EUR (consensus: 547–553 million EUR), +12% year-over-year, +23% at constant exchange rates
- EBIT margin: 29.7%, +130 basis points year-over-year
- Net income: 431 million EUR (consensus: 419 million EUR), +13% year-over-year
- Diluted EPS: 2.44 EUR (consensus: 2.38–2.40 EUR), +14% year-over-year
- Industrial free cash flow (FCF): 567 million EUR, +43% year-over-year
- Revenue forecast for 2026: approximately 7.65 billion EUR (consensus: 7.65 billion EUR)
What drives performance? Price and mix, not volume
The F80 and supercars.
Supercars account for only 1% of quarterly deliveries, or a few dozen cars. However, with the F80 priced at several million euros per unit, they have a significantly greater impact on revenue and margins than on unit volume. CEO Benedetto Vigna explicitly cites F80 deliveries as one of the pillars of the quarter.
Special editions and customizations.
Special editions, primarily the 296 Speciale family, account for 22% of deliveries. Added to this are customizations, which, according to Ferrari, are “stronger than initially anticipated.” This is the same strategy that has built the company’s competitive advantage for years: customers pay for uniqueness, and the surcharges for individual finishes yield a margin close to pure profit.
Model lineup refresh.
Ferrari is in the midst of a major lineup overhaul. The 849 Testarossa (coupe and Spider versions) and the 296 Speciale A are being introduced. The 296 GTS, Roma Spider, and SF90 XX are being phased out. The Amalfi, 12Cilindri, and Purosangue are now in full production. The newer models are more expensive than the ones they are replacing, so the lineup refresh is raising the average price.
Currency fluctuations are holding back growth.
At constant exchange rates, revenue would have grown by 10% and EBIT by as much as 23%, instead of 7% and 12%. The weaker dollar is significantly reducing reported results. Management notes, however, that the impact of currency fluctuations, after taking hedges into account, is less than was feared at the beginning of the year. Cash. The 43% increase in industrial FCF, to 567 million EUR, is perhaps the strongest aspect of the report. It shows that profits are translating into cash despite higher spending on new models. The order book already extends through 2028, and two more product launches are planned by the end of the year. The company therefore has very good revenue visibility, which is rare in the automotive industry.
Delivery Structure and Model Replacement
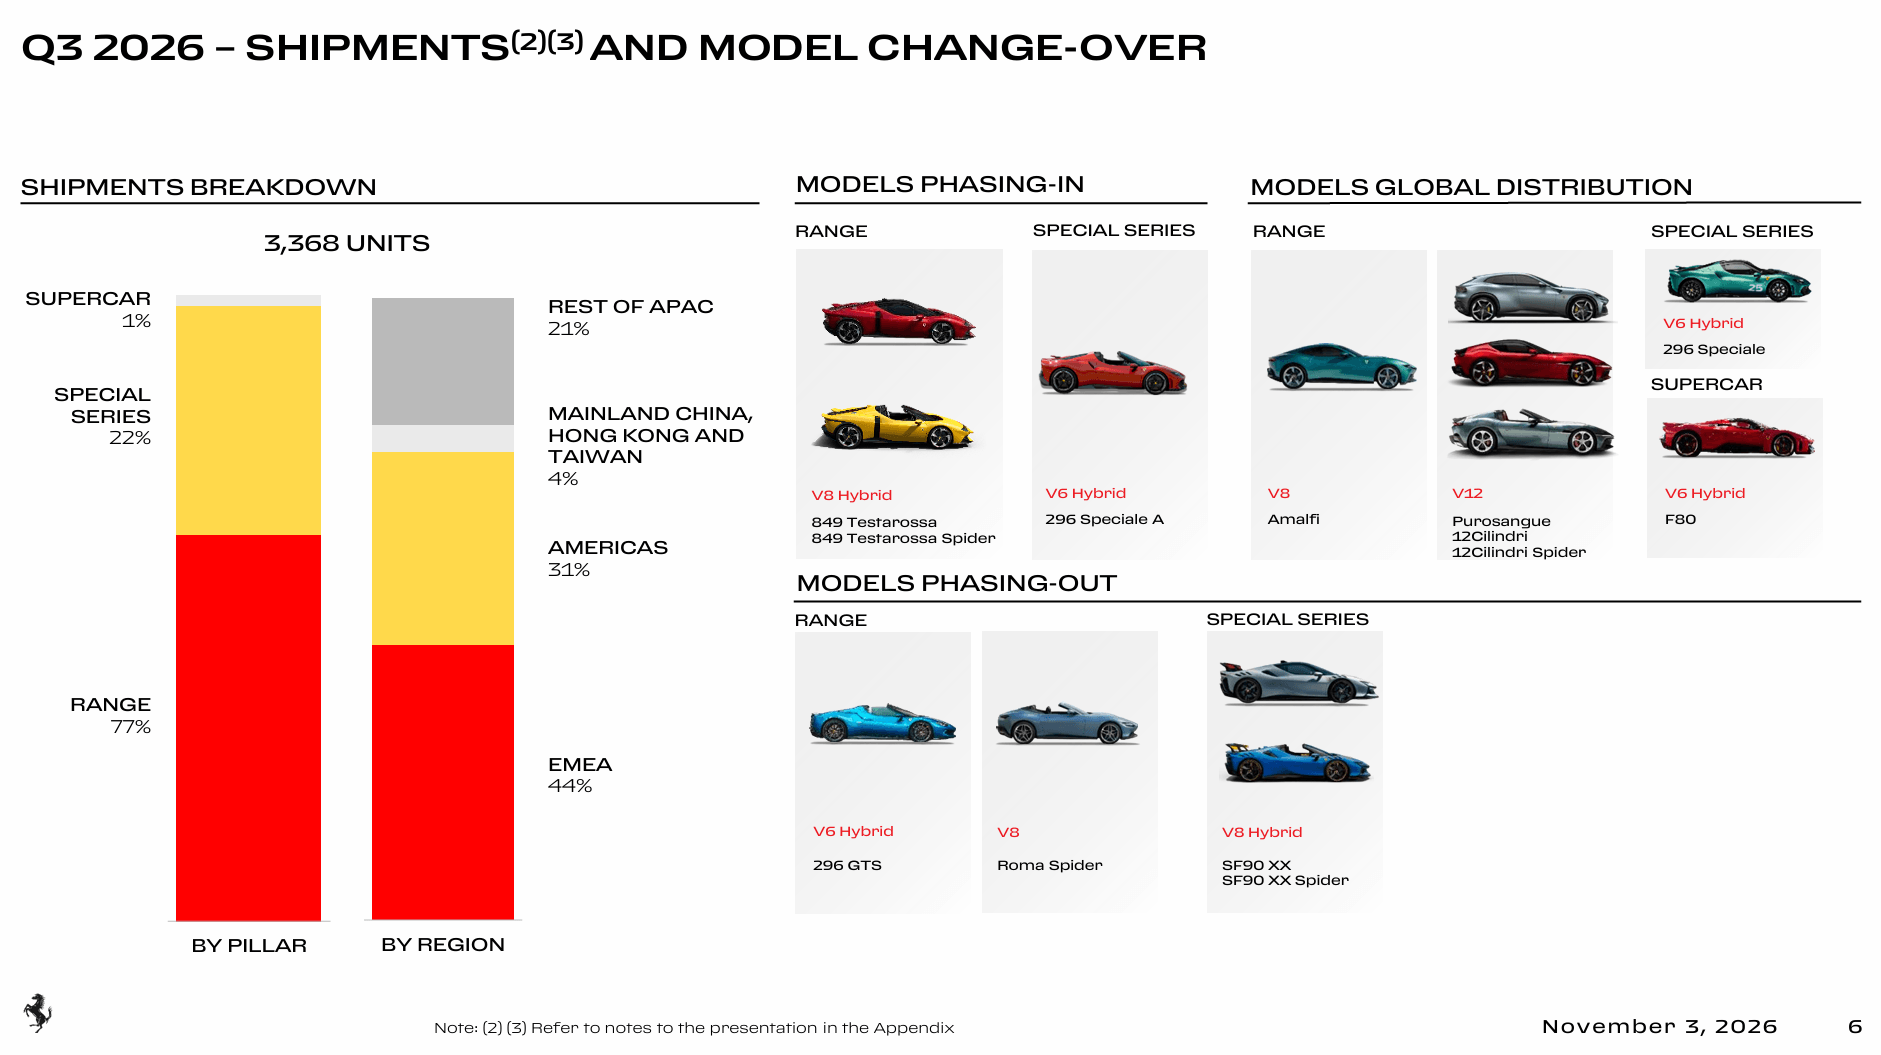
Deliveries in Q3 2026 totaled 3,368 units. The core lineup accounted for 77% of the volume, special editions for 22%, and the F80 supercar for 1%. By region: EMEA 44%, the Americas 31%, the rest of Asia-Pacific 21%, and mainland China, Hong Kong, and Taiwan only 4%. On the right are the models being introduced and discontinued. China’s very small share (4%) shows that Ferrari is much less exposed to weak Chinese demand for luxury goods than European premium car manufacturers. The results are based on Europe and the United States. Source: Ferrari Investor Relations
Revised Forecast for 2026
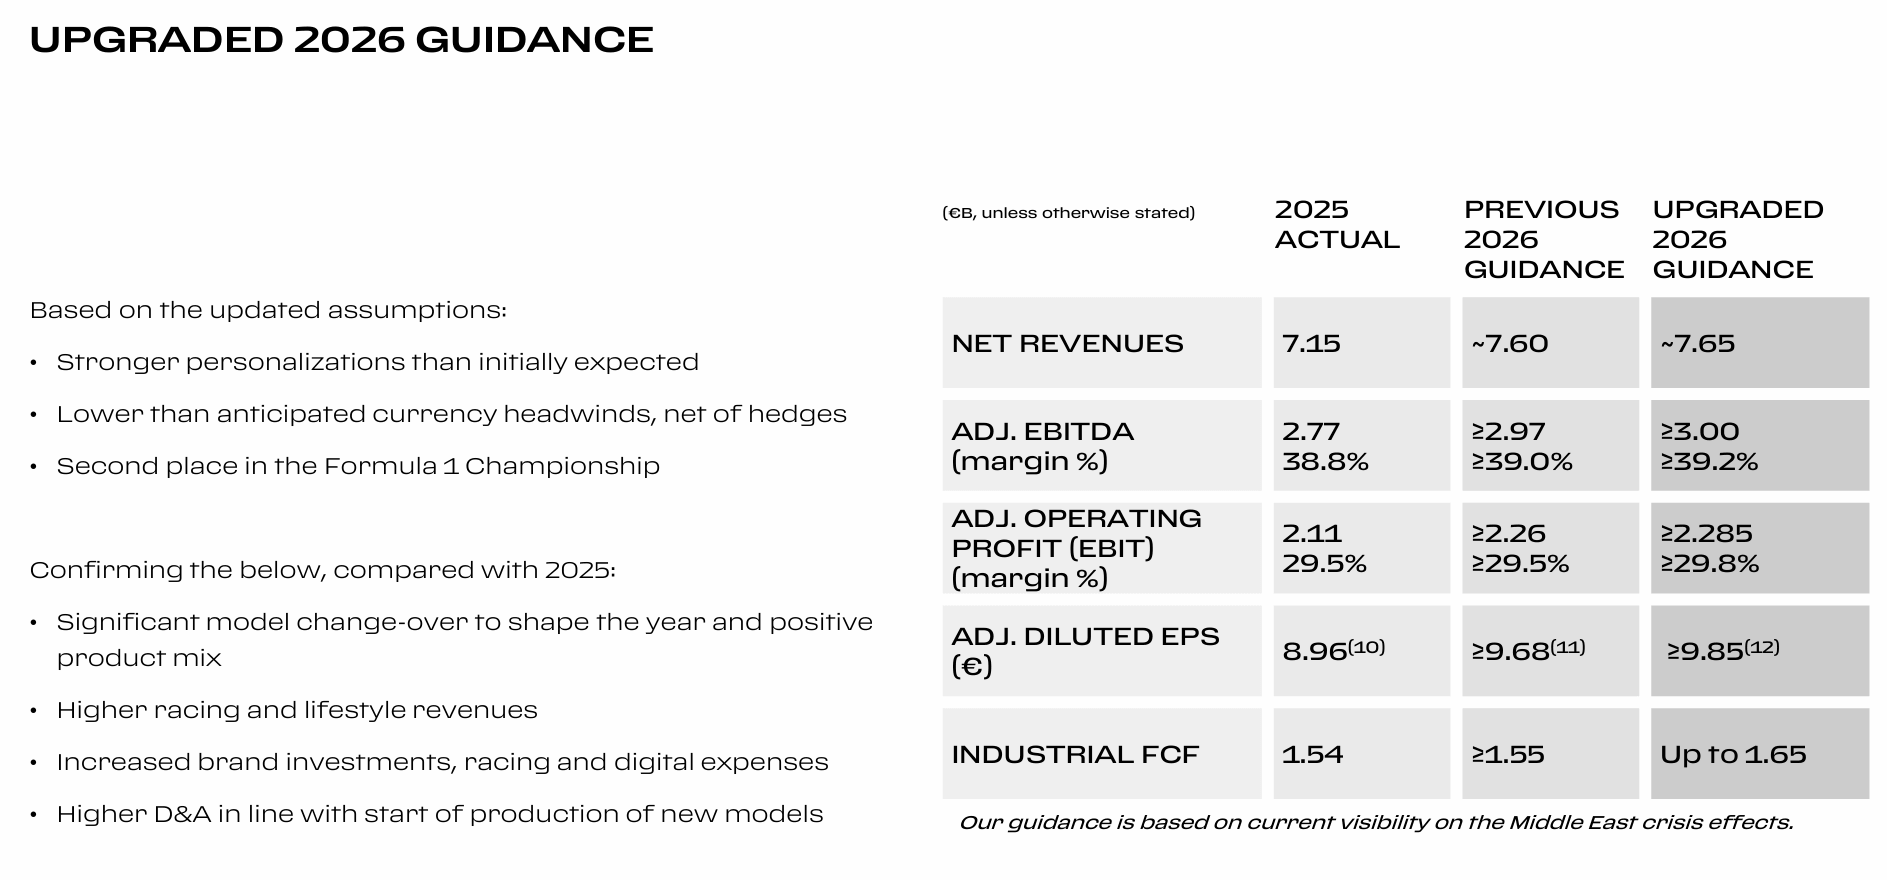
Ferrari is raising all key figures in its full-year forecast. Revenue: approximately 7.65 billion EUR (previously approximately 7.60 billion). EBITDA: at least 3.00 billion EUR with a margin of at least 39.2% (previously 2.97 billion and 39.0%). EBIT: at least EUR 2.285 billion with a margin of at least 29.8% (previously 2.26 billion and 29.5%). Diluted EPS: at least EUR 9.85 (previously 9.68). Industrial FCF: up to 1.65 billion EUR (previously at least 1.55 billion). Management attributes the increase to stronger customization, a smaller-than-expected impact from currency fluctuations, and second place in the Formula 1 championship, which translates into sponsorship and licensing revenues. The company notes that the forecast is based on current understanding of the effects of the crisis in the Middle East. This is a significant risk factor, as the region is a key market for high-end cars. With a projected EPS of 9.85 EUR, the shares are trading at approximately 37 times this year’s earnings. This valuation is typical for luxury brands, not for automakers, so it leaves little room for disappointment. Source: Ferrari Investor Relations
Technical Analysis: The price is testing resistance
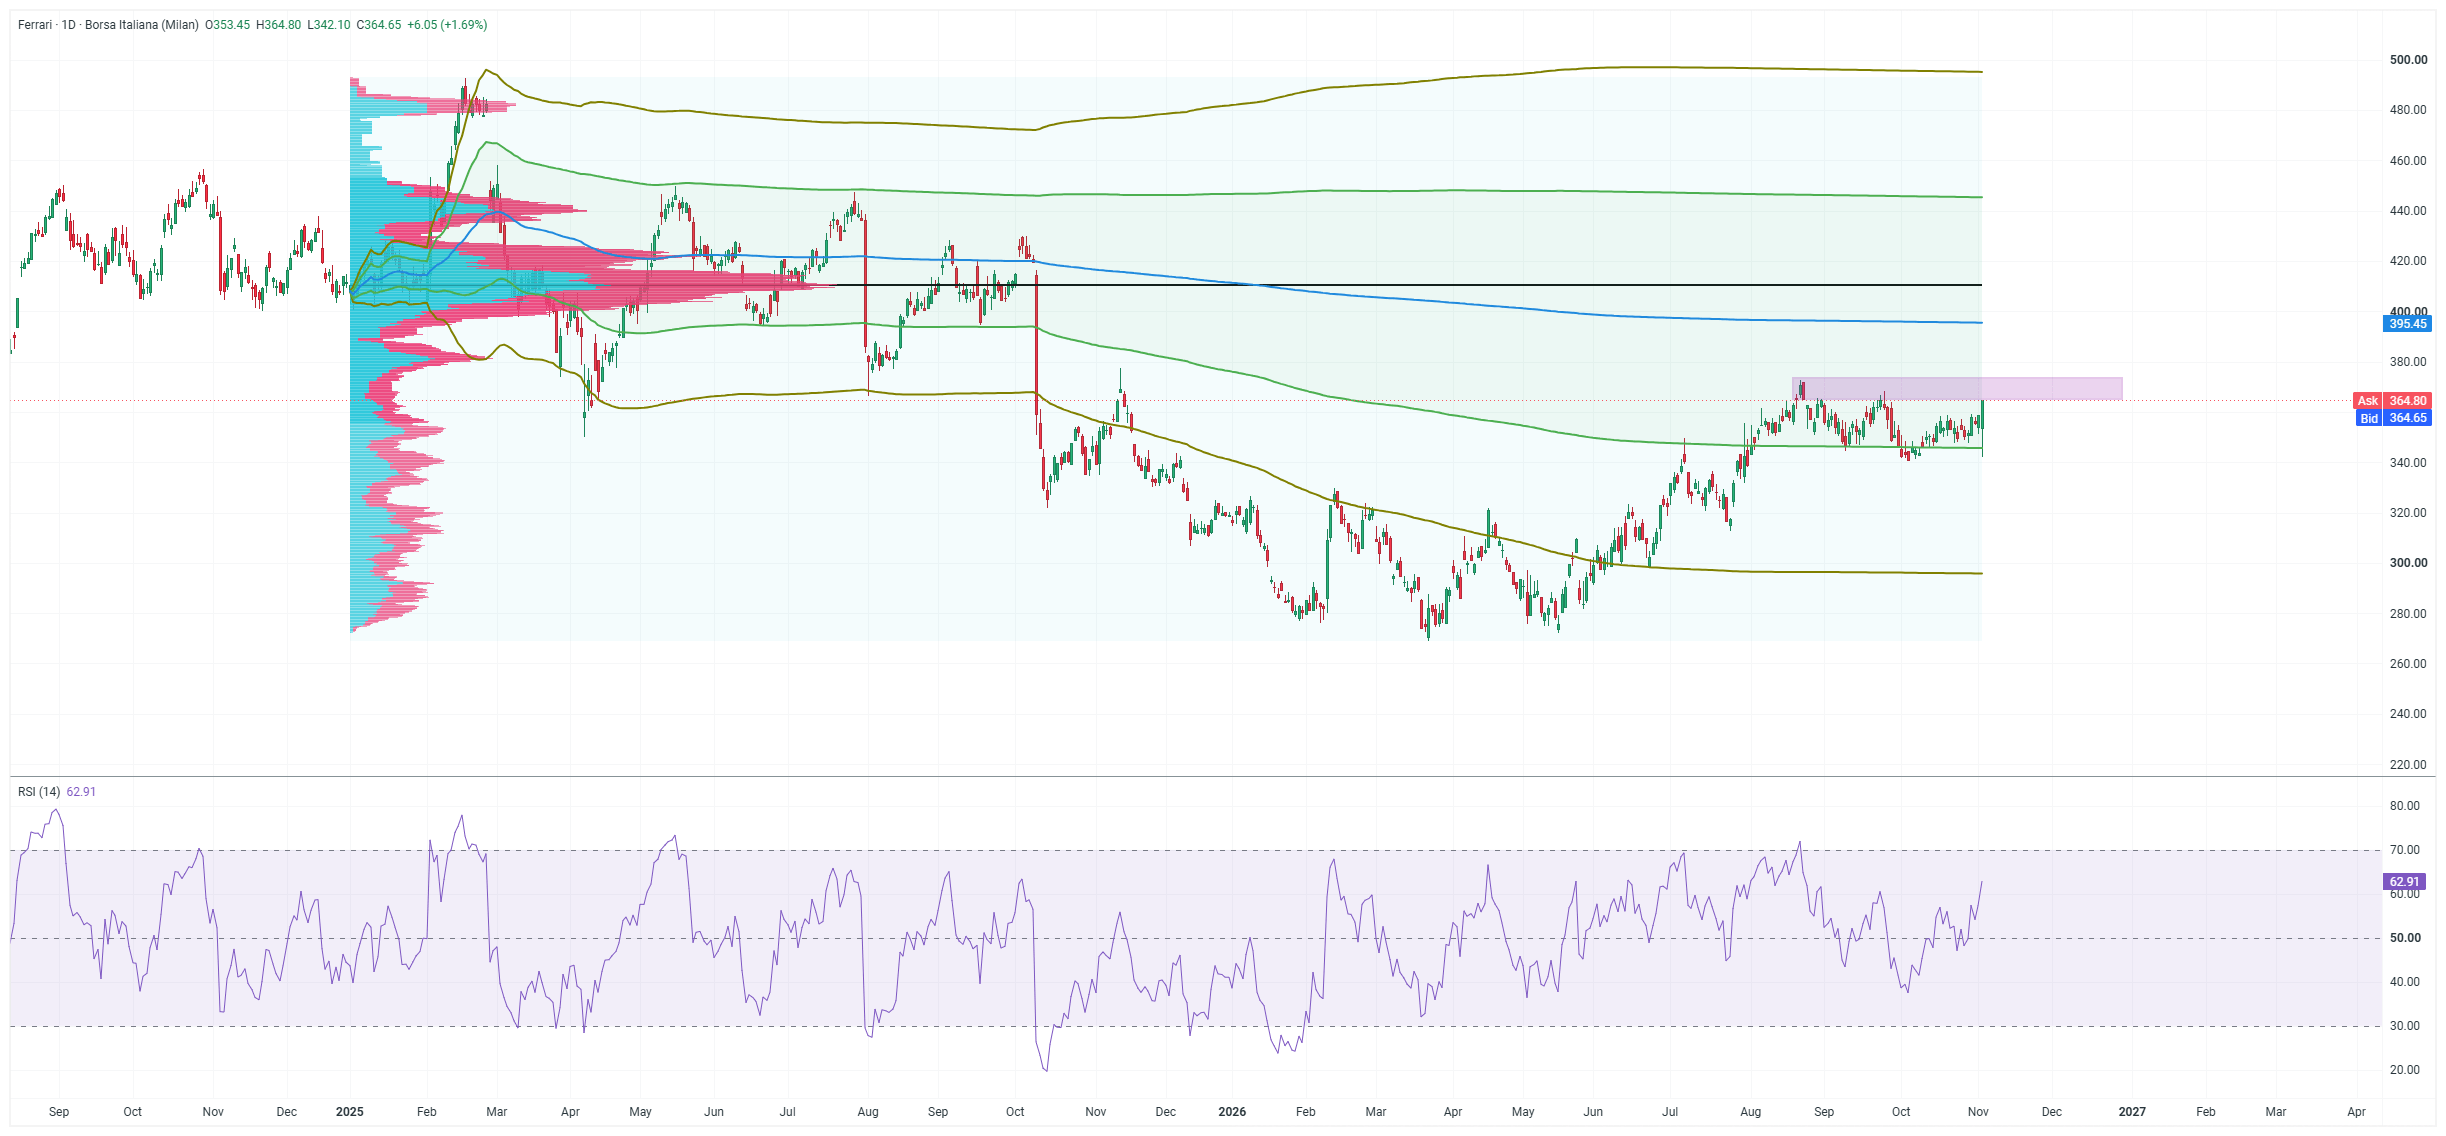
The daily chart shows that Ferrari shares are still recovering from two sharp declines in 2025. The first occurred following the July earnings report. The second, more severe decline took place in October after Capital Markets Day, when the market reacted negatively to the company’s medium-term targets. The lows were reached in March and May 2026, around 270–275 EUR. A double bottom formed there, from which a clear uptrend has been in place since June. Since August, the price has been consolidating between approximately 345 and 372 EUR. Yesterday’s trading session is technically significant. This morning, the price fell to 342 EUR, which is below the lower VWAP line calculated from the beginning of 2025 (approx. 346–347 EUR). However, it closed at its high of 364.65 EUR. Such a long lower shadow on the candlestick indicates that buyers are strongly defending the support zone.
The price has just entered the resistance zone of 365–373 EUR (purple rectangle), defined by the August and September highs. If it breaks out of this zone at the close, the next targets will be around 377–380 EUR (the November 2025 high), followed by the VWAP at approximately 395 EUR, and then around 410 EUR. At 410 EUR lies the highest trading volume on the Price of Convergence (POC) chart, and this is where the gap begins following the October 2025 decline. If the breakout fails, support remains at 345–347 EUR, and lower at 340 EUR and 315–320 EUR (the July low). The RSI(14) is around 63 and rising. Momentum is therefore positive, but the indicator is not yet in overbought territory, which leaves room for further gains. The coming trading sessions will show whether today’s reaction to the earnings report will be enough to break out of the three-month consolidation.