




Welcome to Today Markets — an offshore CFD trading destination built for traders looking for access to global financial markets, powerful trading technology and a better online trading experience.
As part of a broader financial group with regulated businesses and financial technology companies operating across multiple markets, Today Markets combines market access, technology, education and guidance in one connected experience.
Whether you are taking your first steps in trading or looking to develop your market knowledge further, we are here to help you understand the markets, access the tools you need and trade with greater awareness.
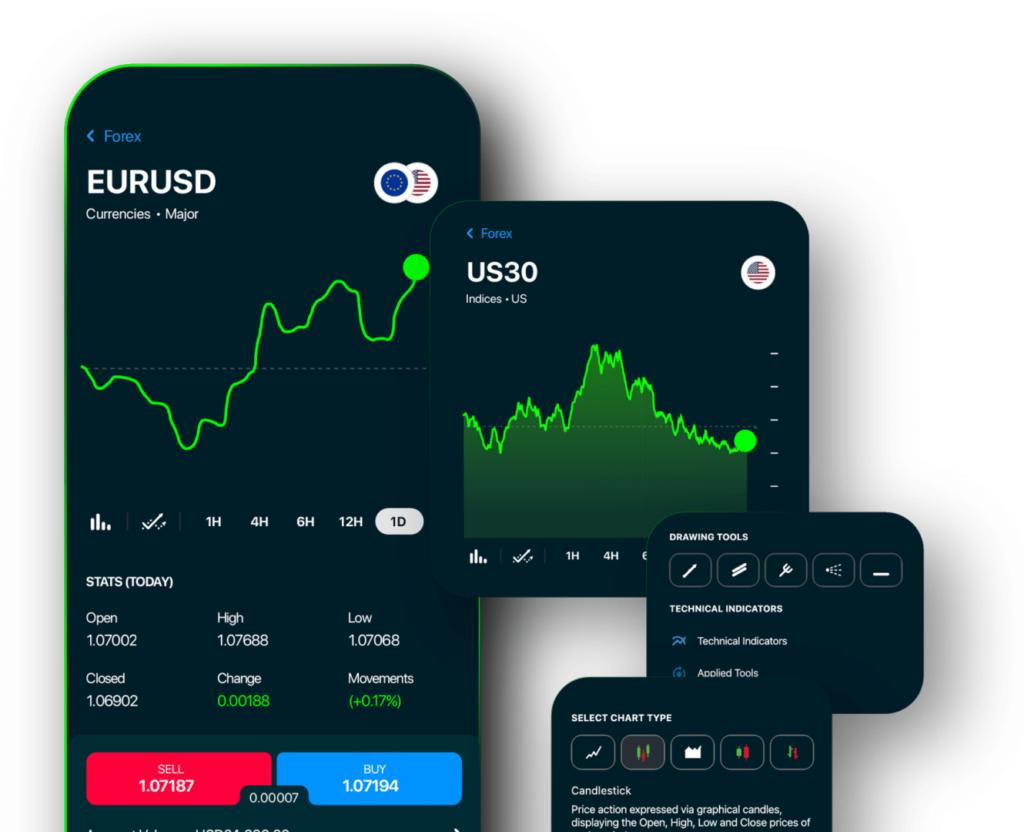
Use charts, indicators and market analysis tools to study price movements, identify potential trends and develop a structured trading approach across global financial markets.
Technical analysis is the study of historical price movements, market data and trading activity. Traders use technical analysis tools to help identify trends, momentum, potential support and resistance levels and possible changes in market conditions.
Moving averages smooth historical price data to help traders identify potential trends and assess the general direction of a market.
The RSI is a momentum indicator that measures the strength and speed of recent price movements. Traders may use it to analyse momentum and potential overbought or oversold conditions.
The Moving Average Convergence Divergence indicator is used by traders to study momentum, trend direction and potential changes in market conditions.
Bollinger Bands use a moving average and standard deviation to create dynamic bands around price. Traders may use them to analyse volatility and price movement.
The stochastic oscillator compares a market's closing price with its price range over a specified period to help analyse momentum.
ATR measures historical market volatility and can help traders understand how much an instrument has typically moved over a given period.
Fibonacci retracement levels are used by many traders to analyse potential areas of support and resistance during market pullbacks.
ADX is commonly used to analyse the strength of a market trend, regardless of whether the broader direction is upward or downward.
Volume-based tools can help traders study the relationship between price movement and trading activity where relevant market data is available.
Professional traders often combine multiple forms of analysis rather than relying on a single technical indicator.
For example, a trader might study a moving average to assess the broader trend, RSI to analyse momentum and ATR to understand recent market volatility.
The combination of tools can help traders build a more structured market-analysis process.
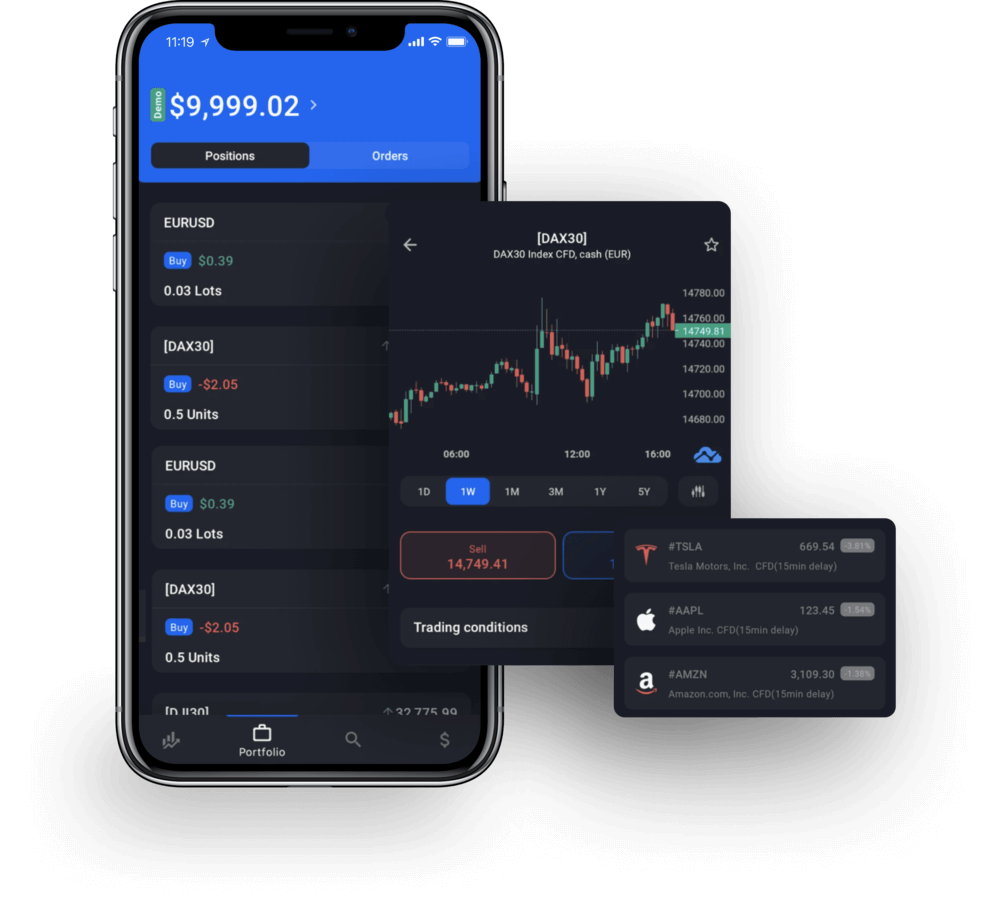
cTrader provides charting functionality designed for different approaches to trading. Traders can analyse multiple markets, change timeframes, add indicators and study price action.
Depending on their strategy, traders may analyse short-term intraday charts, longer-term trends or multiple timeframes together.
Technical analysis can be approached in different ways depending on the trader's strategy, timeframe and objectives.
Study whether a market is showing an upward, downward or sideways trend using price action, moving averages and trendlines.
Examine the strength and speed of price movement using tools such as RSI, MACD and stochastic oscillators.
Study how much an instrument is moving using indicators such as ATR and Bollinger Bands.
Identify potential areas where price has historically reacted or where traders may monitor changing market conditions.
Analyse price movements directly through candlestick charts, chart patterns and market structure.
Compare different timeframes to understand broader market direction alongside shorter-term price movements.
A structured process can help traders approach market analysis consistently.
Study the market and identify the broader price environment.
Apply relevant indicators and tools to examine price behaviour.
Define your trading idea, potential entry and exit levels.
Review your analysis and trading decisions over time.
Access advanced charting and technical analysis tools through cTrader and explore global markets with a platform designed for modern traders.
Explore the Platform