




After a wave of strong gains in the first half of August, the Japanese Nikkei 225 index recorded a sharp drop of over 2% today. The index contract is currently at 67400, deepening its declines along with falling contracts on US indices. If the current downward momentum continues at the end of the Asian session, it could be the deepest one-day correction since late July. Investor optimism hit a wall, and risk aversion prevailed in markets across the Asia-Pacific region.
Behind such a sharp deterioration in sentiment in Japan is a combination of several key factors: from escalating geopolitical tensions, through rising bond yields, to yesterday’s disappointing economic data.
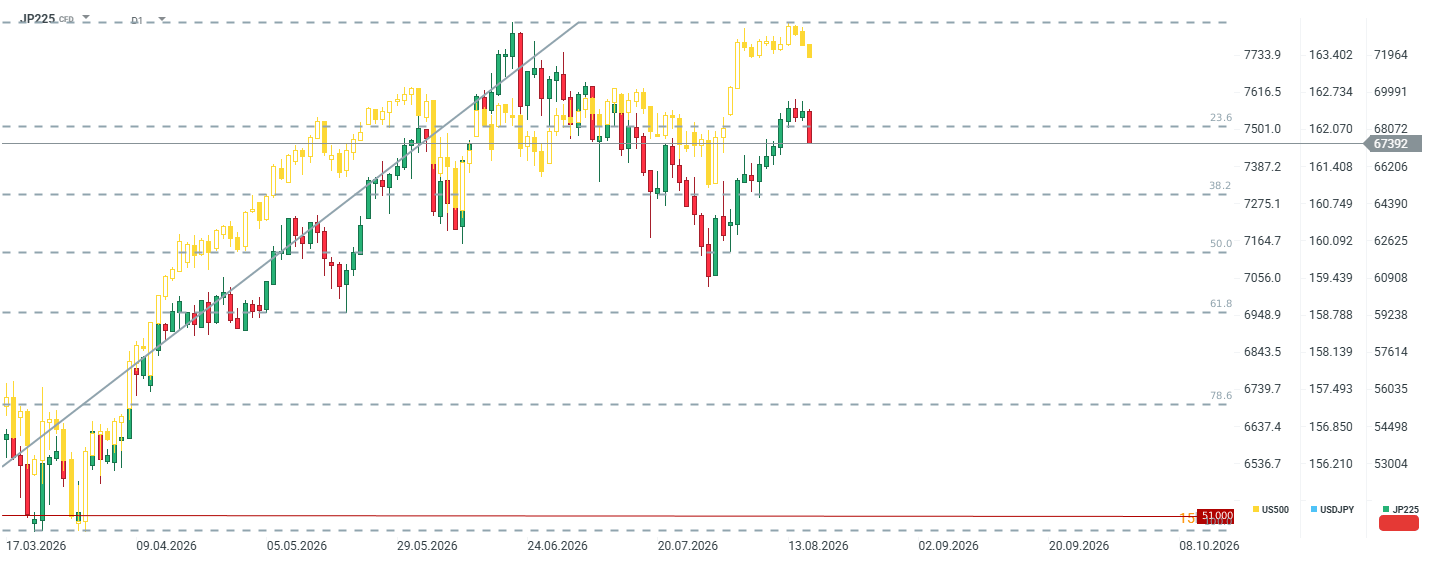
JP225 could potentially be breaking out of its current short-term uptrend. Source: xStation5
Reasons for the decline in Japanese stock prices
1. Jump in oil prices and the specter of escalation in the Middle East Geopolitics became the trigger for the sell-off. US President Donald Trump categorically ruled out extending the temporary ceasefire with Iran, and his harsh rhetoric (including threats against Oman) raised concerns about the security of commodity supplies. The market reaction was immediate: the price of Brent oil broke the level of 91 USD per barrel, and American WTI rose above 84 USD. For Japan, an economy almost entirely dependent on energy imports, this is terrible news. A sharp rise in oil prices means higher costs for companies and hits margins, which naturally prompts investors to sell stocks on the Tokyo floor.
2. Japanese bond yields at levels from 1996 Another massive burden on the stock market is the debt market. Yields on 10-year Japanese Government Bonds (JGBs) shot up to around 2.95%, the highest reading since September 1996. Rising interest rates on safe government bonds make them an increasingly interesting alternative to the risky stock market. In an environment of rising yields, valuations of tech firms, from which capital is flowing toward “safe havens,” particularly suffer.
3. A weak yen compounds the pain (rising USDJPY) In the currency market, we are observing a weakening of the Japanese currency. The USDJPY exchange rate is rising and approaching the 159.7 level. Usually, a weak yen was welcomed on the Tokyo stock exchange with enthusiasm because it supported the competitiveness of Japanese export giants. However, in the current situation, this phenomenon is a double-edged sword. With the Brent oil price exceeding 91 USD, the depreciating yen drastically raises the costs of imported energy, directly hitting the domestic economy and consumers’ wallets.
4. Weak GDP and waiting for Friday’s inflation Local macroeconomic fundamentals also do not provide reasons for optimism. Yesterday’s data on Japan’s GDP turned out to be rather weak (annualized growth for Q2 at 1.1% vs. expected 2.1% and previous 1.9%), which dampened the enthusiasm for buying stocks and raised concerns about the country’s economic growth pace. Moreover, investors are taking a wait-and-see attitude before Friday’s key inflation reading in Japan. This data could decide the next steps in the central bank’s monetary policy, especially in the context of the aforementioned “imported inflation” and escaping yields. Although an interest rate hike itself is generally negative for the stock market, raising the cost of money now could lead to the end of the yen’s weakness.
5. What to expect next? Today’s plunge on the Nikkei 225 is a classic example of a flight from risk in the face of accumulating problems. After a successful first half of August, the market was susceptible to a correction, and the trigger turned out to be geopolitics and oil, which exposed the weaknesses of the Japanese economy: dependence on raw material imports and pressure related to the most expensive financing cost (JGB yields) in nearly three decades. Increased volatility may persist on the Tokyo stock exchange until Friday’s inflation data.
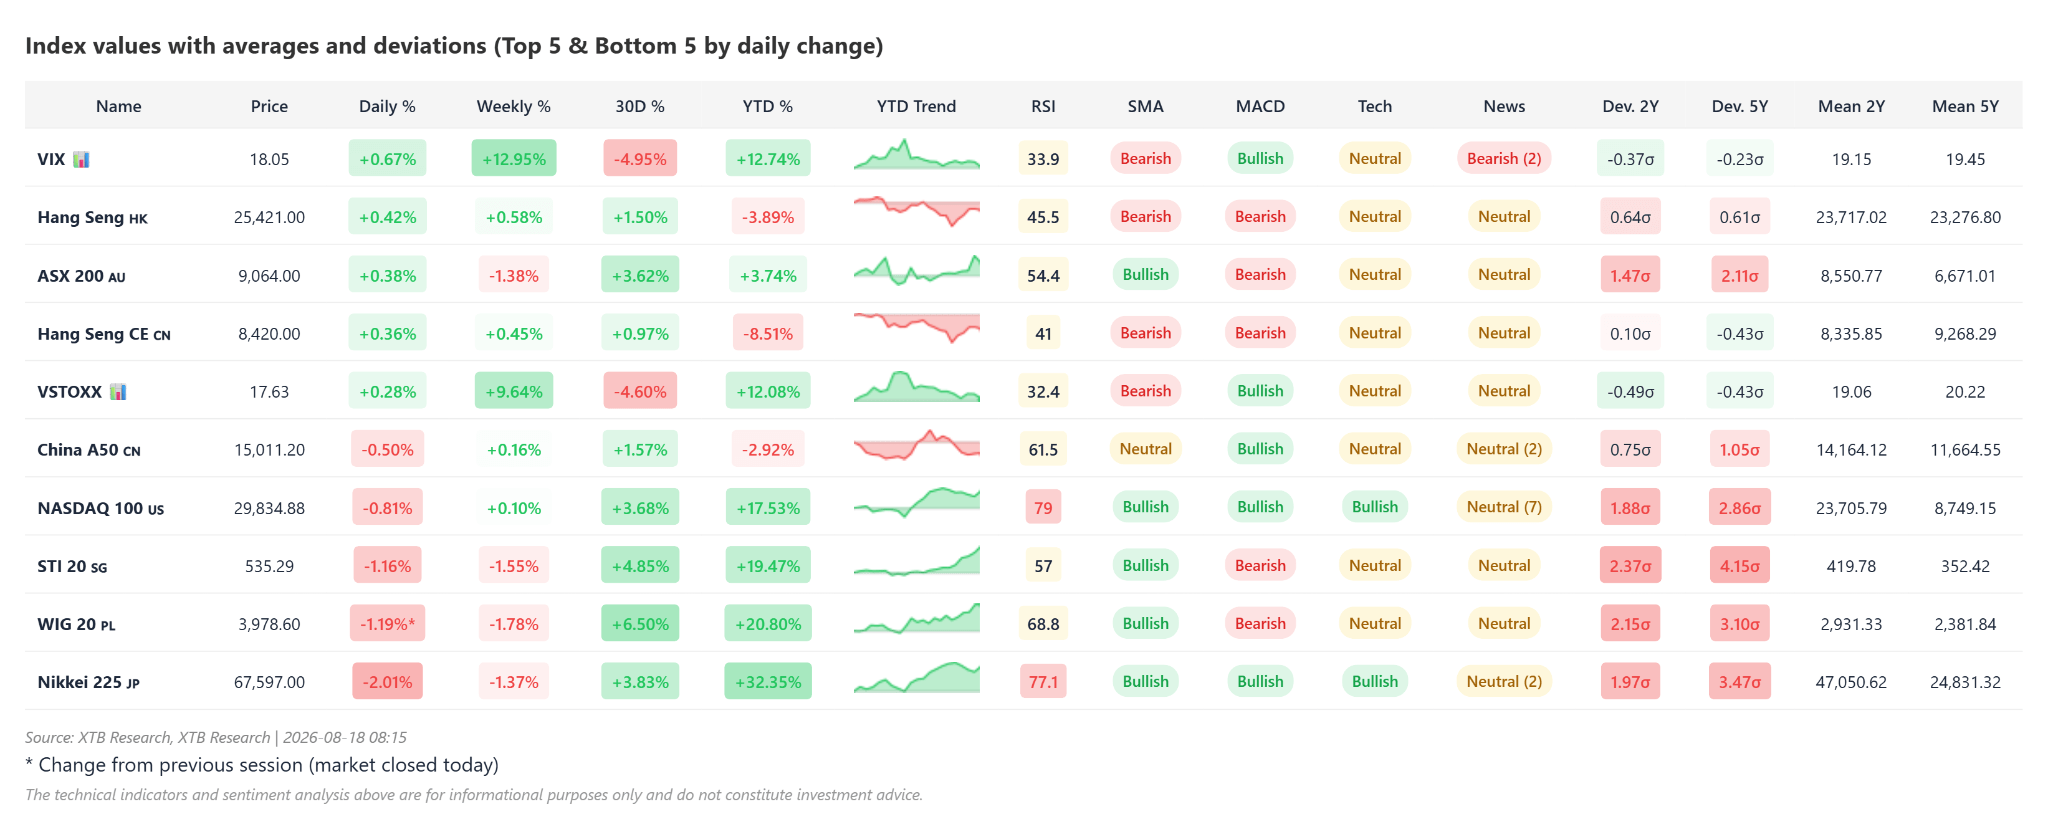
The Nikkei 225 contract is the worst-performing index-based instrument today. Although technically the index still looks positive in the medium term, it simultaneously remains quite heavily overbought relative to the 2 and 5-year averages. The RSI indicator is in the overbought zone. Source: XTB