





Gold prices fell by more than 4% on Monday, breaking through key support levels and dropping below the $4,200-per-ounce mark to their lowest level in nearly two months. The sell-off in the precious metals market is the result of cumulative pressure from rising U.S. Treasury yields and resurgent inflation fears fueled by a spike in oil prices. Following gold’s lead, other precious metals fell sharply—silver lost as much as 4.97%, dropping to $61.03 per ounce.
Debt and oil are hitting non-income-generating assets
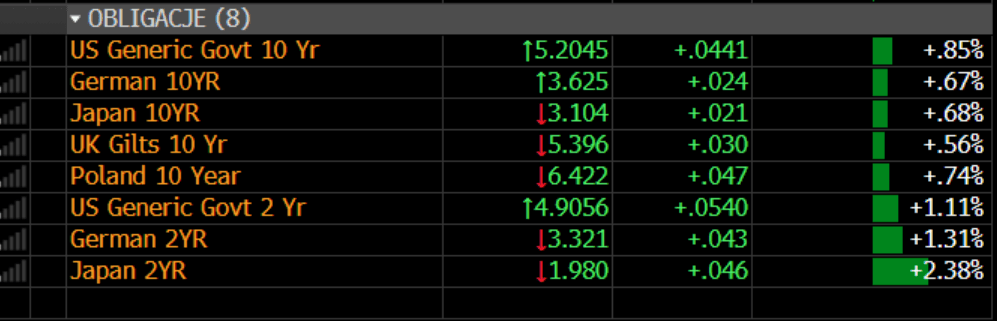
The situation in the bond market remains the main factor driving precious metal prices lower. The yield on 10-year U.S. Treasury bonds rose on Monday to 5.2045% (+0.85%), remaining near its highest levels since 2007. The yield on 2-year Treasuries, meanwhile, jumped by 1.11% to 4.9056%. Rising risk-free rates are drastically increasing the opportunity cost of holding gold, which generates neither interest nor dividends. Source: Bloomberg Financial Lp Rising energy prices are putting pressure on the bond market. The White House’s rejection of Iran’s proposal to resume traffic through the Strait of Hormuz and end the fighting has led to another spike in oil prices—WTI is up 2.20% today (at $94.46 per barrel), while Brent is up 1.89% to $99.24. Rising oil prices are affecting expectations regarding the Federal Reserve’s monetary policy. Investors fear that higher energy costs will entrench price pressures in the U.S. economy, forcing the Fed to continue its tightening cycle. Markets are currently pricing in a nearly 68 percent probability of another interest rate hike at the October meeting.
Technical Breakout: The Path to $4,000 Is Clear
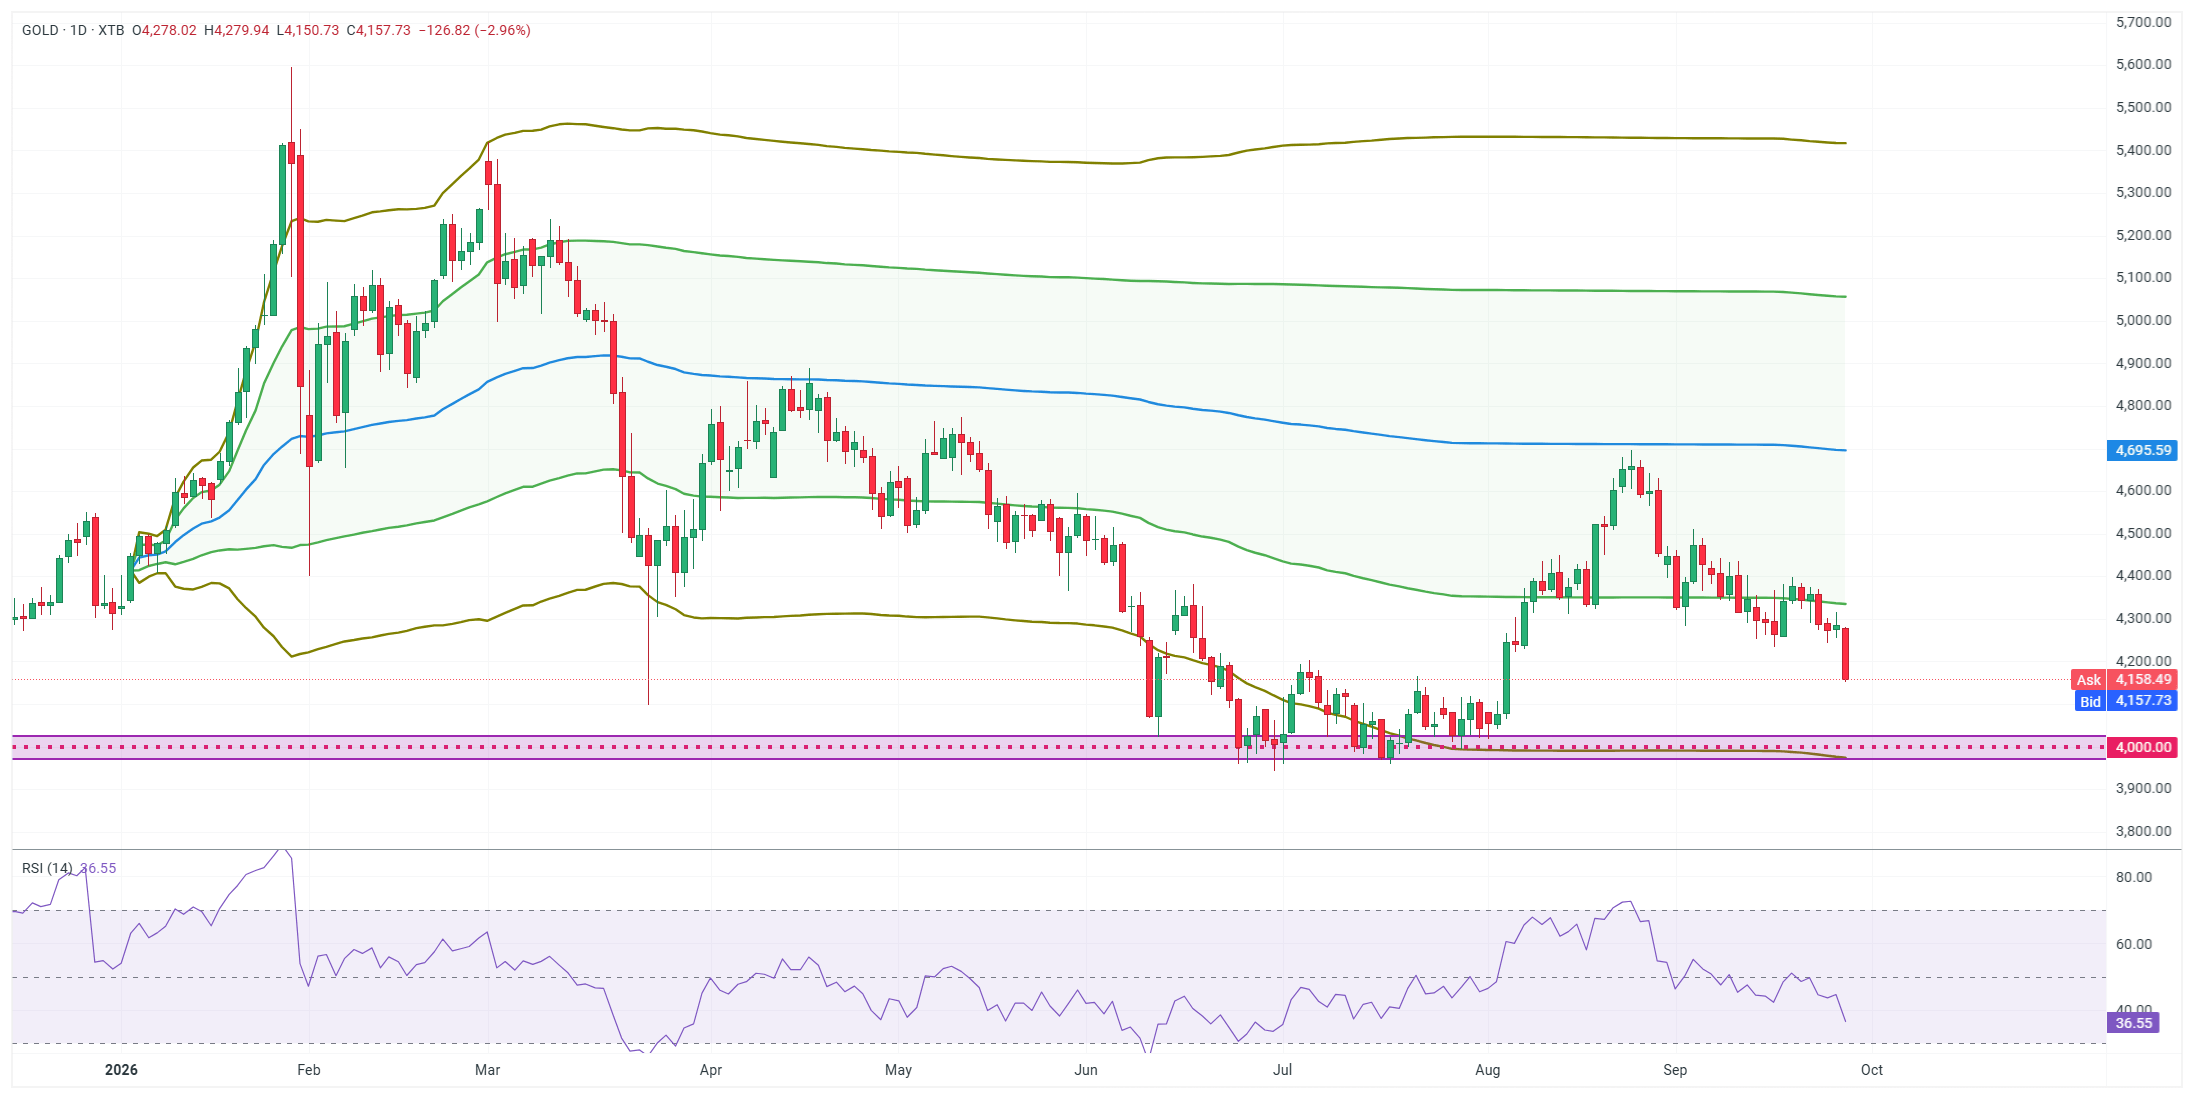
From a technical analysis perspective, Monday’s decline caused significant damage to the market structure. Over the past two weeks, gold prices had been consolidating in the $4,240–$4,400 range, and the $4,240 level—which coincided with the 1-standard-deviation retracement of the anchored VWAP since the beginning of 2026—had been effectively defended by buyers. The eventual break below this level triggered a wave of stop-loss orders and accelerated the sell-off. The Relative Strength Index (RSI) on the daily chart has fallen to 36.55 points, signaling a growing advantage for sellers. At this stage, there are no significant technical barriers to further declines, which opens the way for bears to test the key psychological support zone at $4,000 per ounce. Any potential rebound would require buyers to quickly return above $4,240 and then break through strong resistance in the $4,300–$4,330 range. However, as long as bond yields continue to rise, a possible (hypothetical) downward move remains the path of least resistance for the gold market.