





Key takeaways
- Silver prices hover near 53 USD per ounce, entering oversold territory with an RSI close to 30.
- Gold prices trade near 4 000 USD per ounce amid strong US dollar pressure and high real yields.
- Crude oil prices fluctuate around 101 USD per barrel supported by strong medium-term uptrends and geopolitical risk premiums.
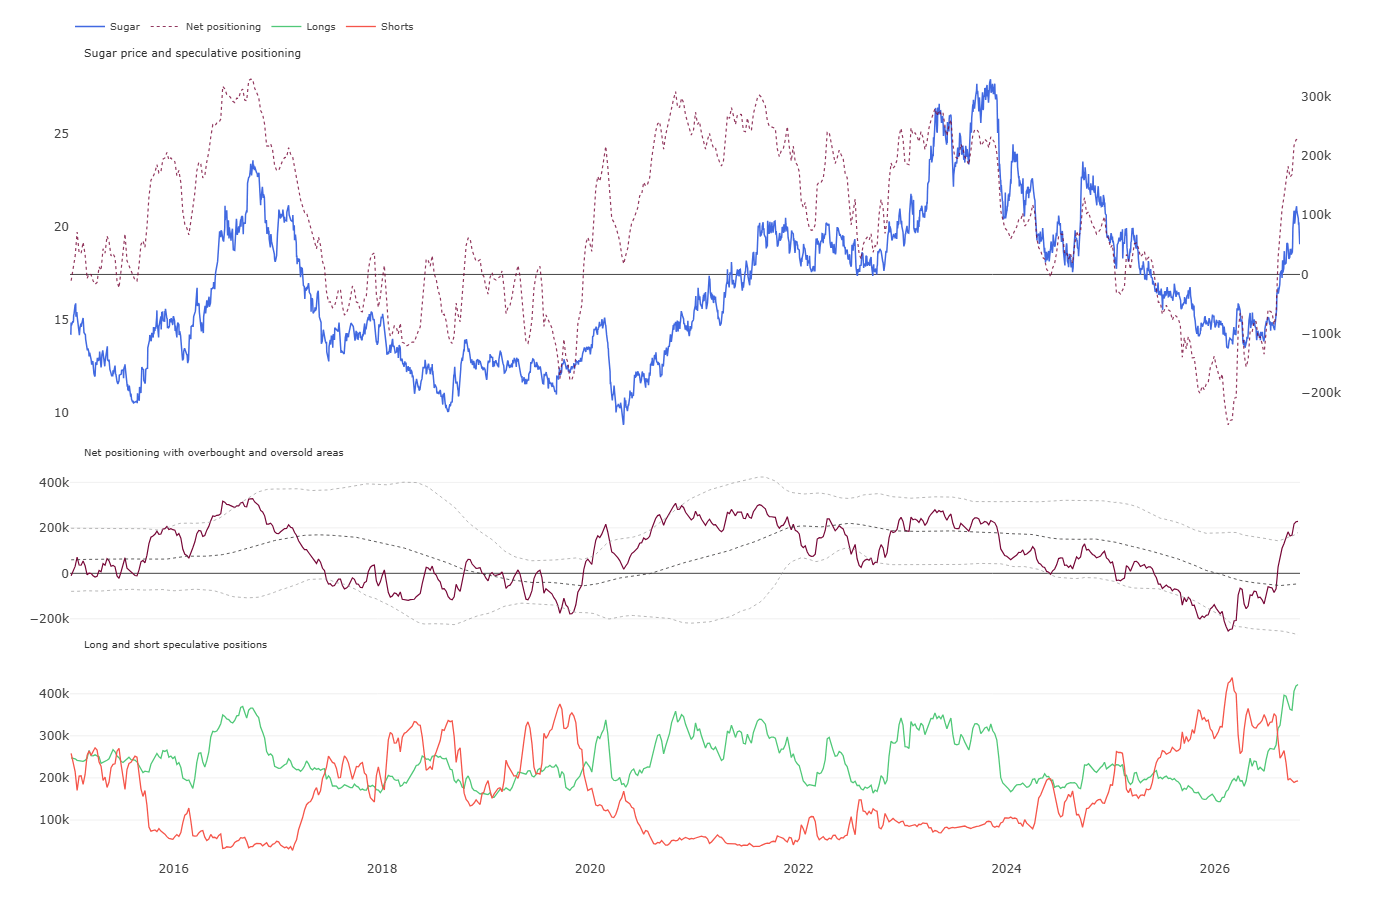
- Sugar prices oscillate near 19 cents per pound while speculative funds maintain high long positioning at the 92nd historical percentile.
Silver
Technical Analysis
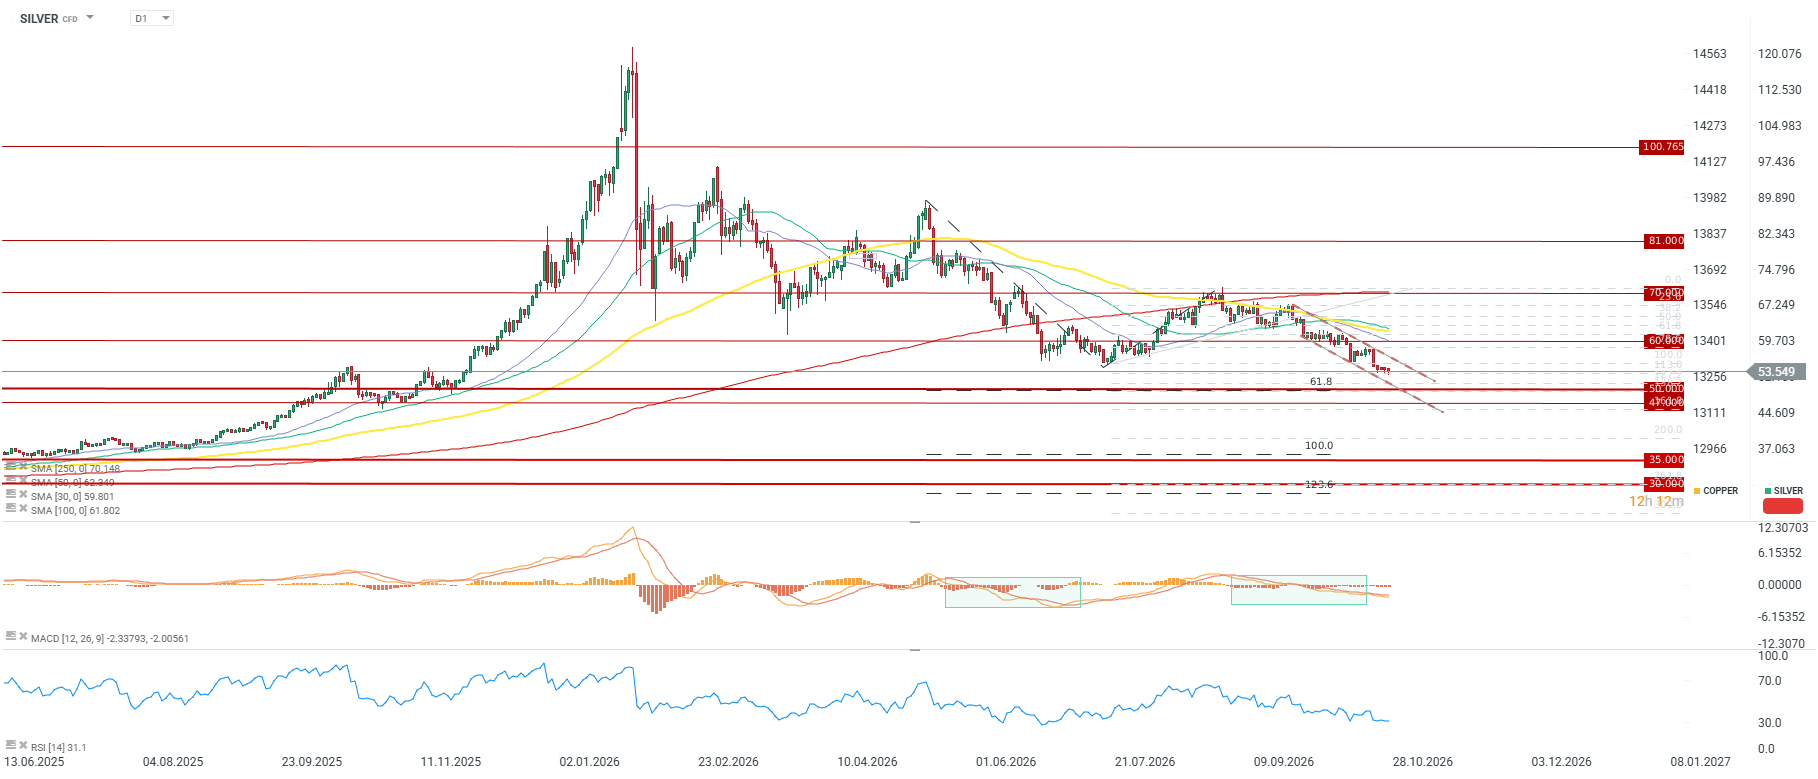
- Silver prices hover around USD 53 per ounce, losing 8.2% on a weekly basis, 17.2% monthly, and 26.7% year-to-date, while maintaining an annual gain of 13.3%.
- The RSI indicator reached a level close to 30 points, indicating that the market has entered oversold territory and may favor a slowing down of declines.
- The MACD indicator and the moving average structure generate clearly bearish signals, with the price standing as much as 14.7% below the 50-session moving average.
- The nearest key support zone extends around the psychological USD 50 level, while the first significant technical resistance lies in the USD 56–58 area.
- Around the USD 50 level lies the 61.8 Fibo expansion from the previous major downward impulse.
Fundamental and Market Context
- The price of silver dropped towards USD 53 per ounce, approaching annual lows under pressure from a stronger US dollar.
- The filing of an IPO prospectus by Anthropic sparked a wave of demand for US AI-related tech assets, supporting the US currency’s appreciation. Events like IPOs, high valuations, and sharp declines in tech companies like Meta drain liquidity from the market.
- The gold-to-silver price ratio expanded to 76 recently, pointing to relative undervaluation of the white metal. On the other hand, there is a chance of approaching 80 points, which at USD 4,000 for gold would yield a silver valuation of USD 50 per ounce.
- The Federal Reserve maintains the benchmark rate range at 3.75%–4.00%, with the market pricing in a 90% probability of no change at the current meeting.
- The yield on 10-year US Inflation-Protected Treasury Securities (TIPS) rose near 2.5%, drastically increasing the opportunity cost of holding the non-yielding metal.
- Technological and industrial demand for silver receives steady support from investments in expanding physical AI data center infrastructure.
- Global mine supply of silver rose year-on-year by just 2% due to long lead times for bringing new mining projects online.
- Secondary recycled supply has slowed down as scrap holders hold back sales in anticipation of higher valuations.
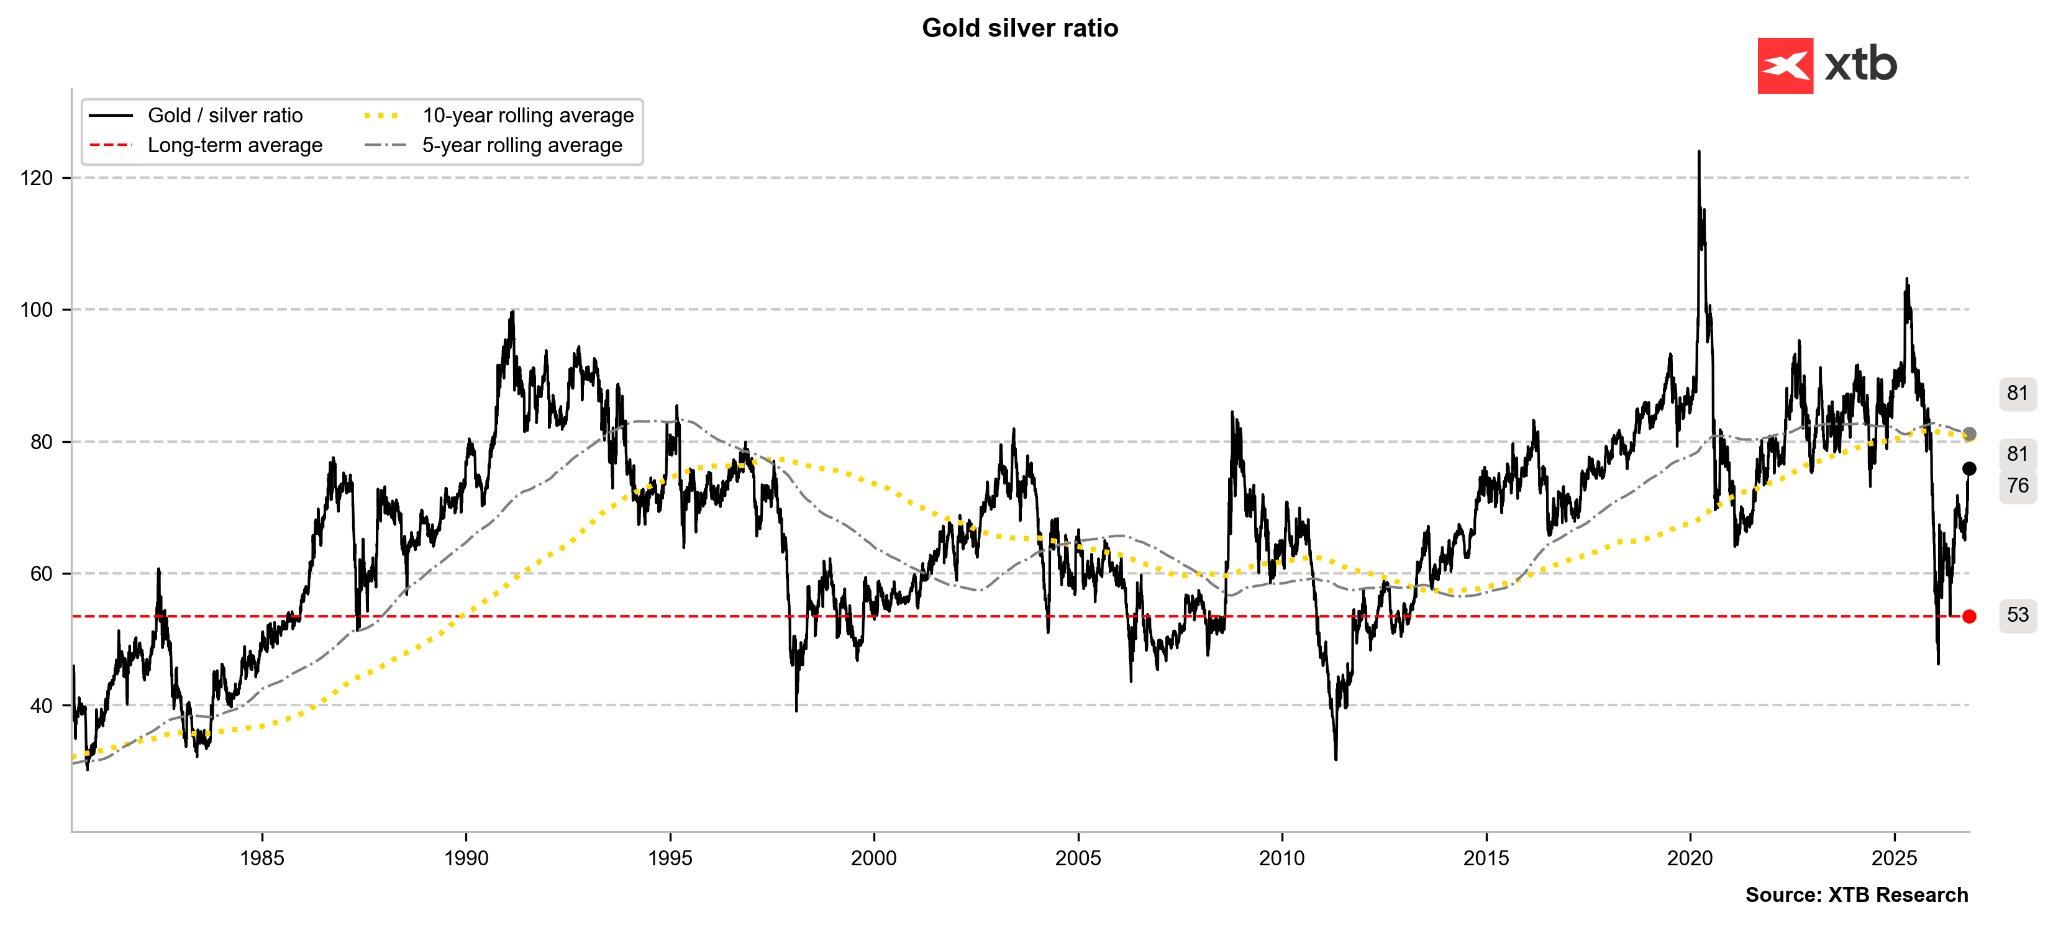
The gold-to-silver price ratio continues to rise toward the 5-year and 10-year averages. Source: Bloomberg Finance LP, XTB
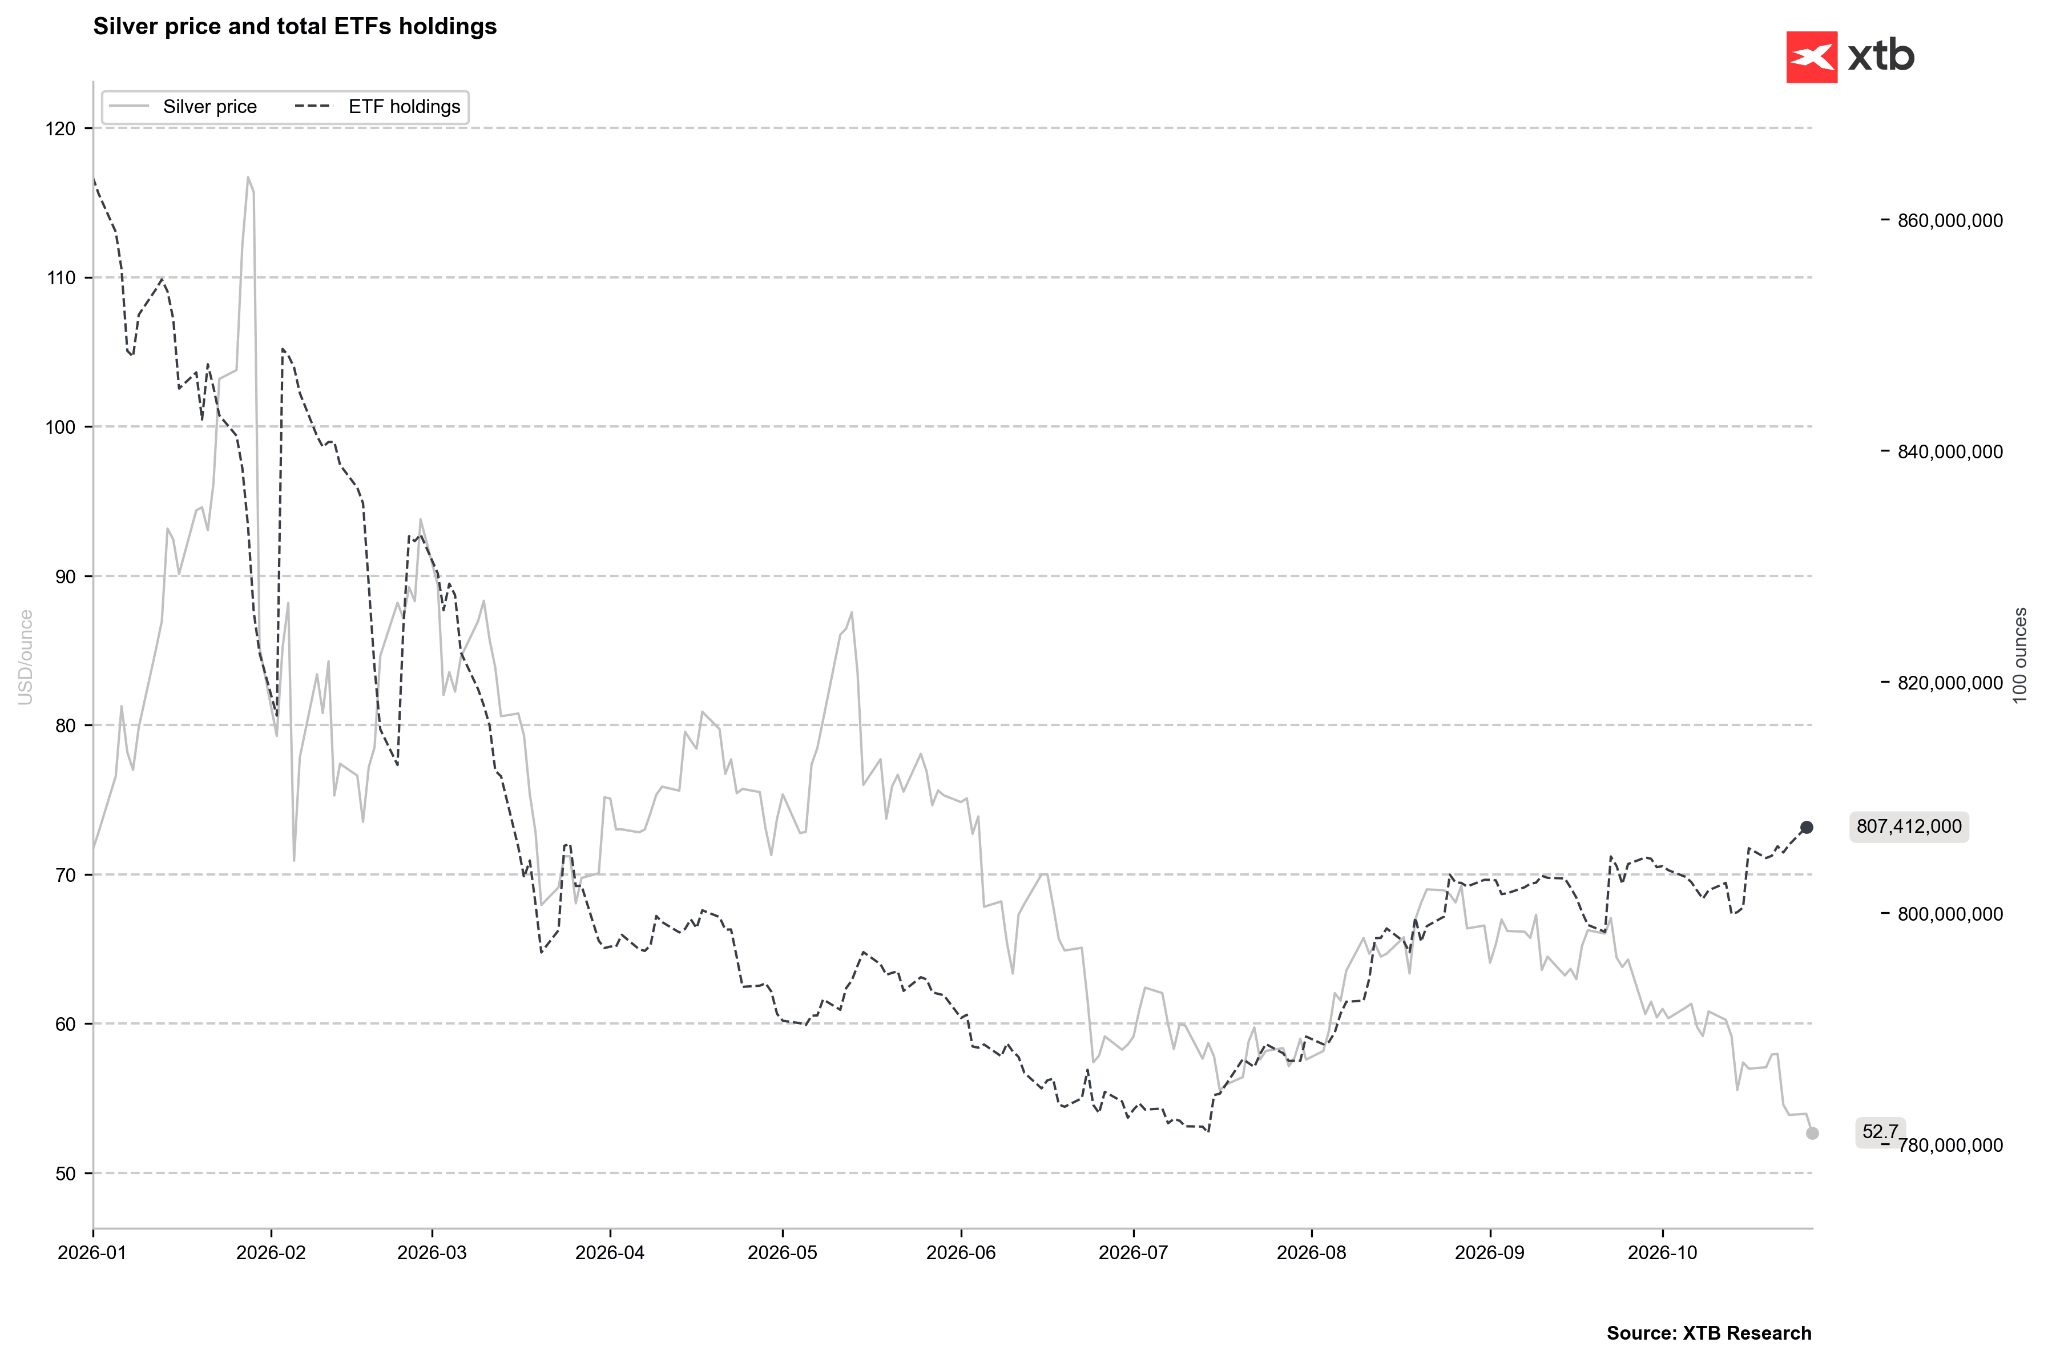
The sell-off in silver is not matched by ETF holdings behavior, showing that the current decline in silver prices may lack long-term fundamentals. On the other hand, if ETFs join the sell-off, declines may not stop at USD 50 per ounce. Source: Bloomberg Finance LP, XTB
Historical Valuation and Fund Positioning
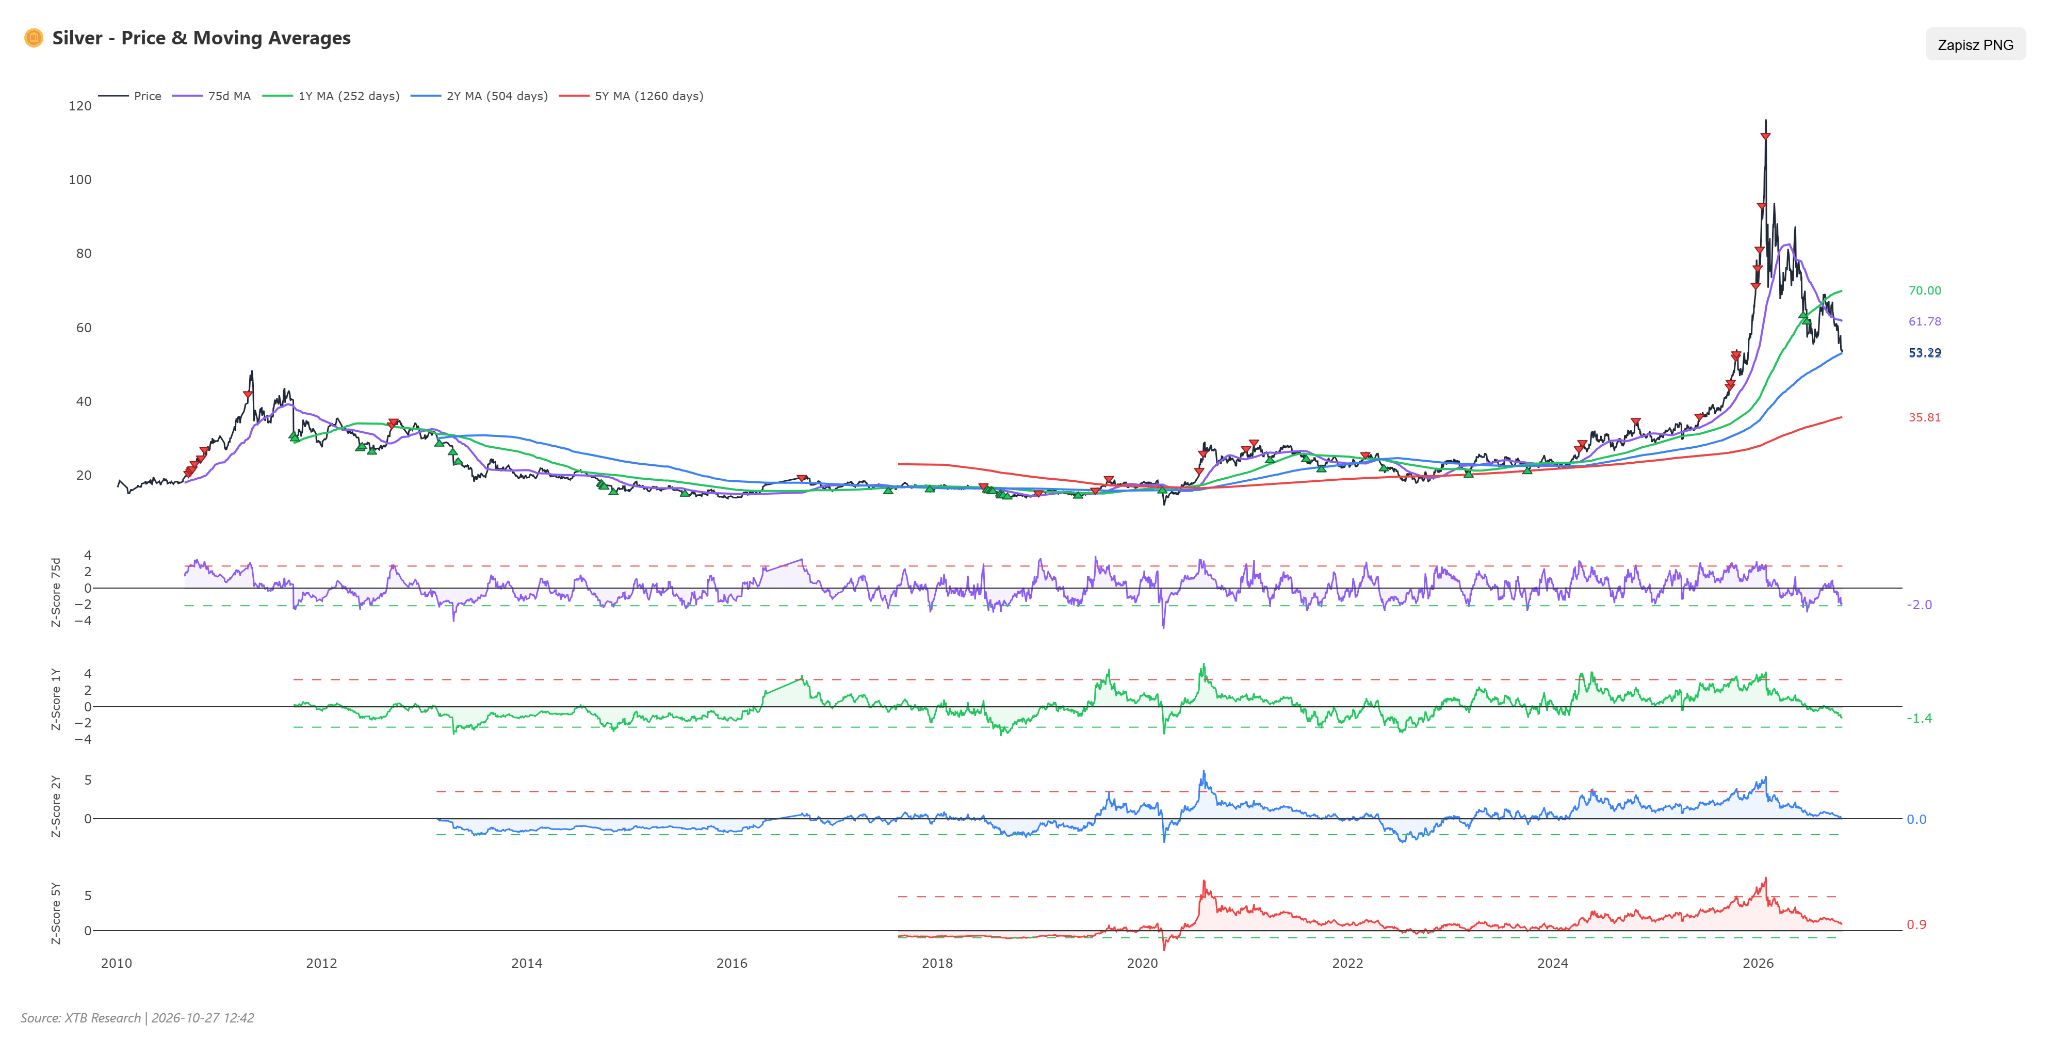
Relative to the two-year average, silver valuation has returned exactly to the multi-year norm, but on a one-year horizon the metal is valued distinctly below typical levels (over 1.3 standard deviations below the mean). At the same time, over a five-year horizon, prices still sit moderately above the long-term average. Six months ago, the valuation premium on silver was very high, but in recent quarters and months it has systematically eroded alongside the ongoing exchange sell-off. It is worth noting that in the event of further declines, there is a possibility of generating an undervaluation signal relative to the 3-month average, where the deviation currently stands at 2.
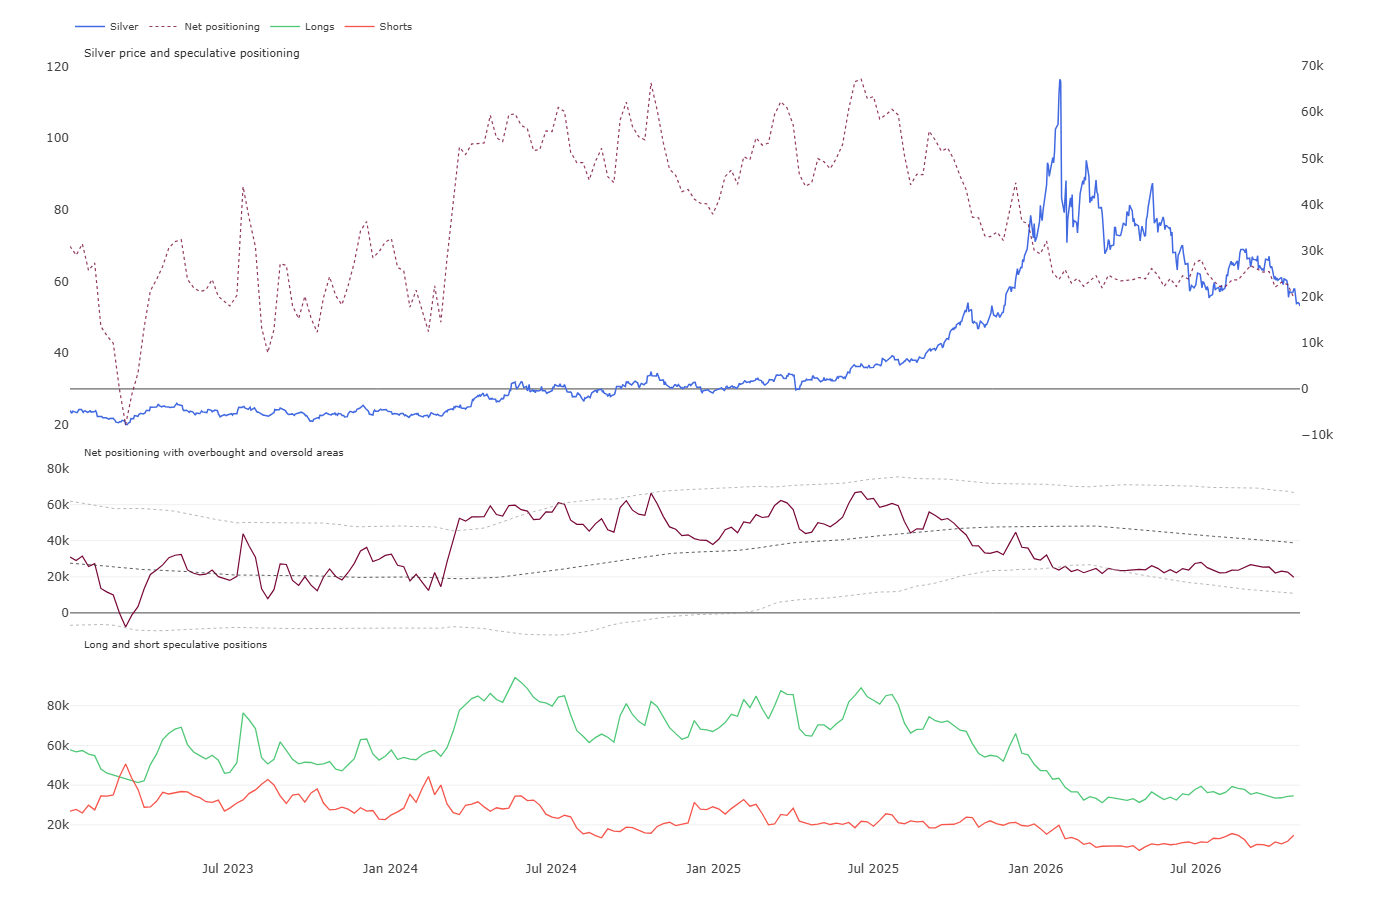
Speculative funds continue to reduce positions in the futures market. Their net positive exposure currently stands at around 20k contracts after investors closed over 2.8k positions in the past week. The deviation of fund engagement from the two-year norm is negative, and a historical percentile near 35% shows that speculative capital has rarely approached this market with such caution in recent years, despite long positions still making up 70.1% of their portfolio. Such conservative positioning confirms the dominant downtrend, but given technical oversold conditions, it limits room for further sell-offs and increases the risk of a dynamic upward correction during potential short covering.
Scenarios
- Bullish scenario: Generating a demand impulse requires a dovish shift in Fed rhetoric, combined with a decline in 10-year TIPS yields below 2.3% and an inflow of new industrial orders from the AI infrastructure sector. Technical confirmation of an end to the sell-off wave will be a sustained return of prices above the resistance zone around USD 56, opening the way for a rebound toward USD 62–65 per ounce.
- Bearish scenario: Maintaining a hawkish tone by the Federal Reserve, a higher-than-projected PCE reading heightening fears of a December rate hike, and further US dollar strengthening could intensify capital outflows from the market. Breaking below the key support zone around USD 50 will trigger another wave of sell-offs with a target drop range of USD 45–47 per ounce.
Gold
Technical Analysis
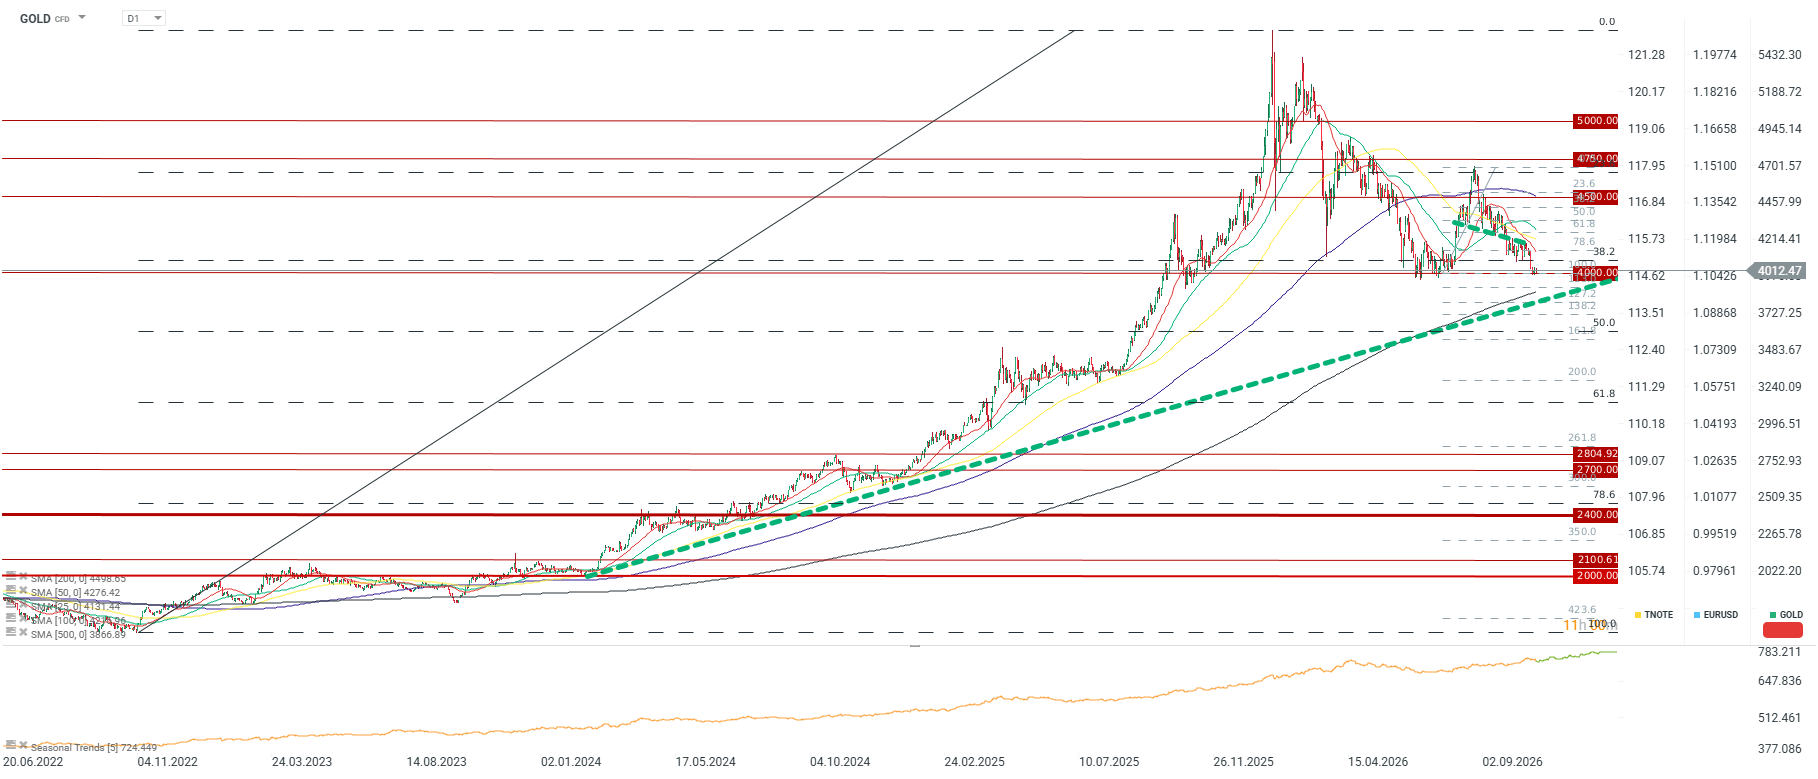
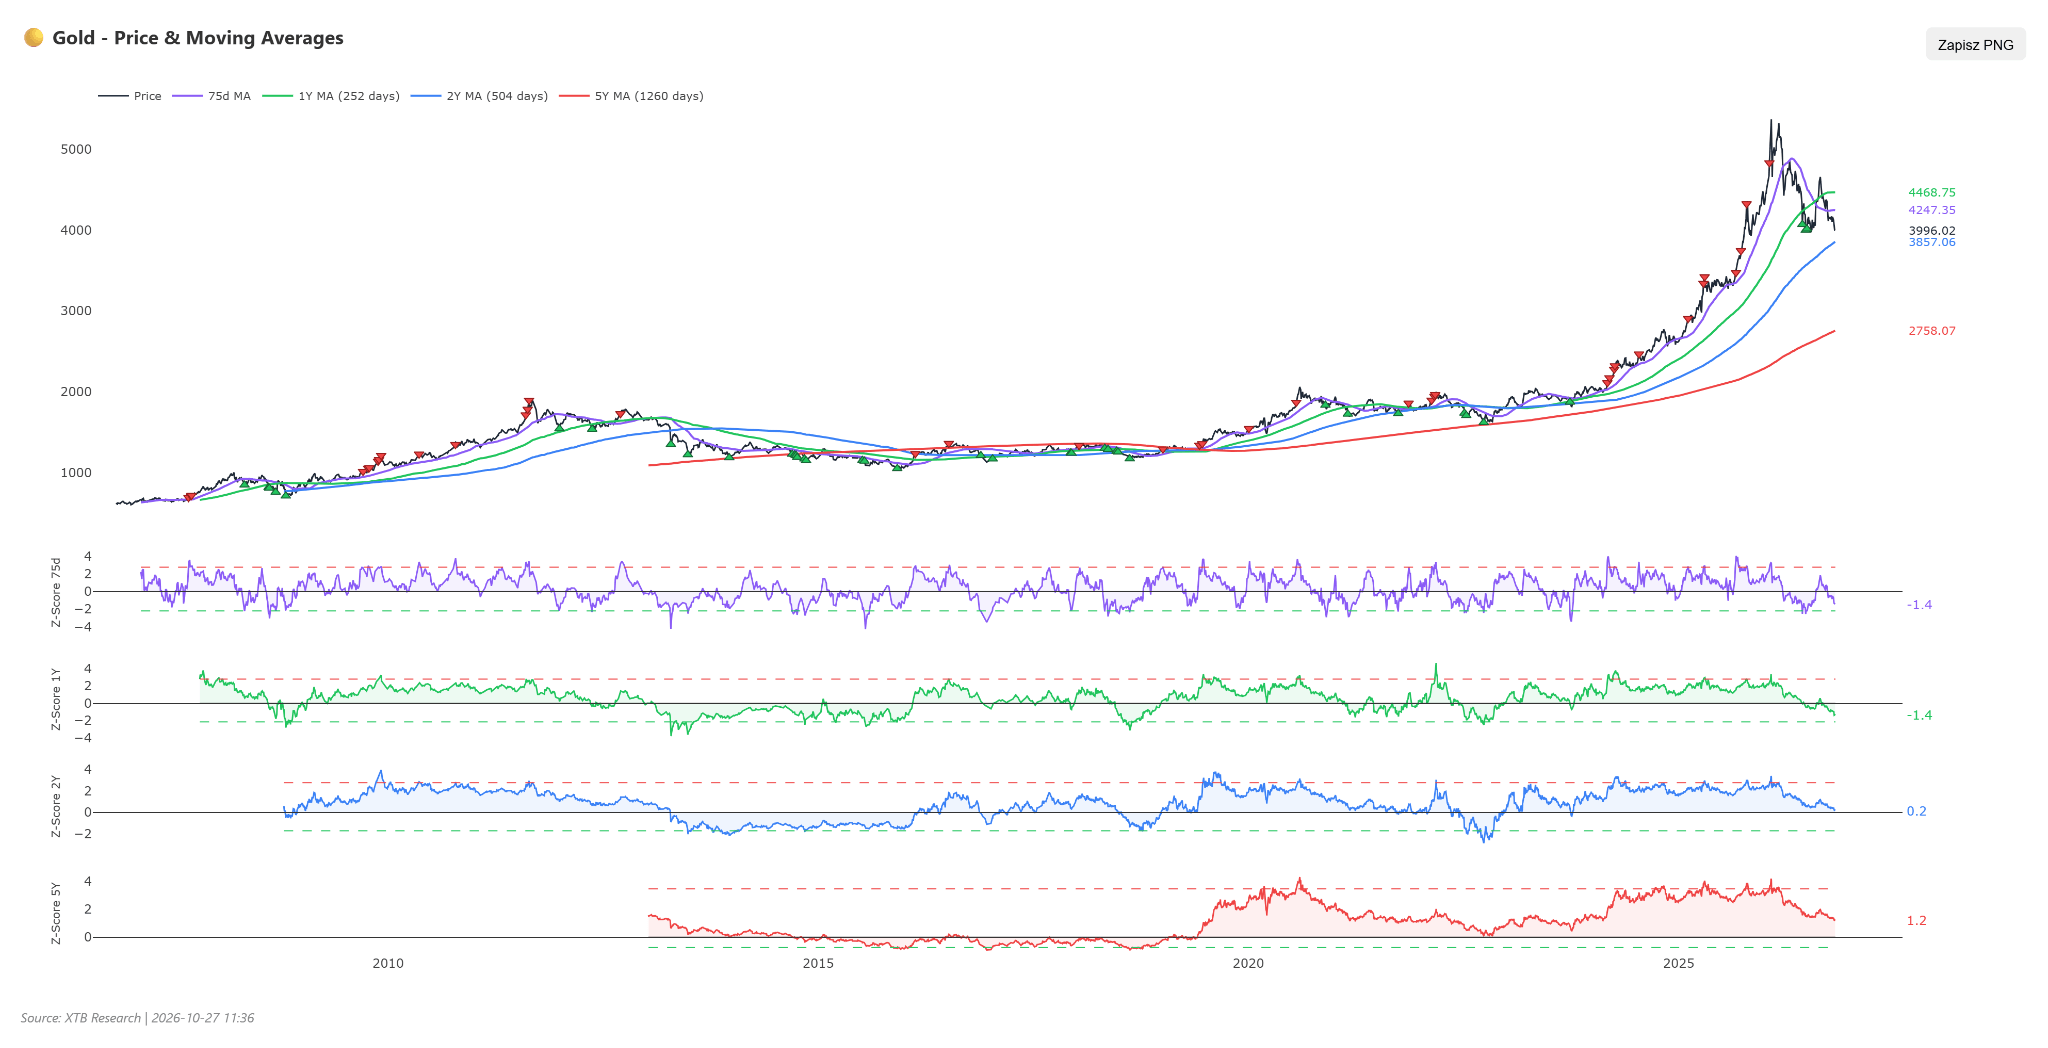
- Gold prices hover near USD 4,000 per ounce, losing 3.1% weekly, 6.7% monthly, and 7.7% YTD, although over a twelve-month horizon the metal maintains a modest gain of 1.6%.
- The RSI indicator stands at 34 points, meaning the market is approaching the oversold zone but has not fully entered it yet.
- Moving averages and the MACD indicator generate clear bearish signals, and the price stands 6.5% below its 50-session moving average, confirming seller dominance in the medium term.
- The nearest key support zone lies around USD 3,950–4,000, while technical resistance is found in the USD 4,100–4,150 area, followed by another band at USD 4,250–4,300.
- A sustained move below USD 4,000 risks a decline towards the trend line drawn from the 2024 lows and the 500-session moving average.
- The 50.0 retracement of the entire uptrend since 2022 falls around USD 3,600.
Fundamental and Market Context
- The Federal Reserve led by Kevin Warsh will most likely keep interest rates in the 3.75%–4.00% range, but hawkish rhetoric and market-priced probability of another hike in December strengthen the US dollar.
- The yield on 10-year US Treasury bonds dropped from recent levels around 5.3% to below 5%, but this is connected with market hedging against inflation risks. Real yields on TIPS securities reach 2.3-2.5%, drastically increasing the opportunity cost of holding non-yielding metal.
- Primary mine supply globally rose year-on-year by just 2% due to long investment cycles, while recycled supply slowed as scrap holders await higher prices.
- Capital outflows in recent sessions from Western ETFs raise questions about the validity of support around USD 4,000.
- The Central Bank of Russia reduced official bullion reserves to 2,282.98 tons from 2,304.75 tons.
- The National Bank of Kazakhstan reallocated reserves, liquidating part of its gold in favor of liquid dollar assets to rebalance its balance sheet.
- OCBC analysts indicate that a potential gold price rebound remains uncertain due to the ongoing deleveraging process in commodities markets.
- European asset manager Amundi considers the sell-off phase over and forecasts a return of prices towards USD 4,500 per ounce.
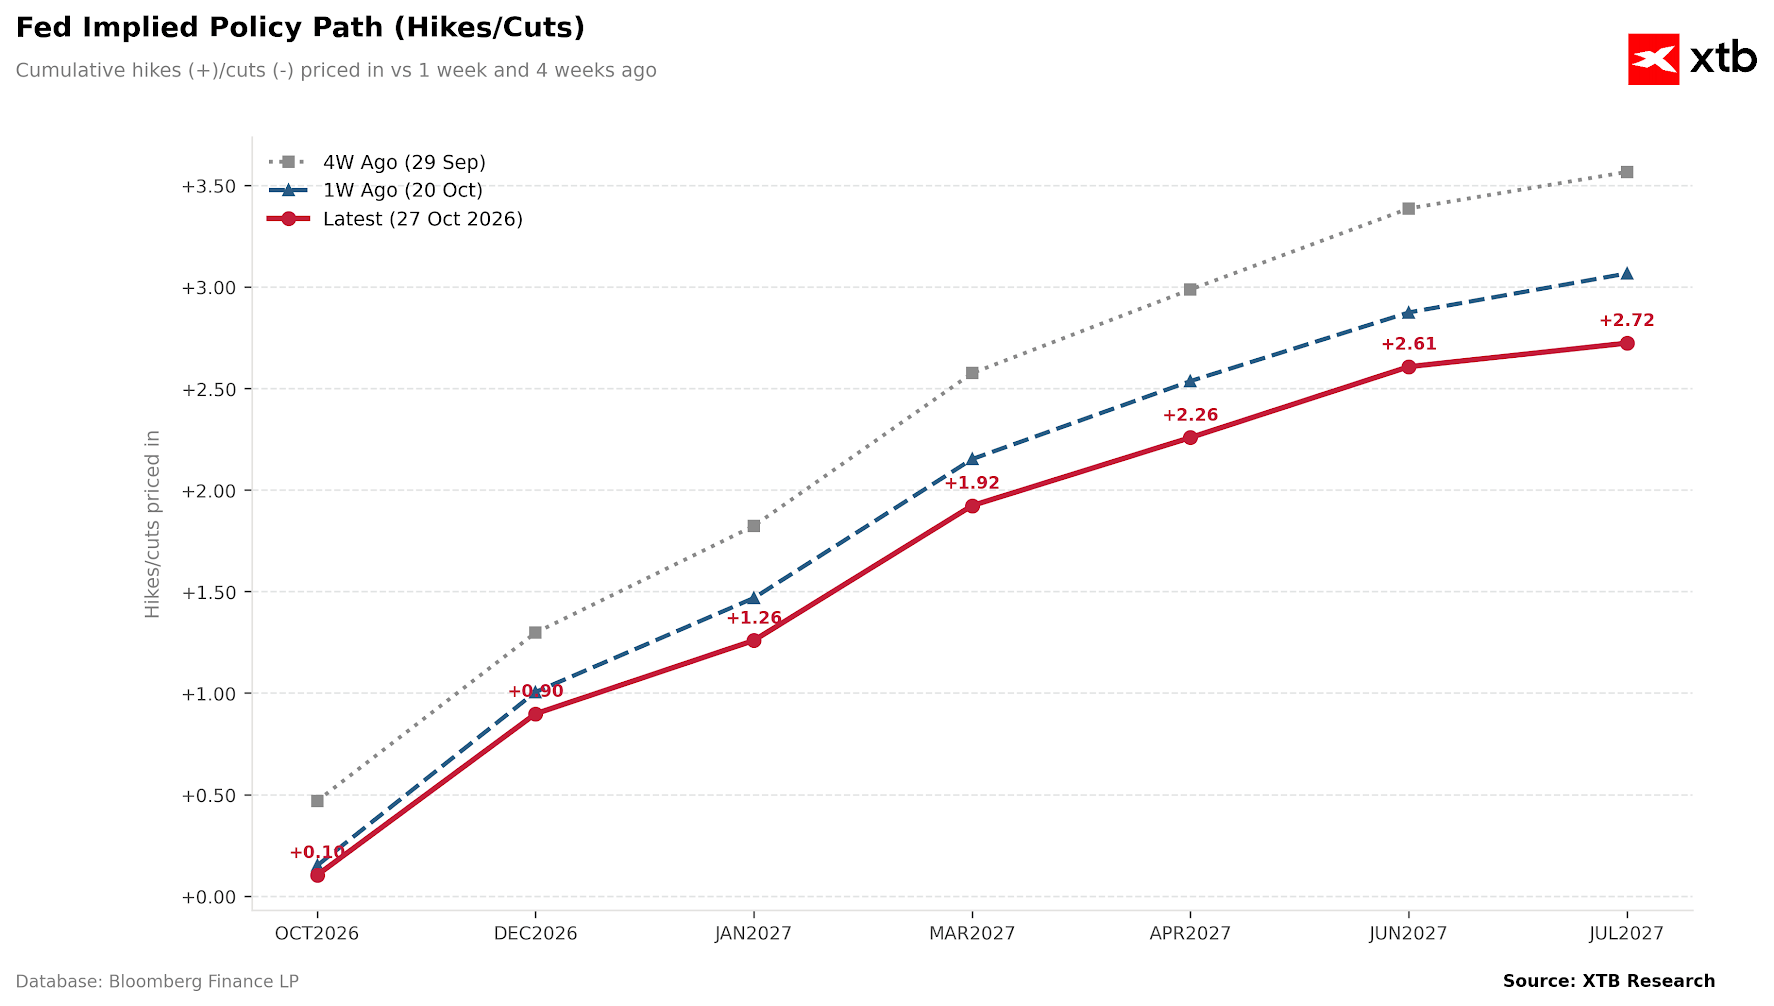
The market does not indicate high chances of a rate hike in October. Investors lowered their rate hike expectations slightly in recent weeks. Nonetheless, any hawkish surprise could lead to another wave of rising yields. Source: Bloomberg Finance LP, XTB
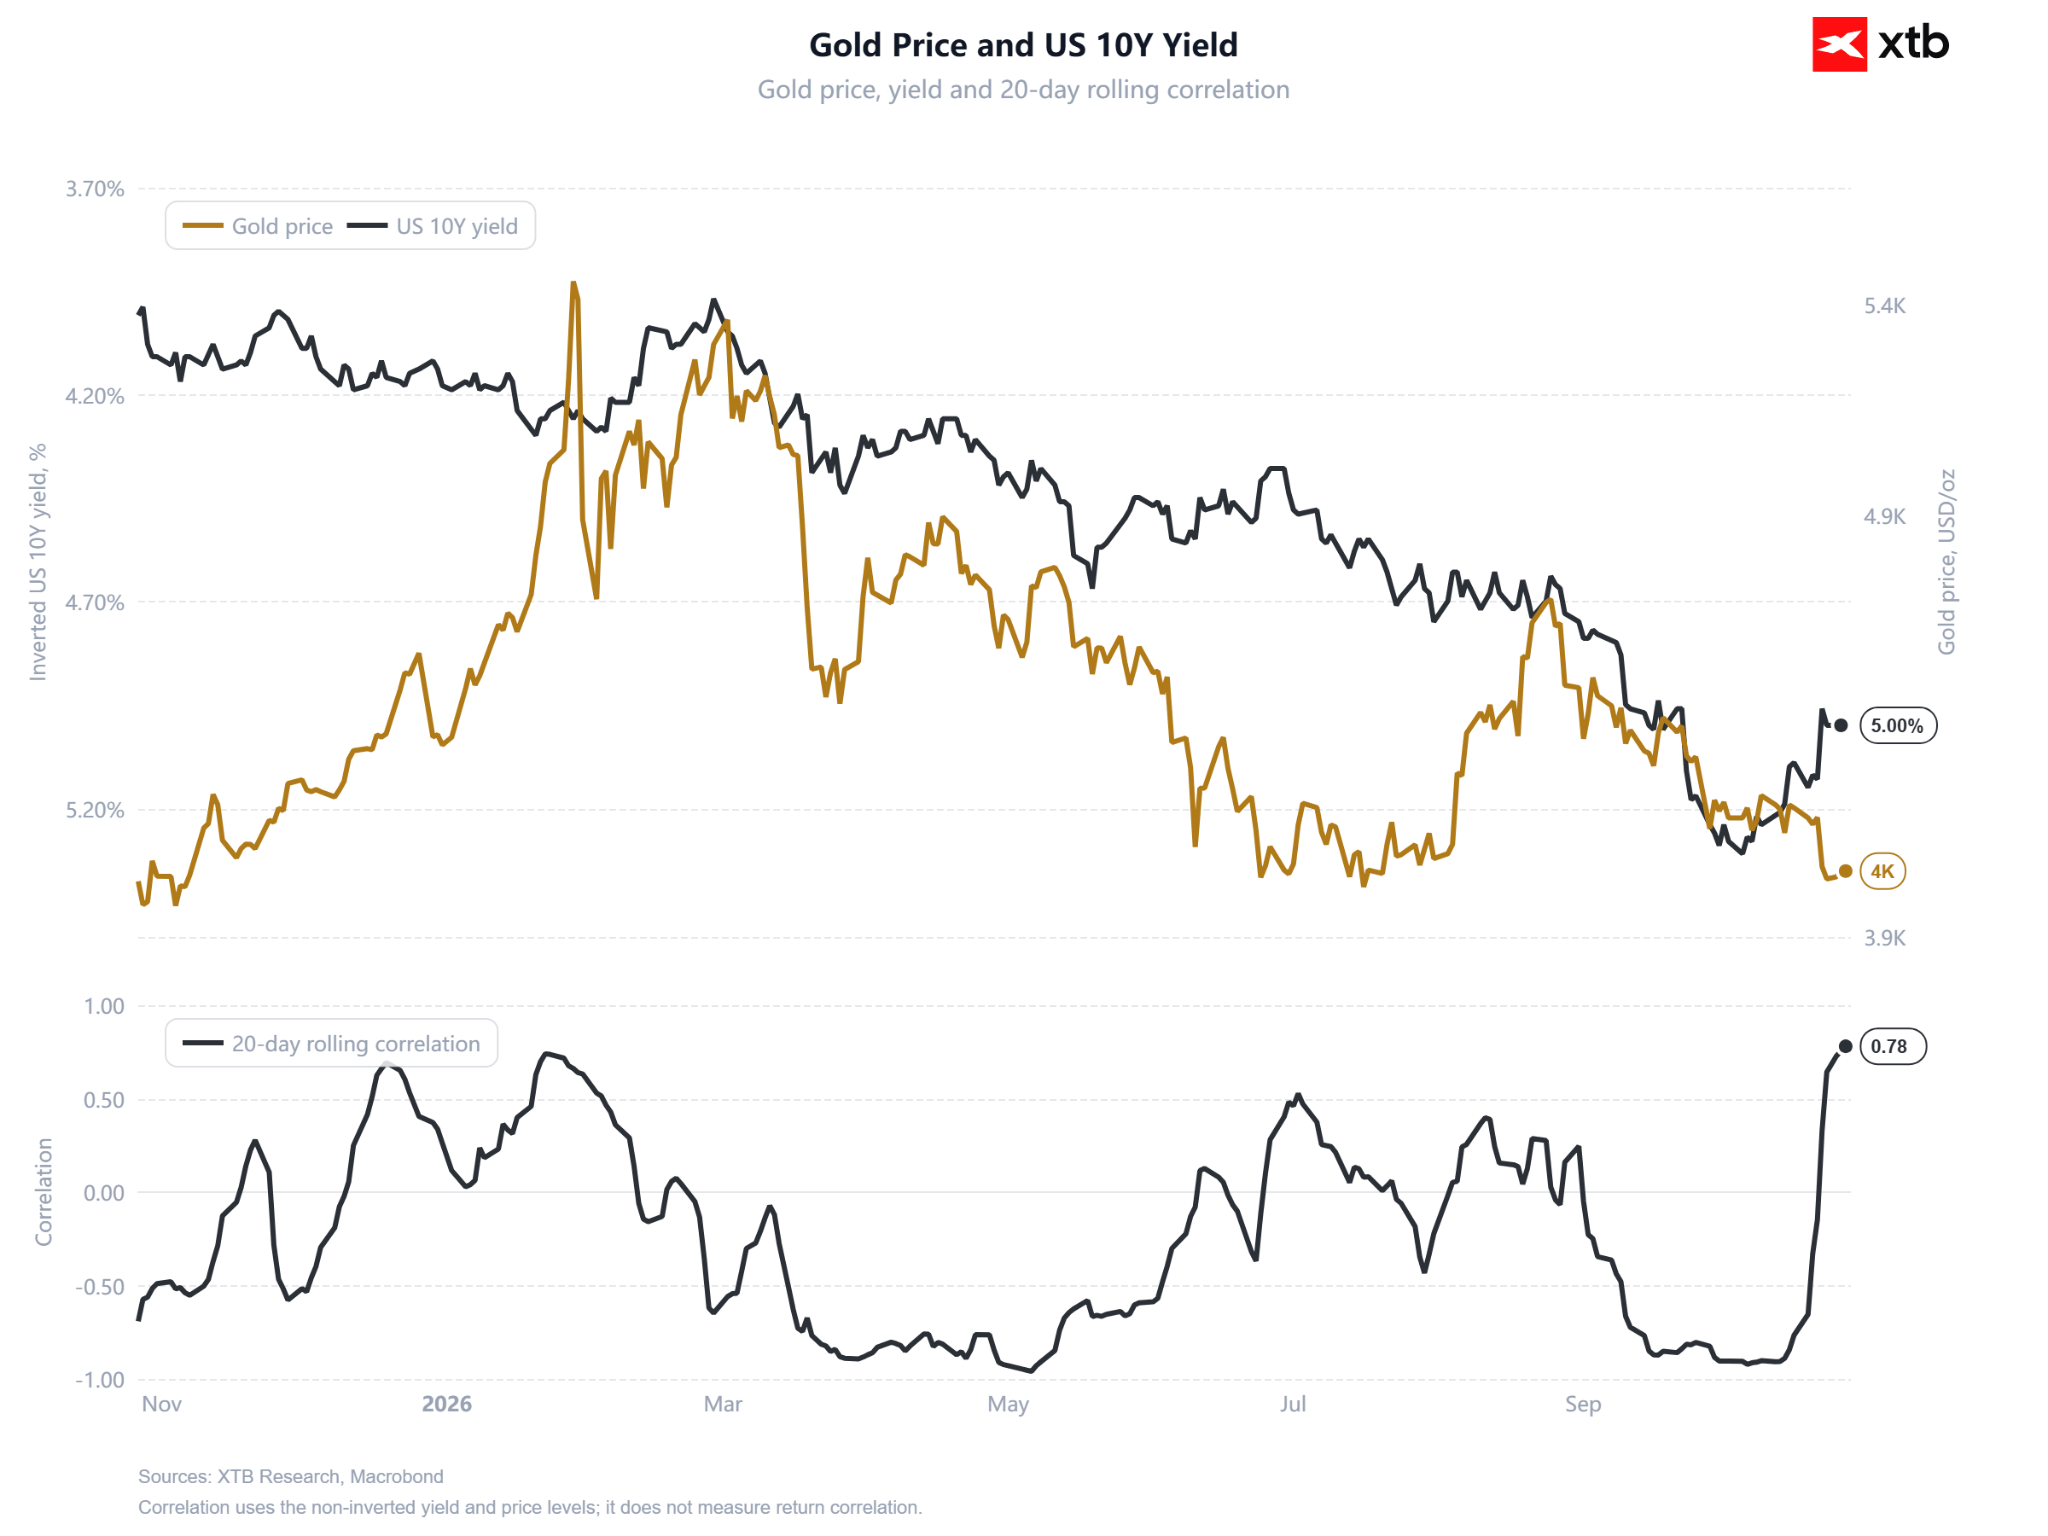
Bond yields have fallen recently, but this did not lead to a gold price rebound, unlike what occurred in May. Source: Macrobond, XTB
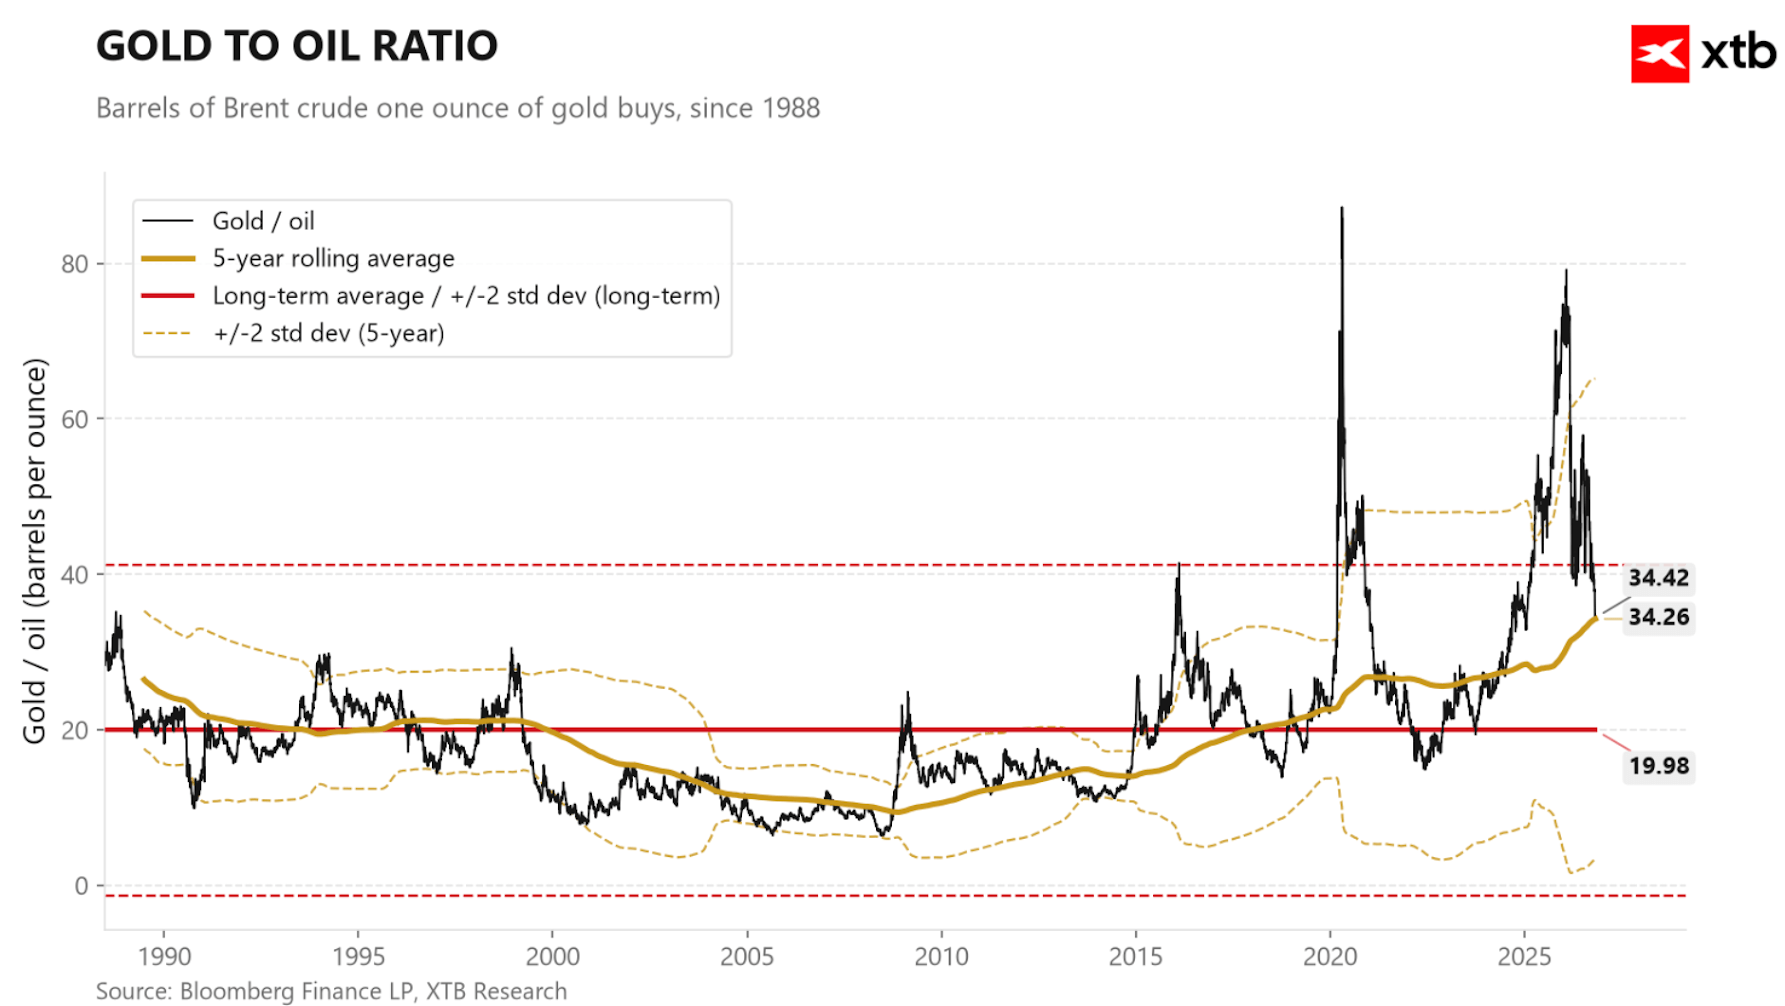
The gold-to-oil price ratio is falling near the 5-year average. This may indicate that gold is no longer extremely expensive. On the other hand, during such moves, we typically observed dips below the average. If the ratio were to fall to 30 points, then with oil at USD 120, gold would be valued at USD 3,600. Source: Bloomberg Finance, XTB
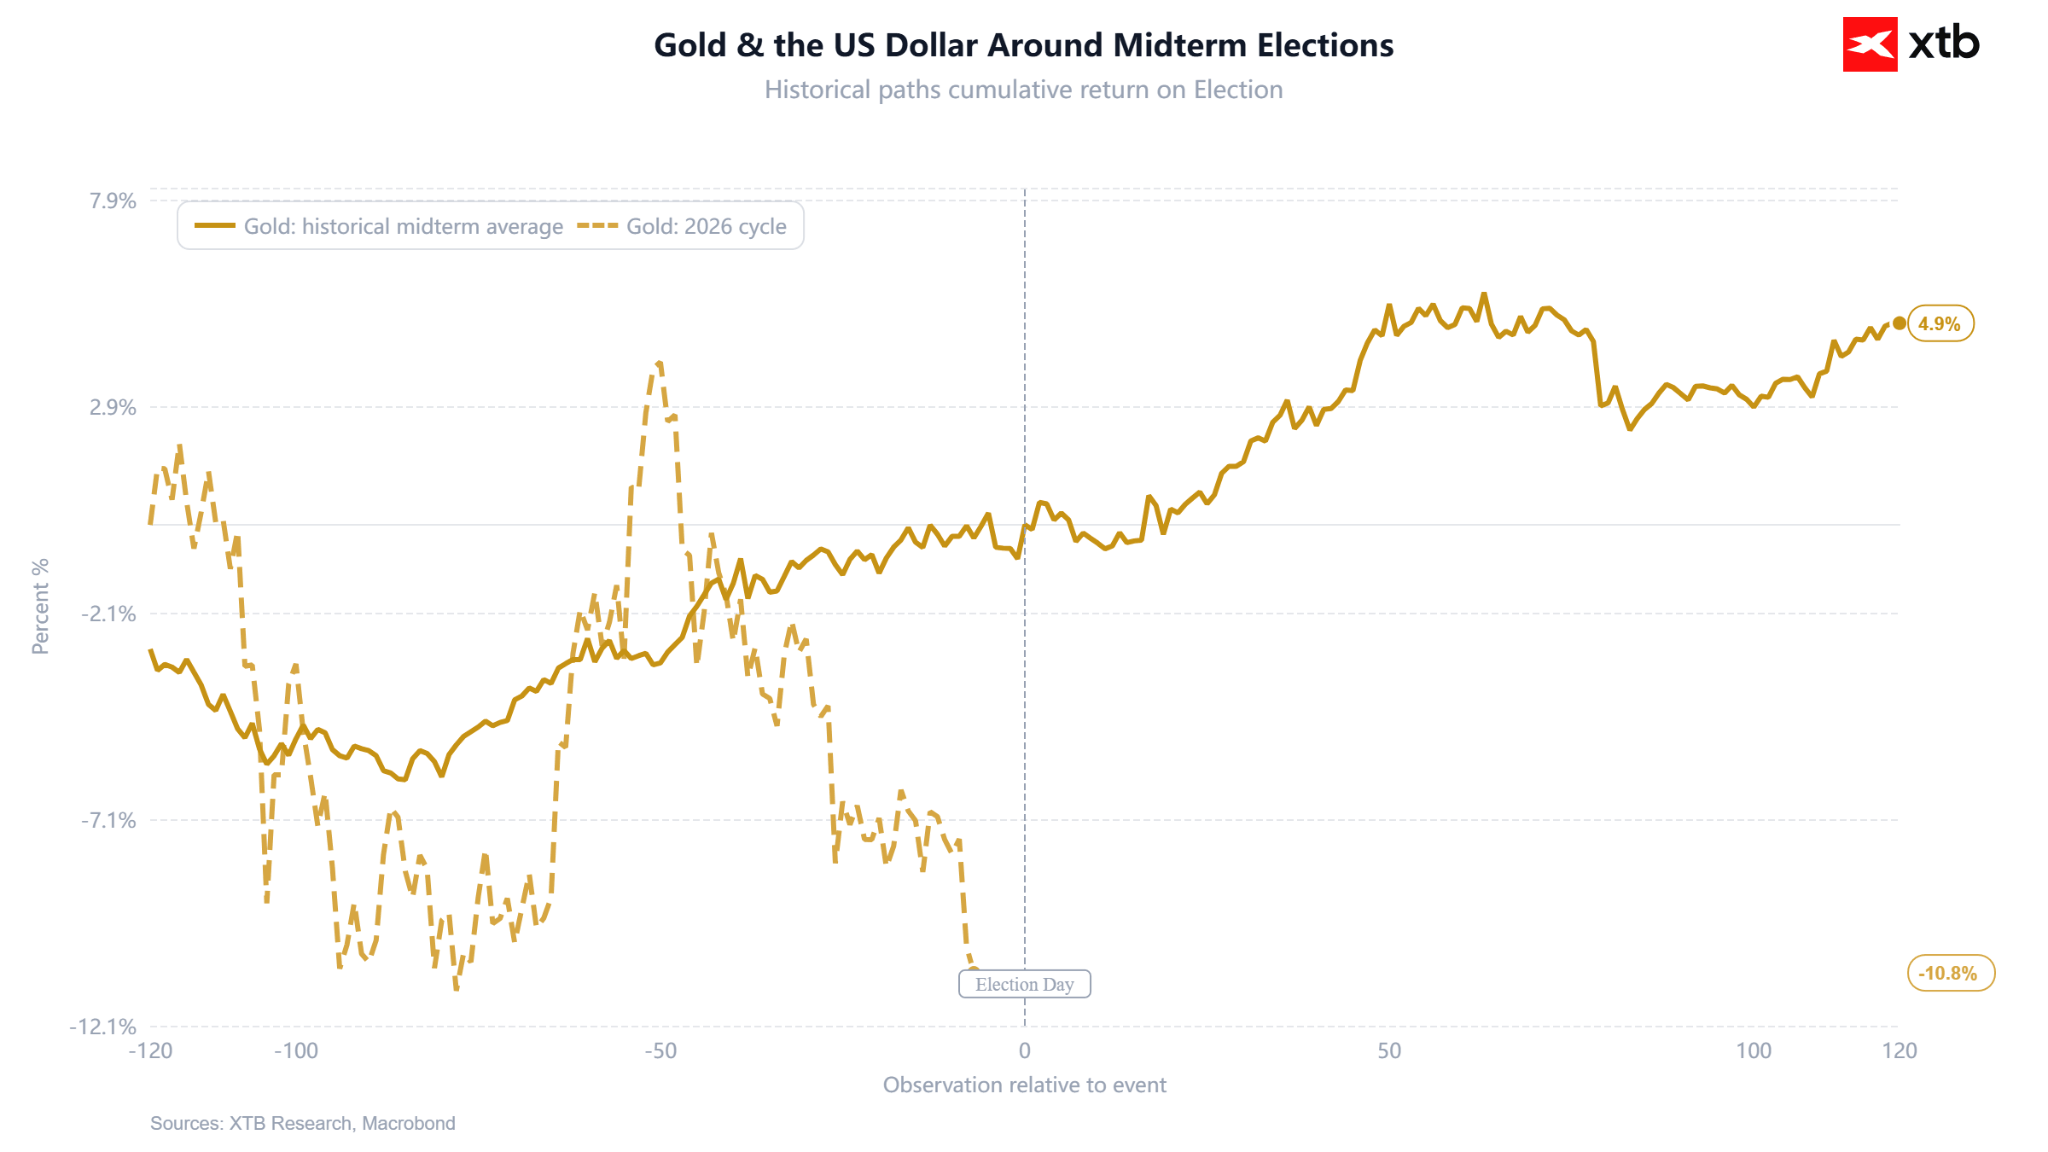
Current gold behavior deviates significantly from standard behavior around midterm elections. Source: Macrobond, XTB
Historical Valuation and Fund Positioning
Gold valuation compared to historical norms is gradually cooling down. Relative to the past year’s average, the price is clearly below typical levels (down nearly 1.4 standard deviations), reflecting the depth of the autumn correction. Over a two-year horizon, prices hover close to the multi-month average, while over a five-year horizon gold remains relatively expensive. Six months ago, the premium over the five-year norm was extremely high, but in subsequent quarters it steadily melted away, indicating a lasting transition of the market from an euphoric rally phase to a deeper valuation balancing.
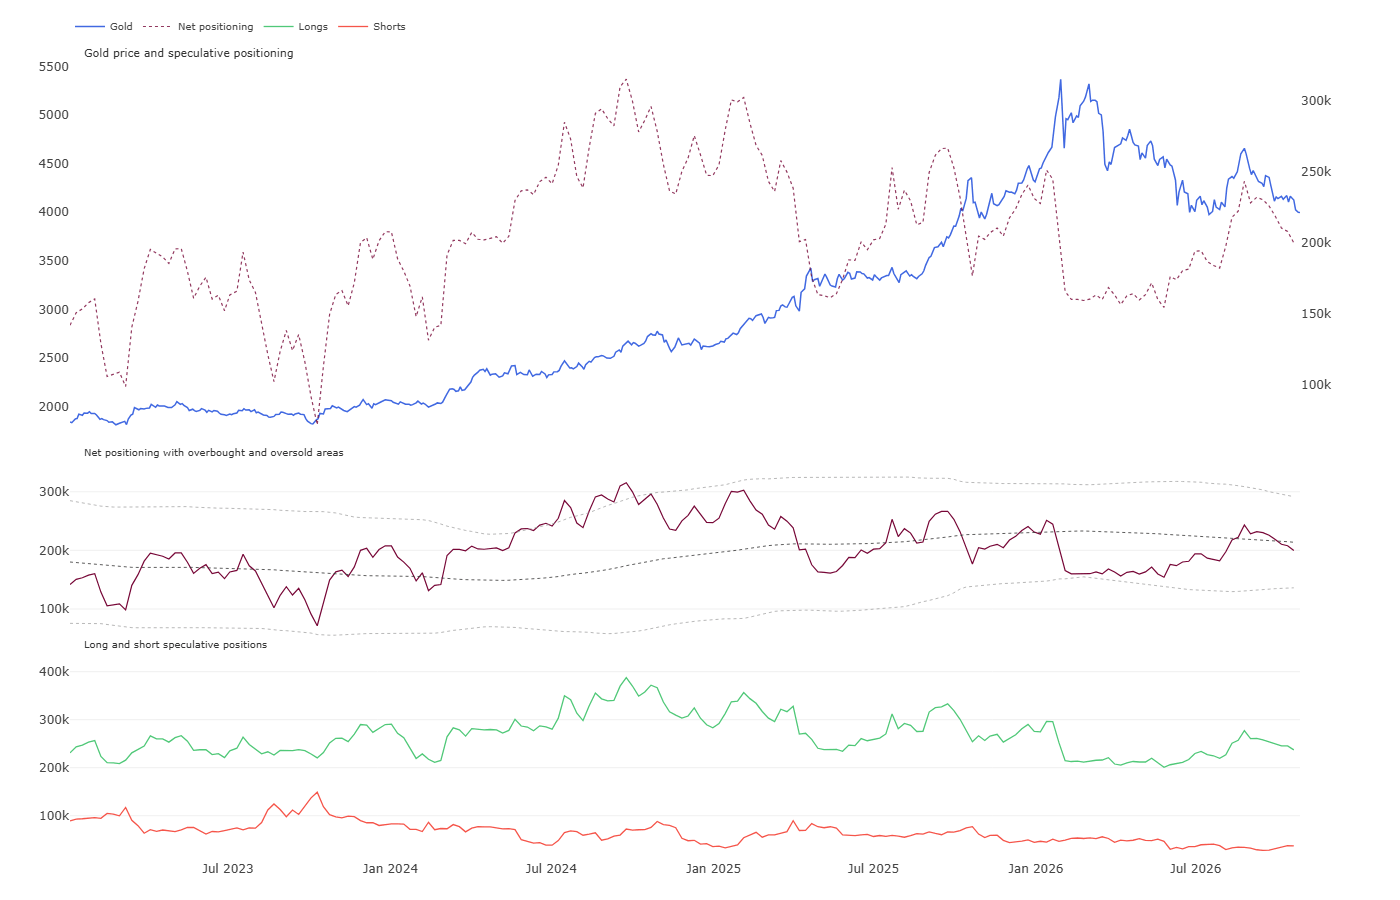
On the institutional investor side, speculative capital maintains moderate optimism, although reducing exposure. According to CFTC data, funds reduced their positions by over 8 thousand contracts, bringing net engagement down to around 200 thousand long contracts. Despite this reduction, net positioning stands near the 81st percentile of the multi-year distribution, and long positions account for over 86% of the total speculative portfolio, meaning market players are still rarely more bullishly positioned. This structure creates a risk of further supply pressure if psychological levels break, as funds still have considerable room to close profitable positions.
Scenarios
- Bullish scenario: The condition for realizing the demand scenario is a dovish pivot in Federal Reserve communications, ruling out a December rate hike, coupled with a return of central bank monthly purchases above 90 tons. A technical signal confirming this move will be a sustained breakout above resistance around USD 4,150 with an RSI rise above 50 points. This would open the path to retesting the USD 4,300 zone, and in the medium term allow a move toward levels forecast by investment banks at USD 4,500–4,600.
- Bearish scenario: Continuation of the sell-off could occur if hawkish statements from the Fed chief solidify expectations for a rate move in December, and real TIPS yields sustainably exceed 2.5%. Breaking the key psychological barrier around USD 3,980–4,000 will trigger a wave of stop-loss orders and further long position liquidation by hedge funds. In such a scenario, prices will head toward the next support around USD 3,850, with a risk of deepening sell-offs into the USD 3,700 region.
Crude Oil (WTI and Brent)
Technical Analysis
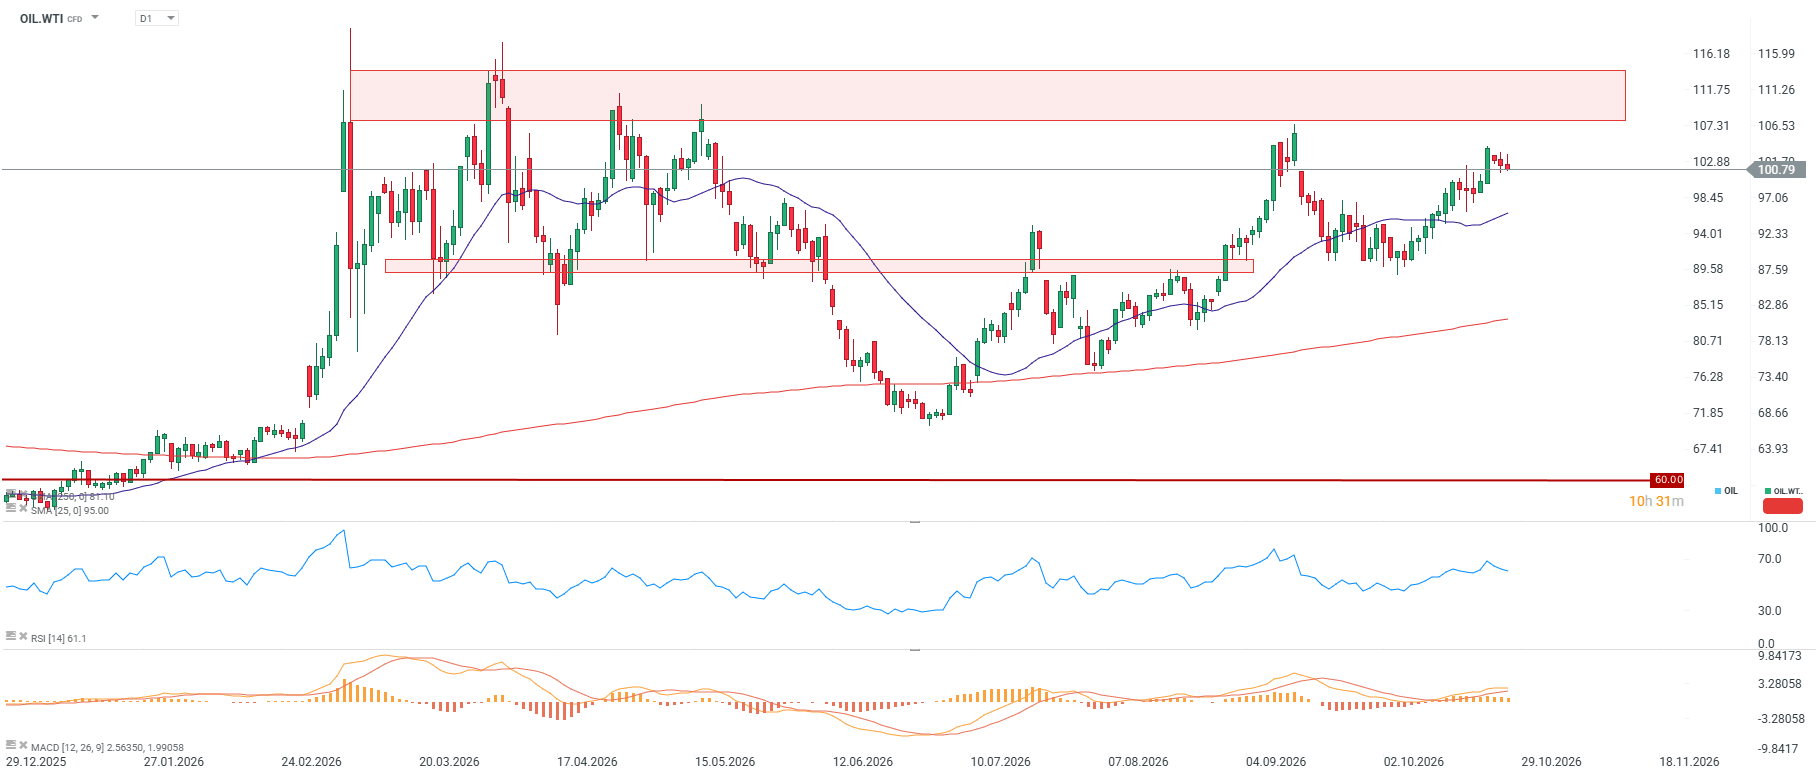
- Crude oil prices oscillated around USD 102 per barrel earlier this morning before falling below USD 101, rising 4.3% over the past week and 10.8% monthly, with YTD returns reaching 78.8% (70.3% year-on-year).
- The RSI indicator holds around 61 points, reflecting a moderate advantage for demand without entering overbought territory.
- SMA moving averages and the MACD indicator generate unambiguously bullish signals, with the price standing about 9.5% above the 50-session moving average, confirming the durability of the medium-term uptrend.
- The nearest technical resistance zone extends around USD 105–108, while the key support level is defined by the psychological zone around USD 98–100.
Fundamental and Market Context
- Diplomats from Saudi Arabia, Pakistan, and Turkey held talks with Iranian authorities to de-escalate disputes with the US and prevent a worsening energy crisis.
- US Central Command forces ensured safe transit for over 1.5 billion barrels of oil through the Strait of Hormuz since summer 2026, despite maintaining a naval blockade of Iranian ports.
- The Iranian administration of the Strait of Hormuz announced legal actions against tankers operated by South Korean operator Sinokor conducting voyages in the region.
- Saudi authorities contained a fire near the strategic Ras Tanura oil hub following an attack on transmission infrastructure.
- OPEC+ alliance delegates signaled intentions to maintain current oil production limits unchanged during the upcoming Sunday summit.
- Crude oil production in Saudi Arabia rose to 8,372k barrels per day from 6,238k barrels reported in the previous period.
- US oil production stood at 13,948k barrels per day, though weekly output estimates pointed to a drop to 13,269k barrels.
- Commercial crude inventories in the US shrank by 3.06 million barrels according to government data, while the API report showed a drawdown of 4.93 million barrels.
- Russian output decreased to 9,582k barrels per day from 9,716.87k barrels recorded a month earlier.
- Donald Trump’s administration is preparing to ease federal methane emission regulations, seeking to lower operating costs for US oil and gas companies.
- Market uncertainty is heightened by parliamentary elections in Israel and approaching US midterm elections, which could bring renewed military strikes on Iran.
- The Iranian president and the Emir of Qatar held direct consultations regarding tightening regional trade cooperation and energy policy coordination.
- More technical signals are appearing indicating oil is approaching a climax point. Oil has never appreciated so strongly around midterm elections, though simultaneously we have never had such an aggressive US strategy regarding the Middle East situation around elections.
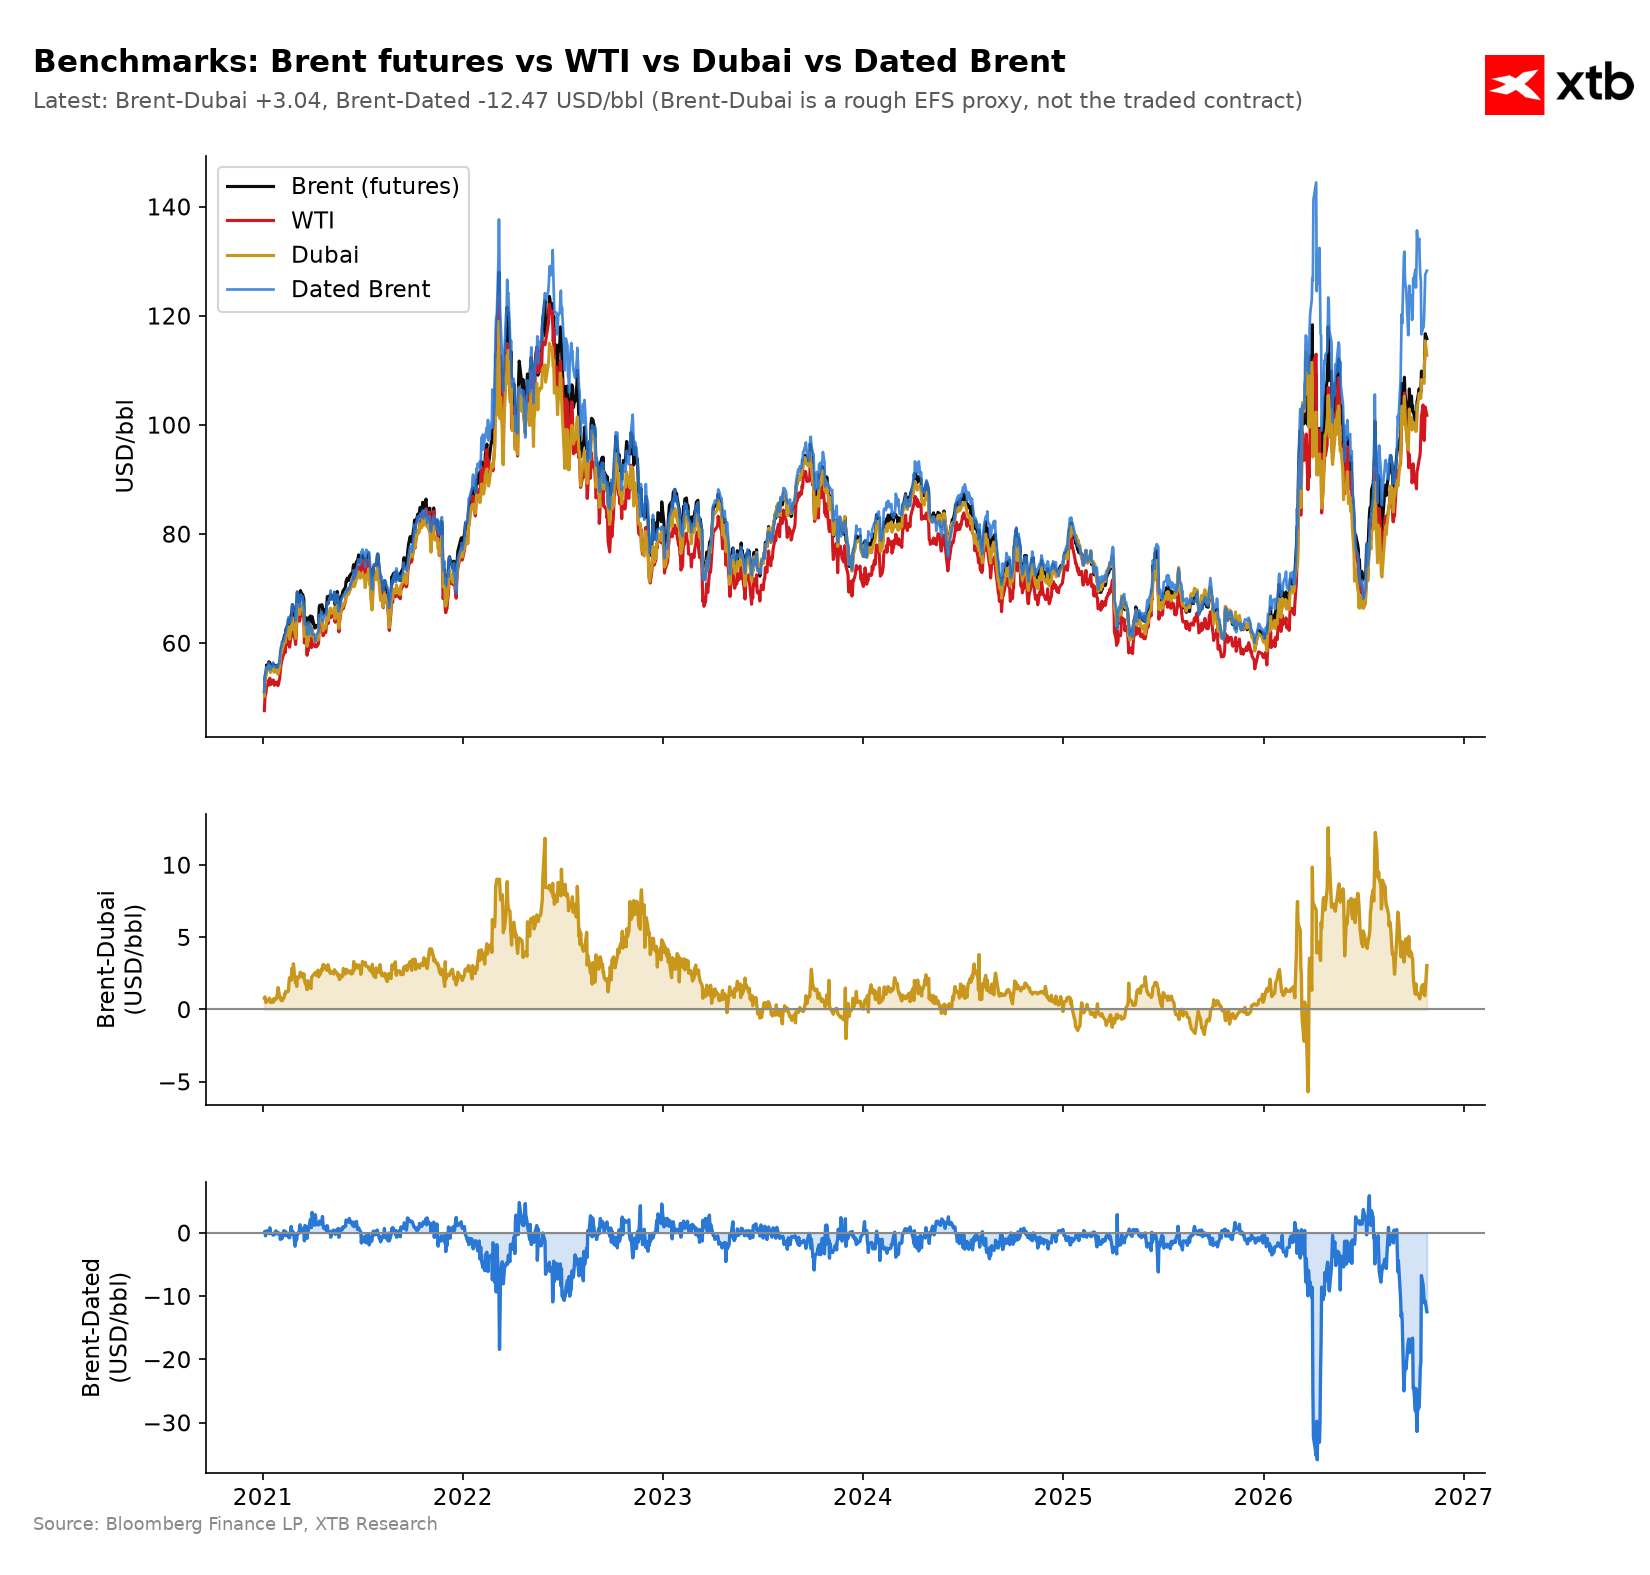
The Dated Brent premium compared to the front-month contract has been almost eliminated. Source: Bloomberg Finance LP, XTB
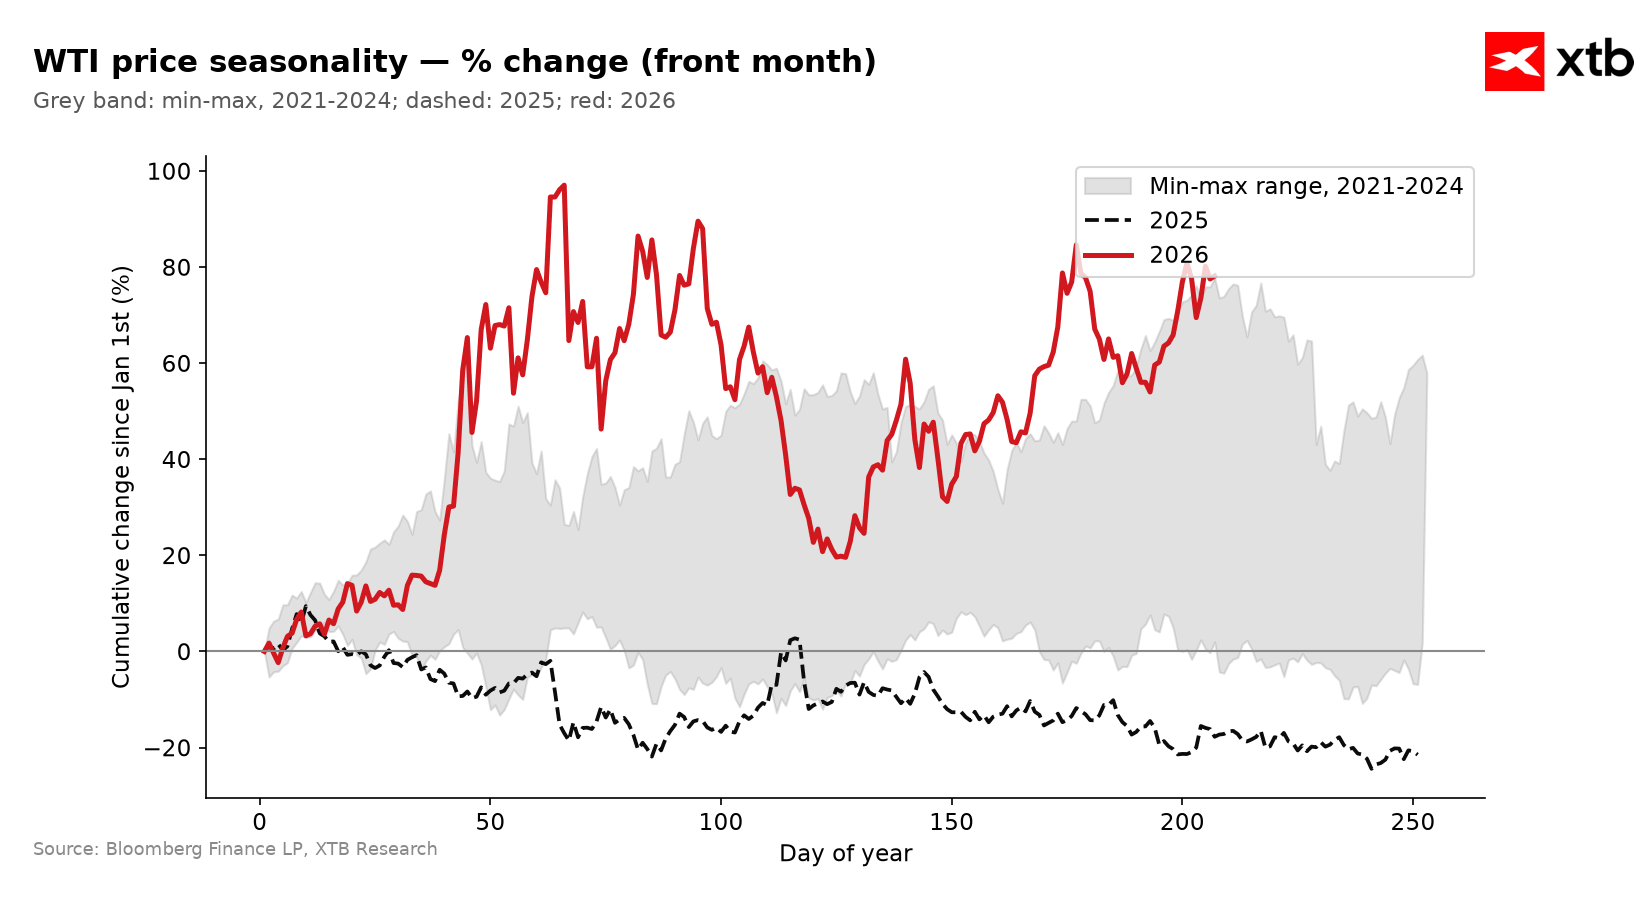
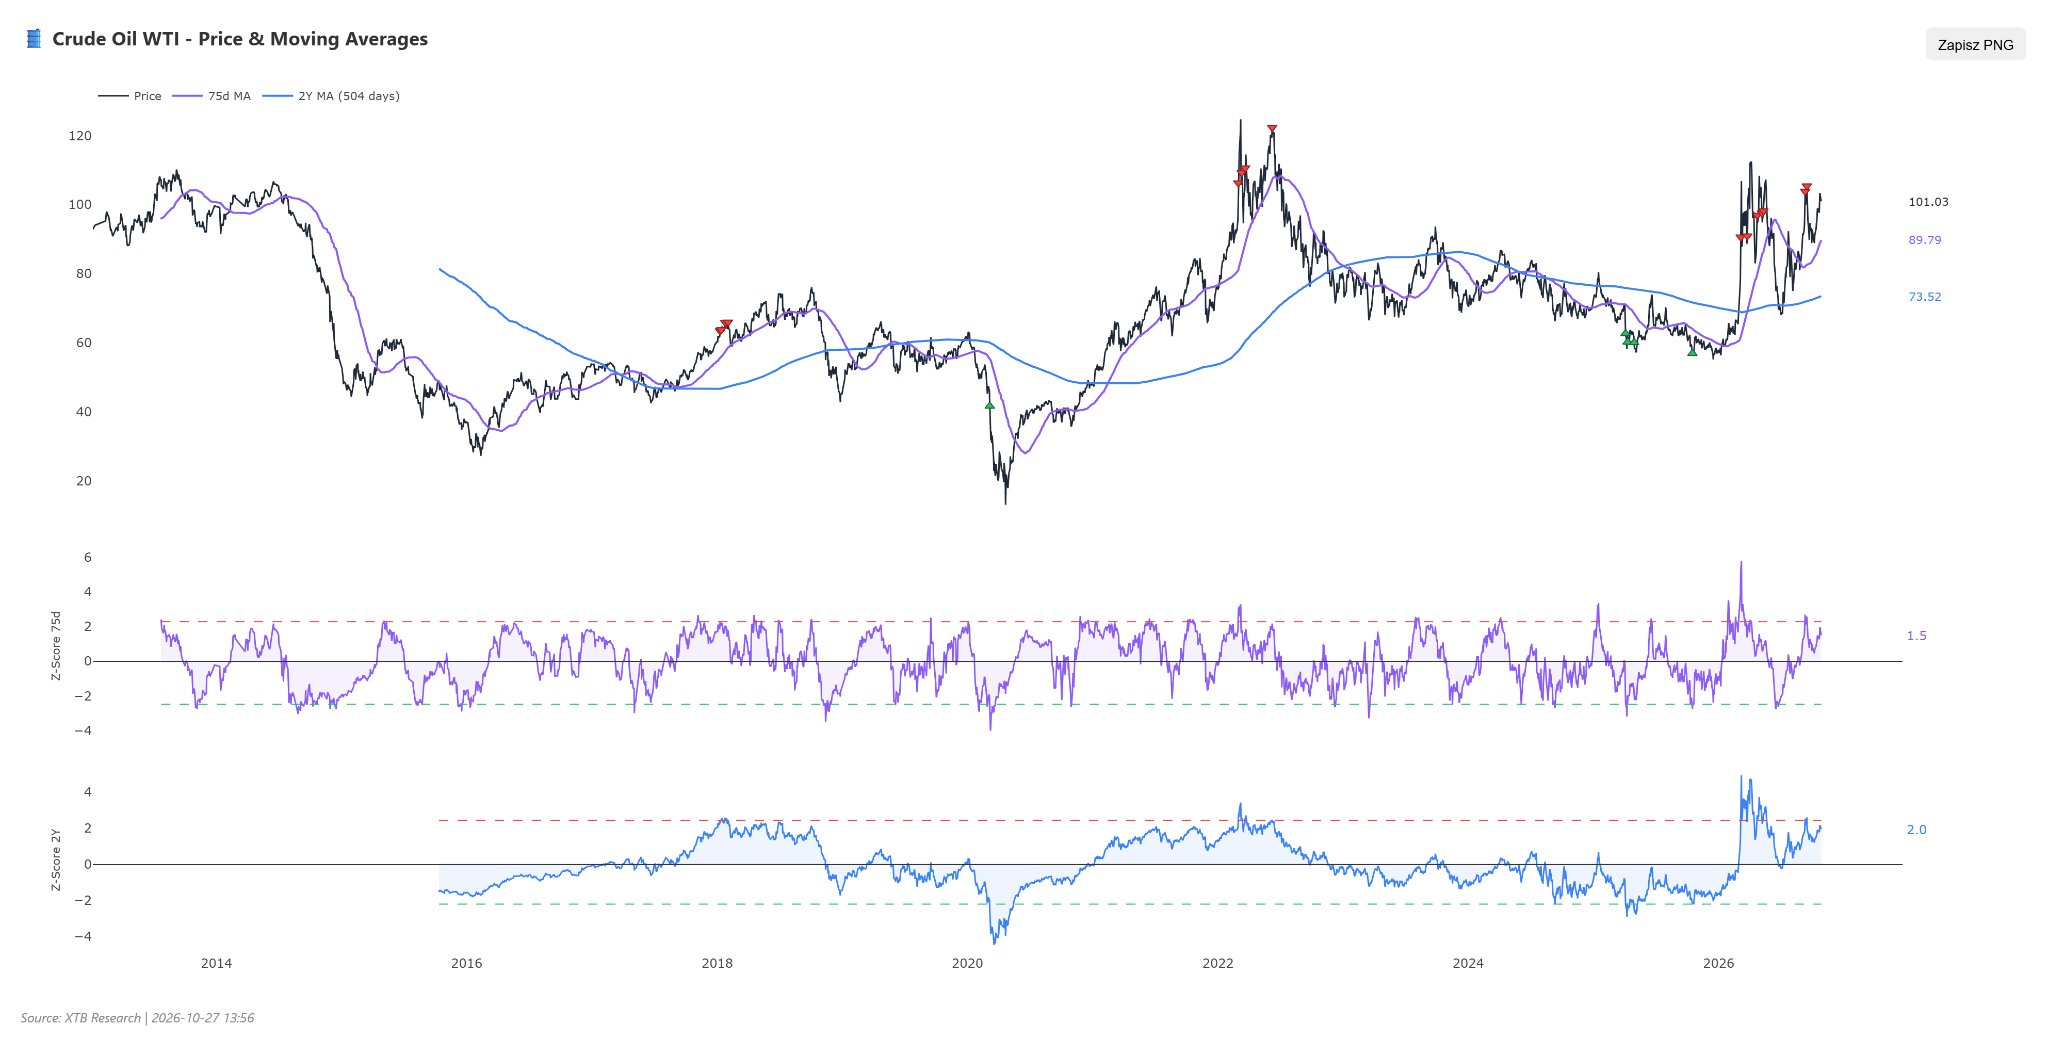
Looking at volatility in recent years, a local peak typically formed around 200 sessions (the second growth wave from 2022). Source: Bloomberg Finance LP, XTB
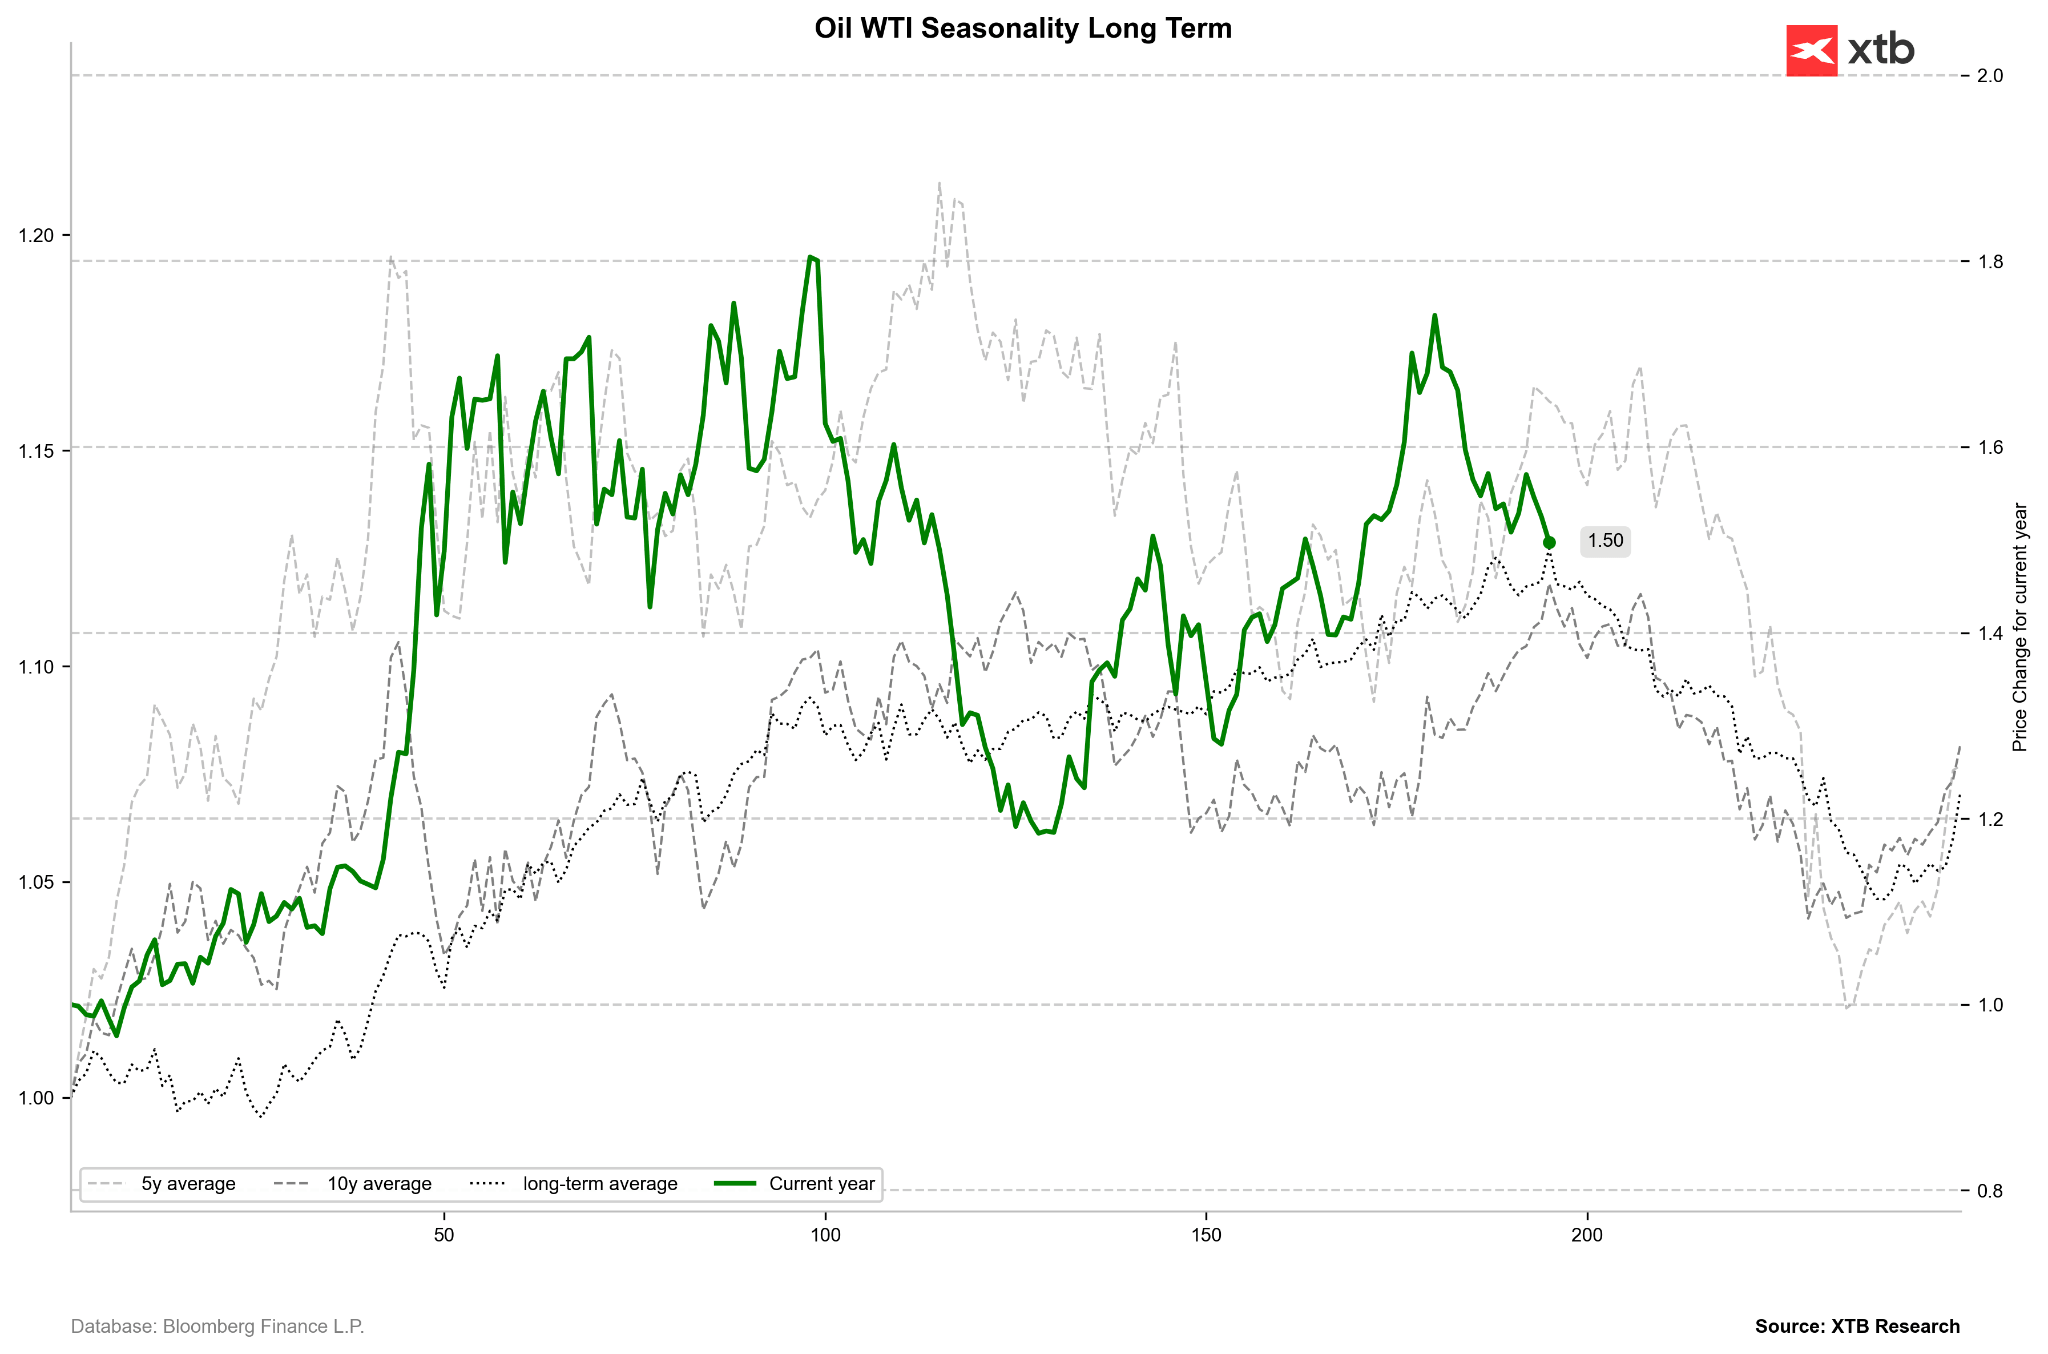
Long-term averages indicate that a price peak usually formed around the 200-session average. Source: Bloomberg Finance LP, XTB
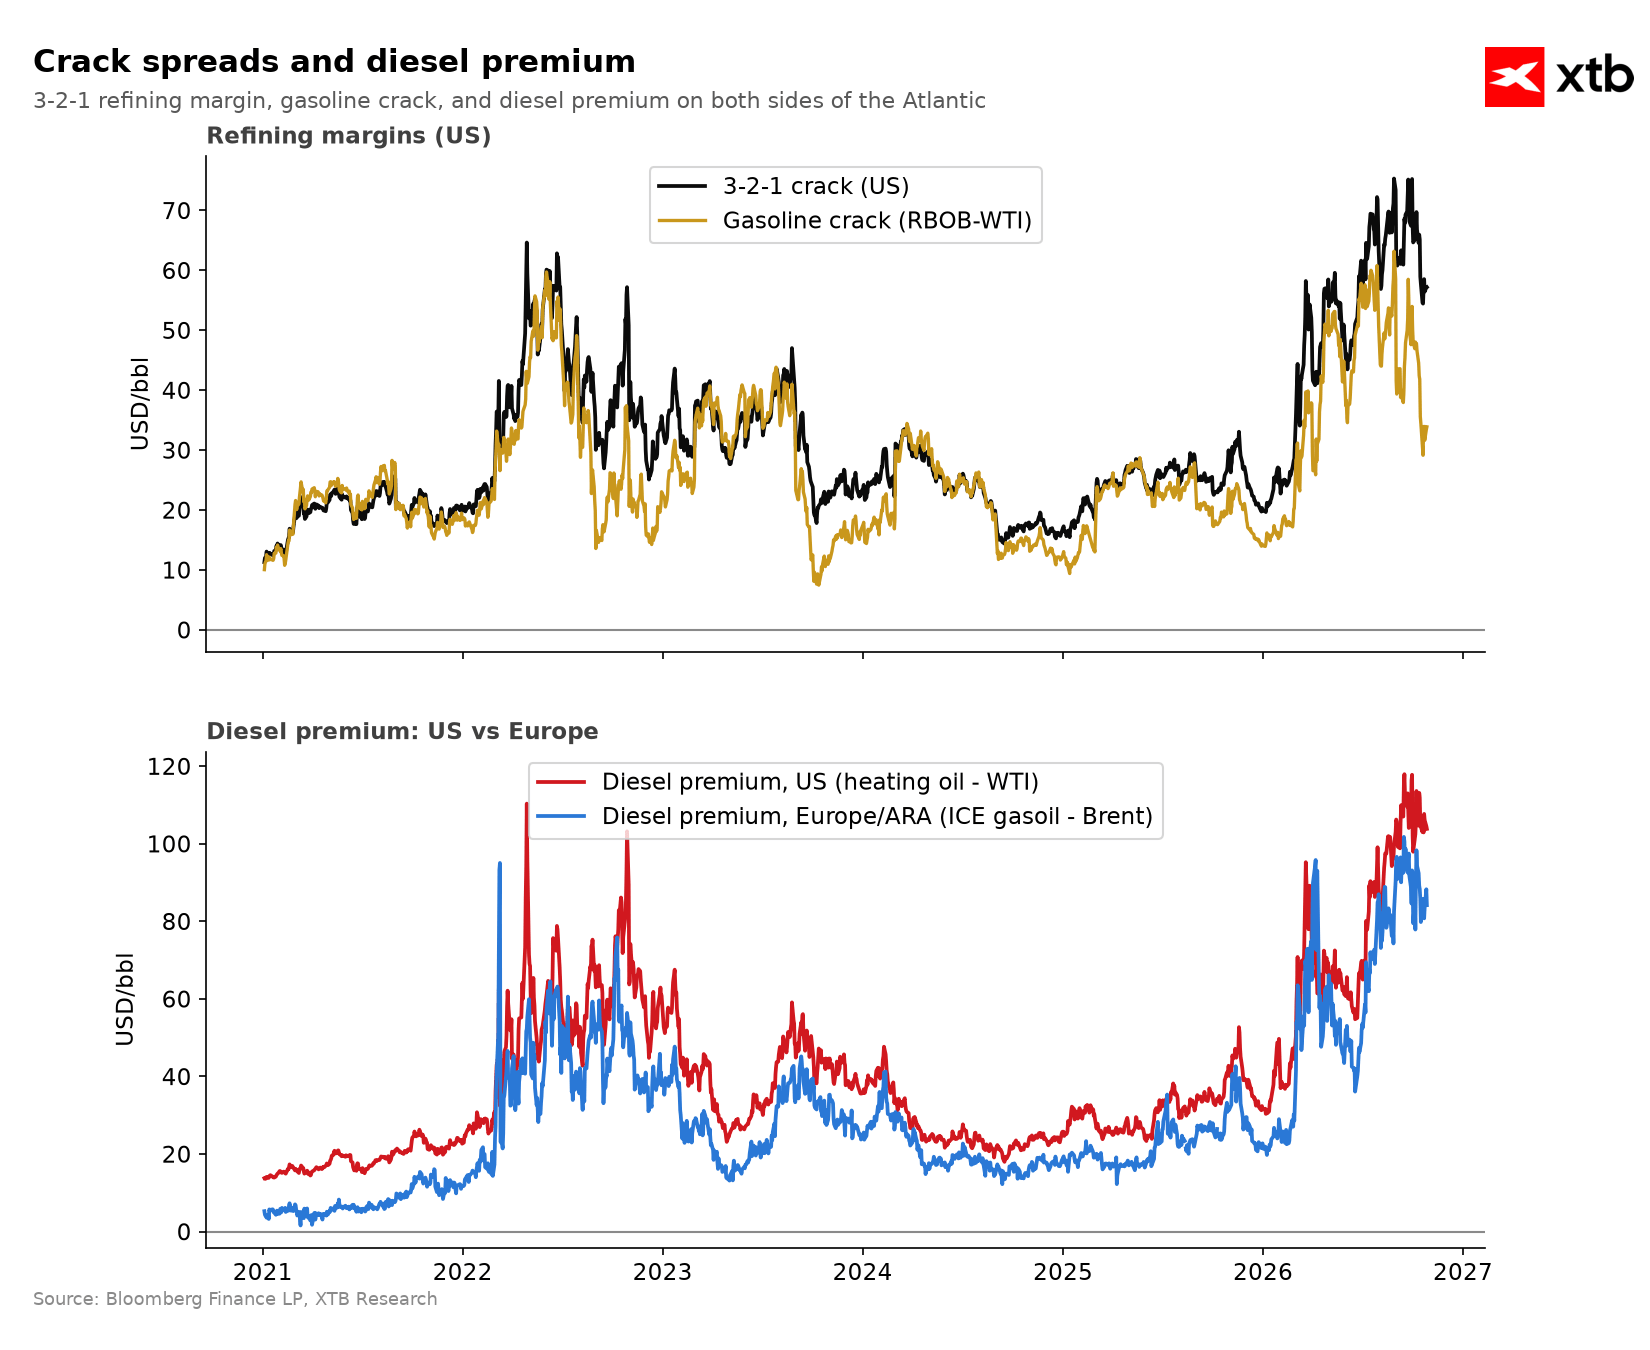
Refinery margins are beginning to fall, especially those associated with gasoline. Source: Bloomberg Finance LP, XTB
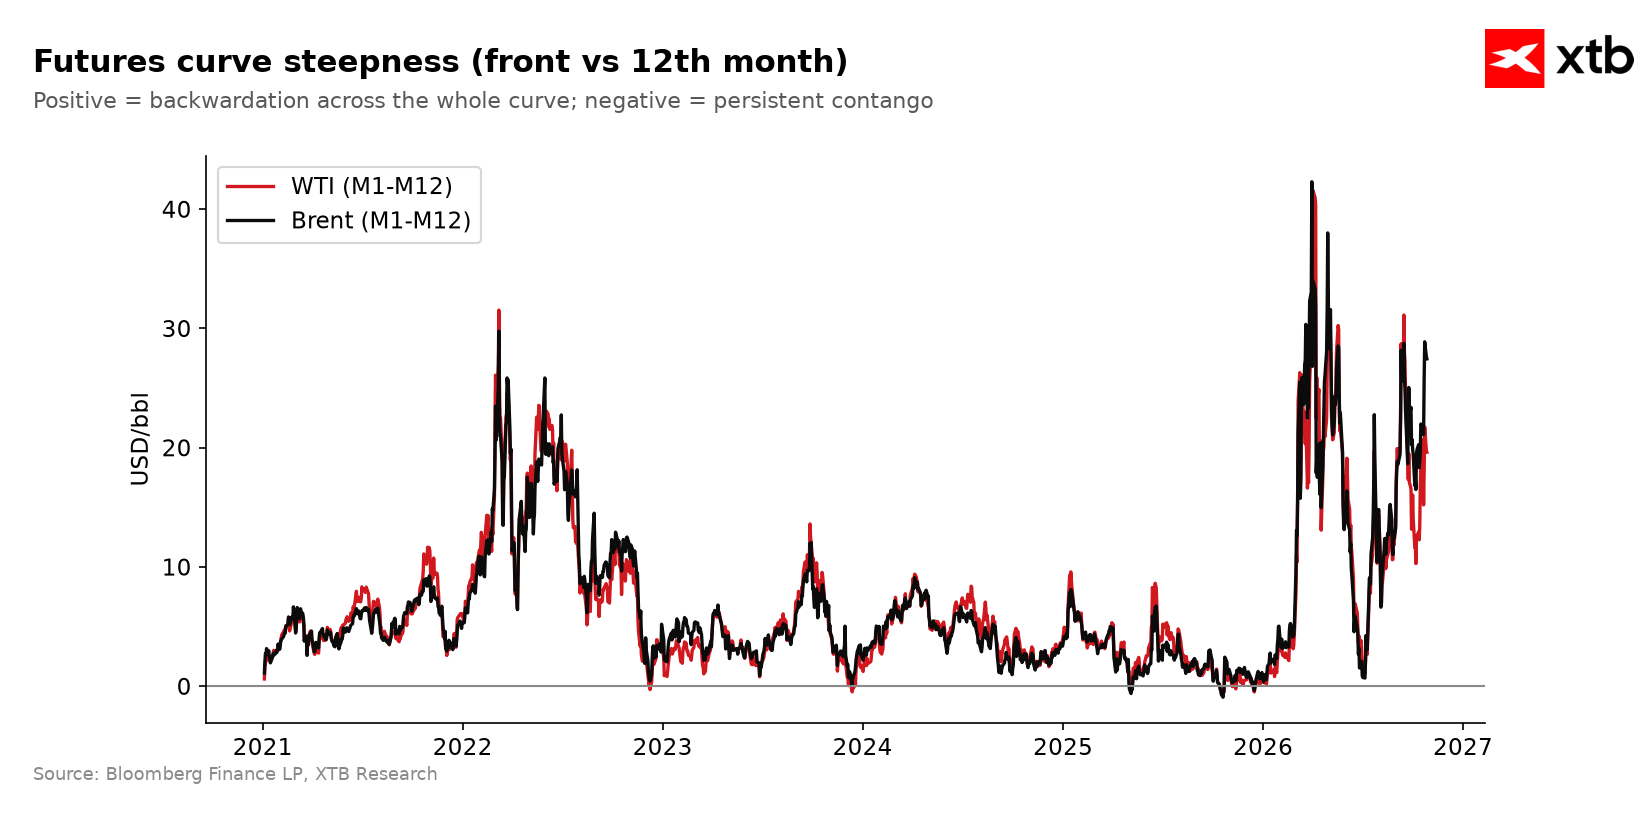
Backwardation steepness increased on an annual basis to nearly 30 dollars, which historically served as an overvaluation signal for front-month contracts. Source: Bloomberg Finance LP, XTB
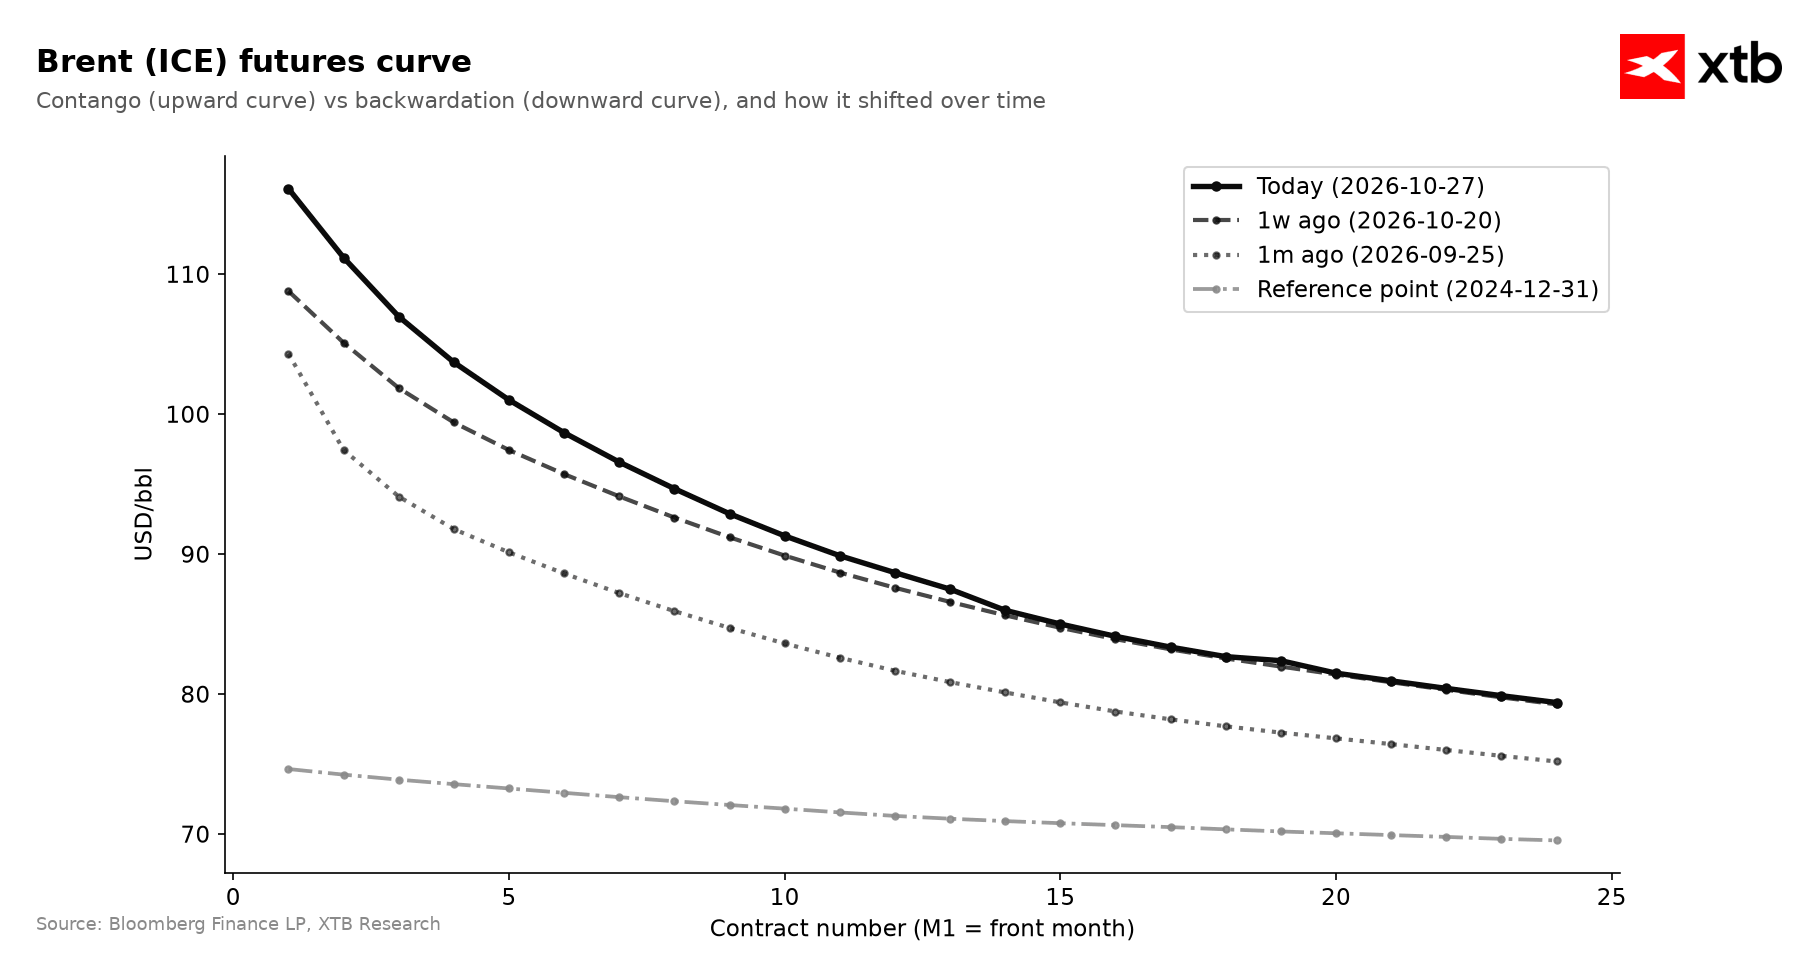
The curve shape itself shows that the situation is beginning to detach from the prior equilibrium, all while a substantial amount of oil continues flowing out of the Middle East. Source: Bloomberg Finance LP, XTB
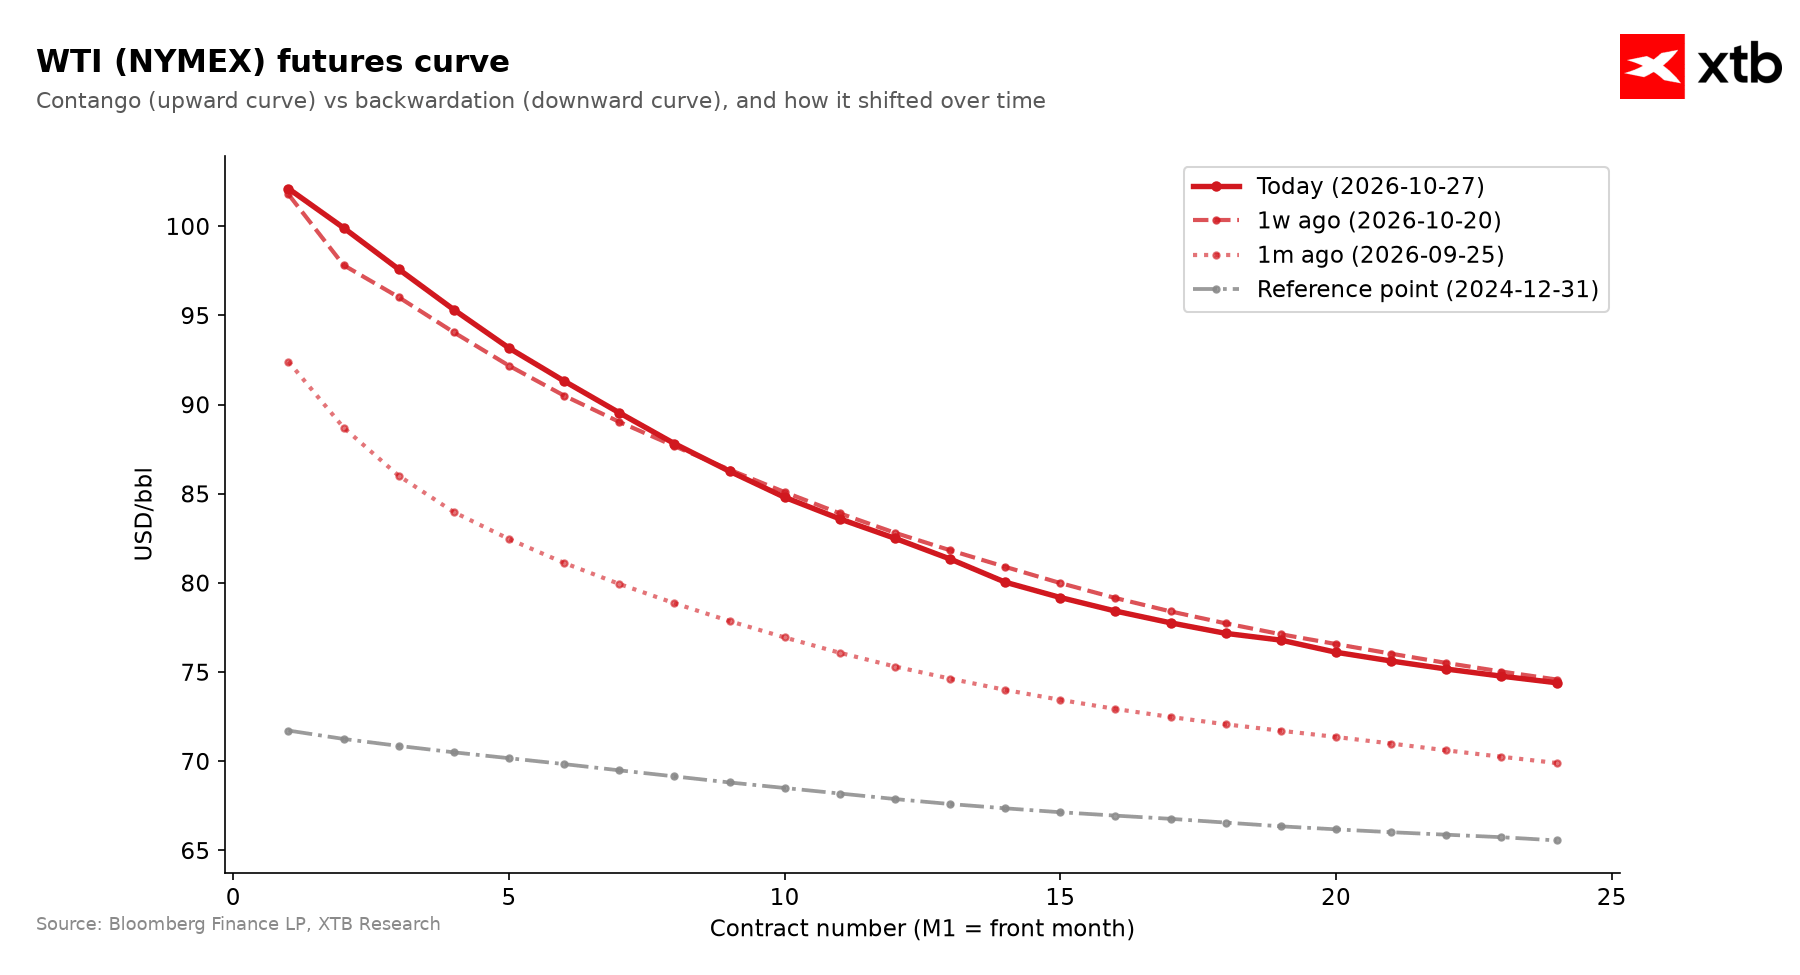
On the other hand, WTI crude looks significantly more stable, though the scale of increase relative to last month’s levels is huge. Source: Bloomberg Finance LP, XTB
Historical Valuation and Fund Positioning
Crude oil prices sit at levels significantly higher than multi-year statistical patterns would suggest. Relative to the five-year average, commodity prices remain distinctly above the norm (by 1.7 standard deviations), while relative to the two-year average, the deviation exceeds 2.0 standard deviations upward. Six months ago, the commodity displayed a similar high premium, only to drop near the multi-year average in mid-summer. Recent weeks, however, brought a sharp reversal of this trend – the price premium systematically grew from 1.1 standard deviations a month ago to current, heavily elevated levels.
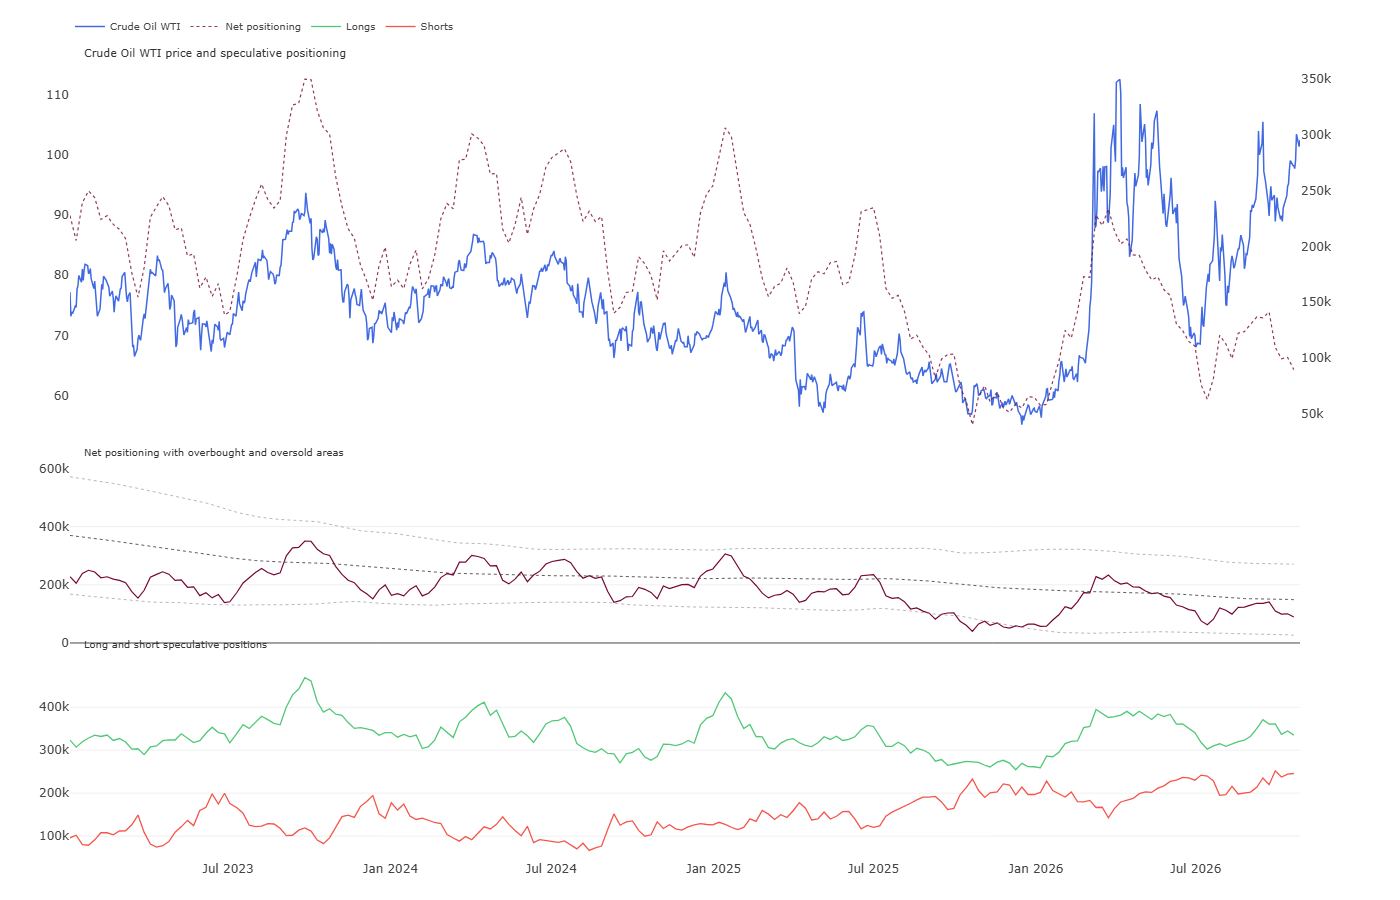
Meanwhile, speculative fund behavior indicates clear restraint among financial capital. Asset managers’ net long position stands at about 89 thousand contracts, which is nearly one standard deviation below the two-year average and places fund engagement around the 54th percentile of historical data. In the past week, investors reduced net exposure by over 11 thousand contracts, limiting the share of long positions to 58%. This disconnect means institutional capital is not chasing current highs for fear of demand destruction at prices above USD 100. The lack of overheating in the futures market limits the risk of panic selling by funds, but renders valuation fully dependent on maintaining the geopolitical premium.
Scenarios
- Bullish scenario: Failure of diplomatic talks with Tehran and resumption of military strikes on Iranian oil facilities after Israeli or US elections could lead to physical paralysis of navigation in the Strait of Hormuz. Technical confirmation of a return to dynamic growth will be a sustained break above resistance around USD 105 per barrel. In such a scenario, oil prices will open the path to advance toward the USD 110–115 zone.
- Bearish scenario: Success of the regional diplomatic mission of Saudi Arabia, Turkey, and Pakistan combined with further output growth in Saudi fields above 8.5 million barrels per day will ease supply balance concerns and highlight falling demand. A buyer surrender signal will be prices dipping below support in the USD 98 region. Realization of this setup will drive barrel valuations toward the USD 92–90 zone.
Sugar
Technical Analysis
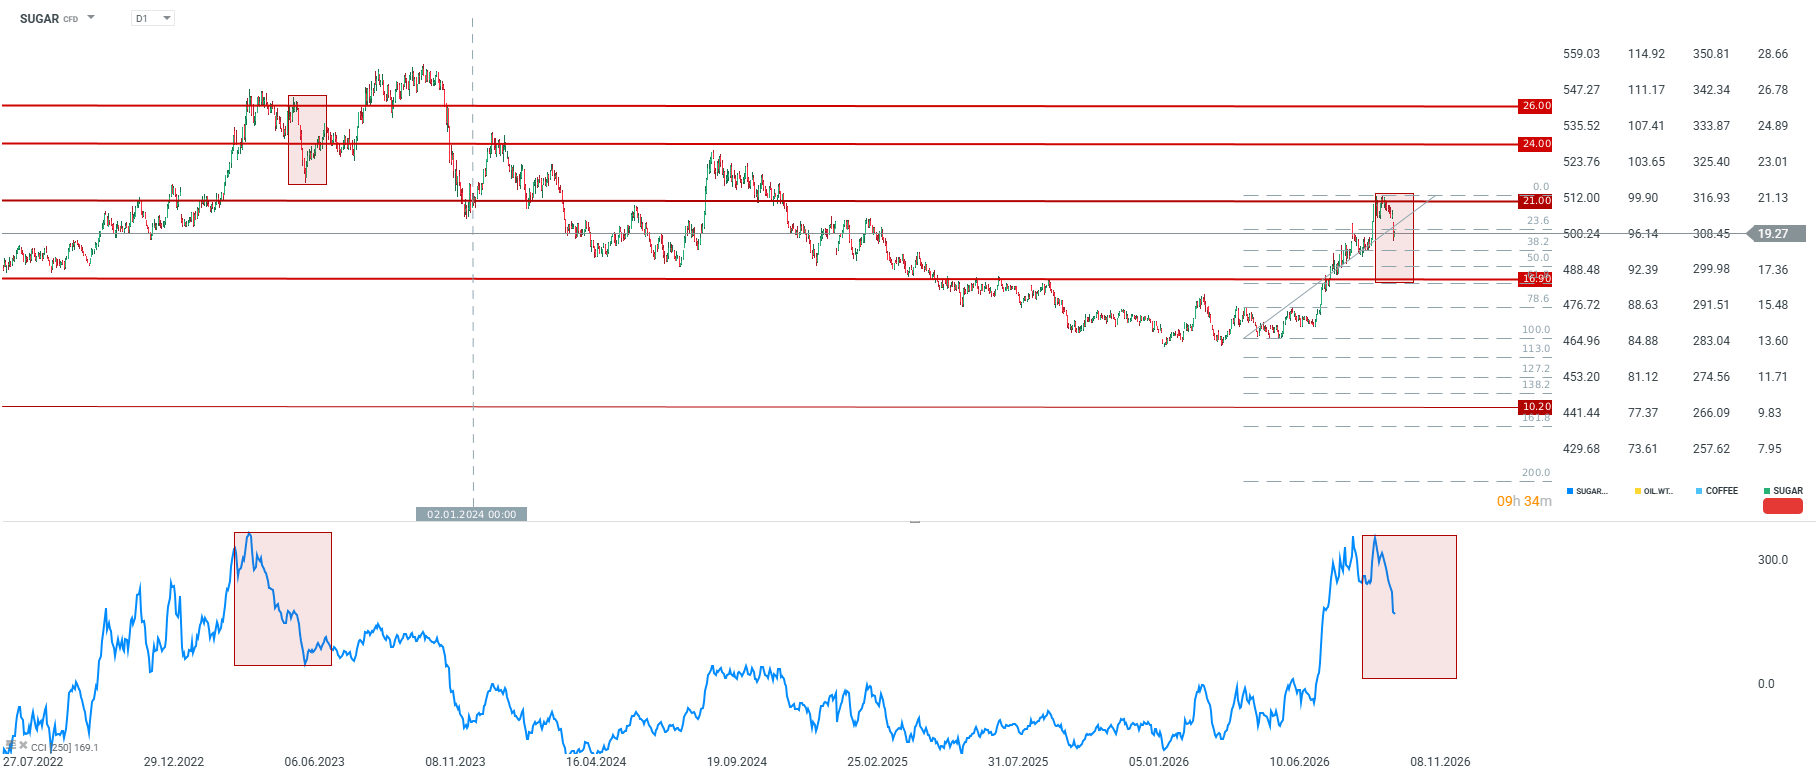
- Sugar prices oscillate around 19 cents per pound, recording a 5.7% decline over the past week, a 4.3% increase monthly, and an appreciation of 32.5% YTD and 34.4% year-on-year.
- The RSI indicator at 45 points indicates a neutral market without oversold characteristics, while the price holds about 1.4% above the 50-session average; SMA moving average structure remains bullish, but a negative MACD signal warns of a potential continued correction.
- The nearest technical support zone lies around 18 cents per pound, while key resistance is marked by the area around 20 cents.
- The CCI indicator is dropping from very similar levels as during the first sell-off wave in 2022. That period was also linked to El Niño.
Fundamental and Market Context
- The recent price decline below 19 cents brought commodity valuations to the lowest level since late September.
- The election victory of Luiz Inácio Lula da Silva in Brazil led to a significant weakening of the Brazilian real.
- A cheaper real increases export profitability in local currency and motivates Brazilian producers to accelerate commodity sales abroad.
- Anouncement to challenge the presidential election results by Flávio Bolsonaro creates a risk of further political instability and currency fluctuations for the real.
- Weather improvements in Brazil’s Center-South region allowed harvesting and crushing of cane to resume following earlier rains, boosting current supply.
- UNICA industry data showed that cumulative cane harvest in Brazil through late August grew by 1.8% year-on-year.
- Sugar production in Brazil fell during the same period by 10.3% due to mills previously favoring ethanol production.
- Declining crude oil prices worsen biofuel profitability, prompting Brazilian mills to shift production mix from ethanol to sugar.
- In India, distinctly lower harvests are forecast as a result of El Niño, which brought the weakest monsoon season in over a decade.
- Anticipation of the Federal Reserve decision and potential hawkish signals from the central bank favor the dollar, exerting additional pressure on agricultural commodities.
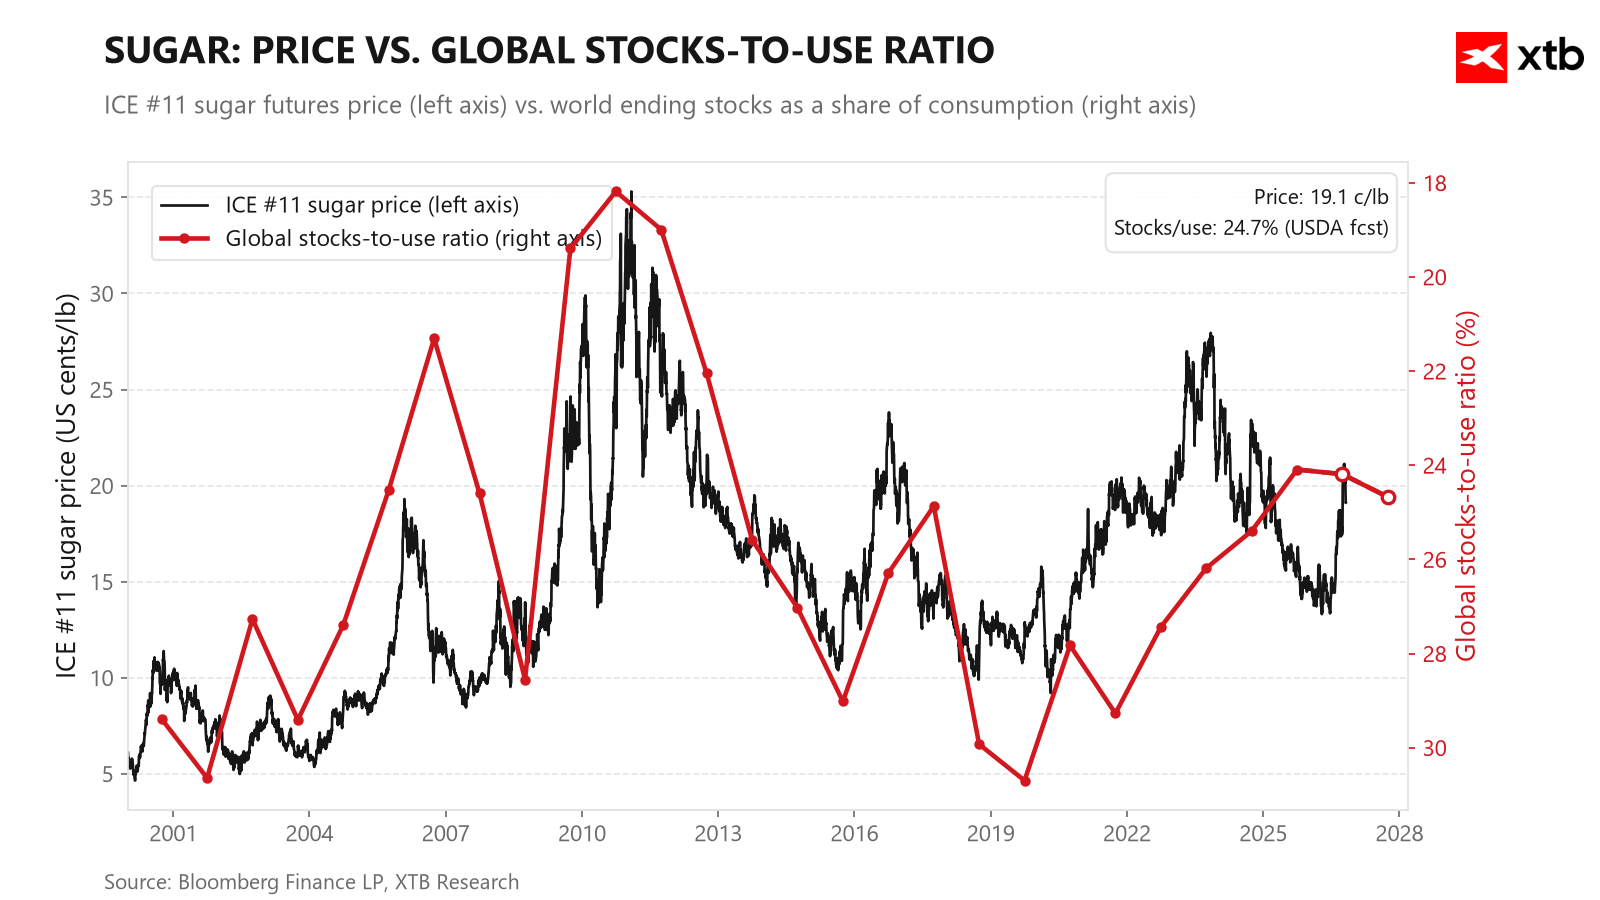
Sugar prices fell to extremely low levels in 2025 and early 2026 relative to inventory and consumption behavior. However, despite El Niño, forecasts point to inventory recovery relative to consumption. Source: Bloomberg Finance LP, XTB
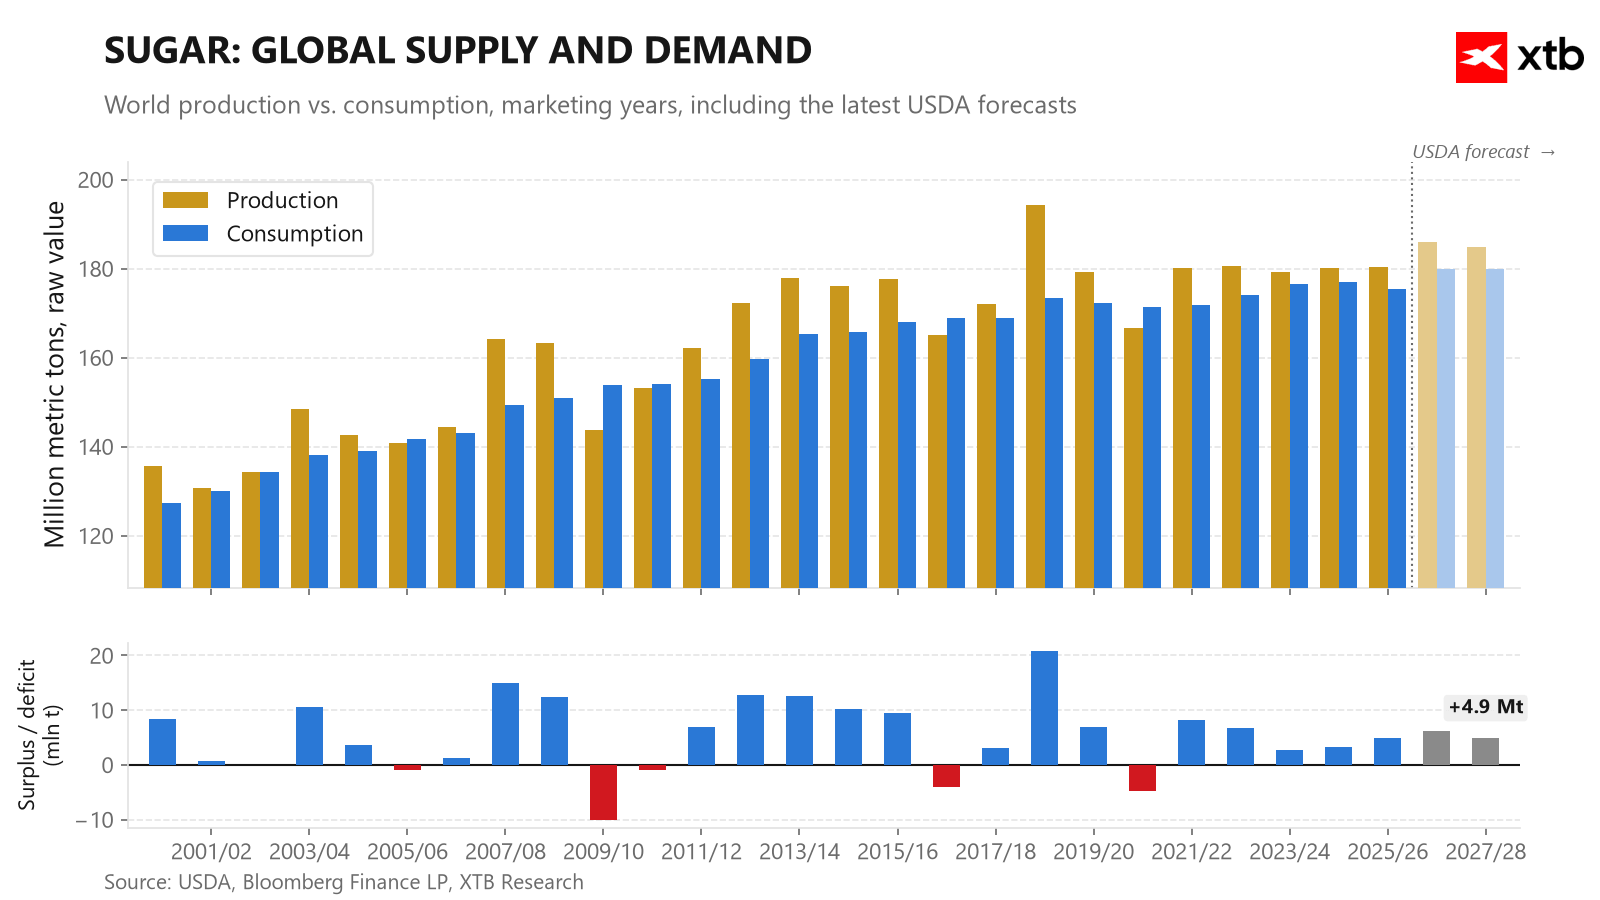
Despite ongoing El Niño, USDA expectations point to further production growth in upcoming seasons. Source: Bloomberg Finance LP, XTB
Historical Valuation and Fund Positioning
Sugar valuation over a multi-year view returned to historical norms, after trading deep below its five-year average just half a year ago. In subsequent months, this discount steadily and dynamically melted away – from clear undervaluation three months ago, through gradual recovery a month ago, to current alignment with the long-term average. At the same time, over a one-year and two-year horizon, sugar still shows valuation clearly above average levels, reflecting strong supply impulses from earlier phases of the current year.
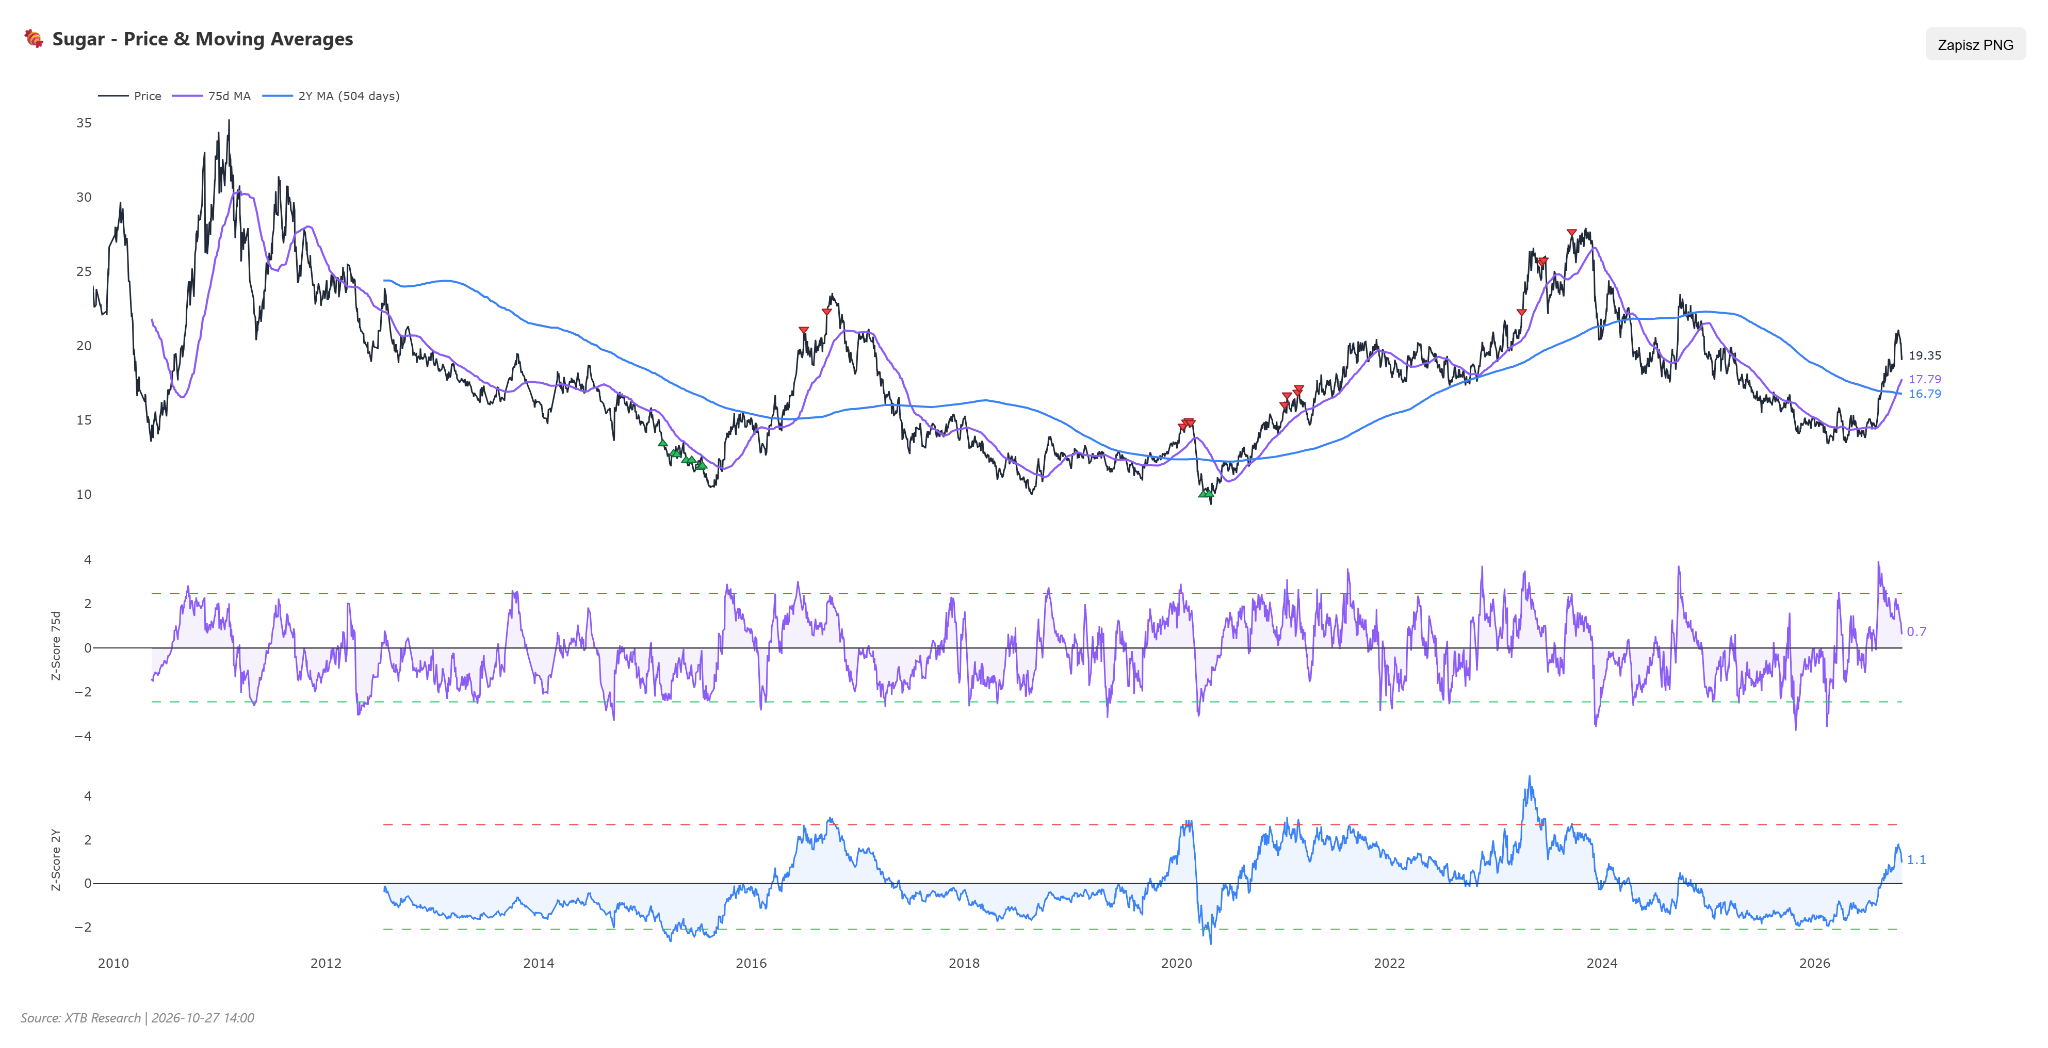
In speculative fund positioning, extreme optimism persists – long positions account for nearly 69% of engagement, and buyer advantage stands around 229 thousand contracts after a minimal increase last week. Speculative capital sentiment sits at the 92nd historical percentile, meaning funds have rarely been so heavily positioned for increases, and their exposure reached its highest level in five years. Such strong positioning asymmetry combined with long-term valuation normalization poses high risk of a sharp sell-off if returning Brazilian supply forces investors to exit the market and lock in profits en masse.
Scenarios
- Bullish scenario: Sustained supply constraint from India following the weakest monsoon in a decade, alongside a halt in crude oil price declines discouraging Brazilian mills from excessive sugar production over ethanol, could restore demand advantage. Chart confirmation for this setup will be a sustained breakout above resistance around 20 cents per pound. In that case, the market will open room to retest highs in the 21–22 cents area.
- Bearish scenario: Further depreciation of the Brazilian real triggered by post-election political disputes and rapid fieldwork pace in the Center-South region will intensify export sales from Brazilian processors. Realization of this variant will be sealed by prices dipping below technical support around 18 cents per pound, risking a cascade of long position unwinding by heavily leveraged funds. Prices could then head toward the 16–17 cents zone.