





Key takeaways
- US natural gas prices hover near 2.9 USD per MMBtu with weakening momentum.
- European TTF gas trades near 99 EUR per MWh amid strong buyer dominance.
- Global wheat production is estimated to reach the second-highest level in history.
- Gold prices trade near 3 900 USD per oz as safe-haven demand softens.
- OPEC+ members decided to freeze production at reduced levels through 2026.
Natural Gas (US & Europe)
Technical Analysis
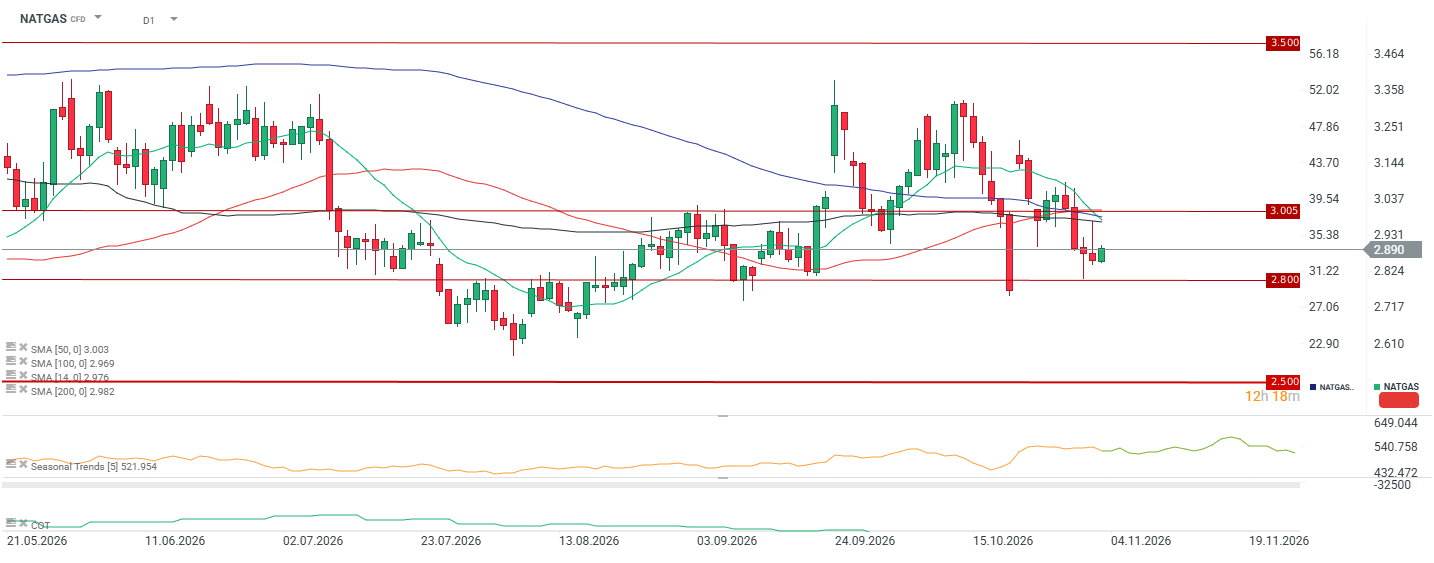
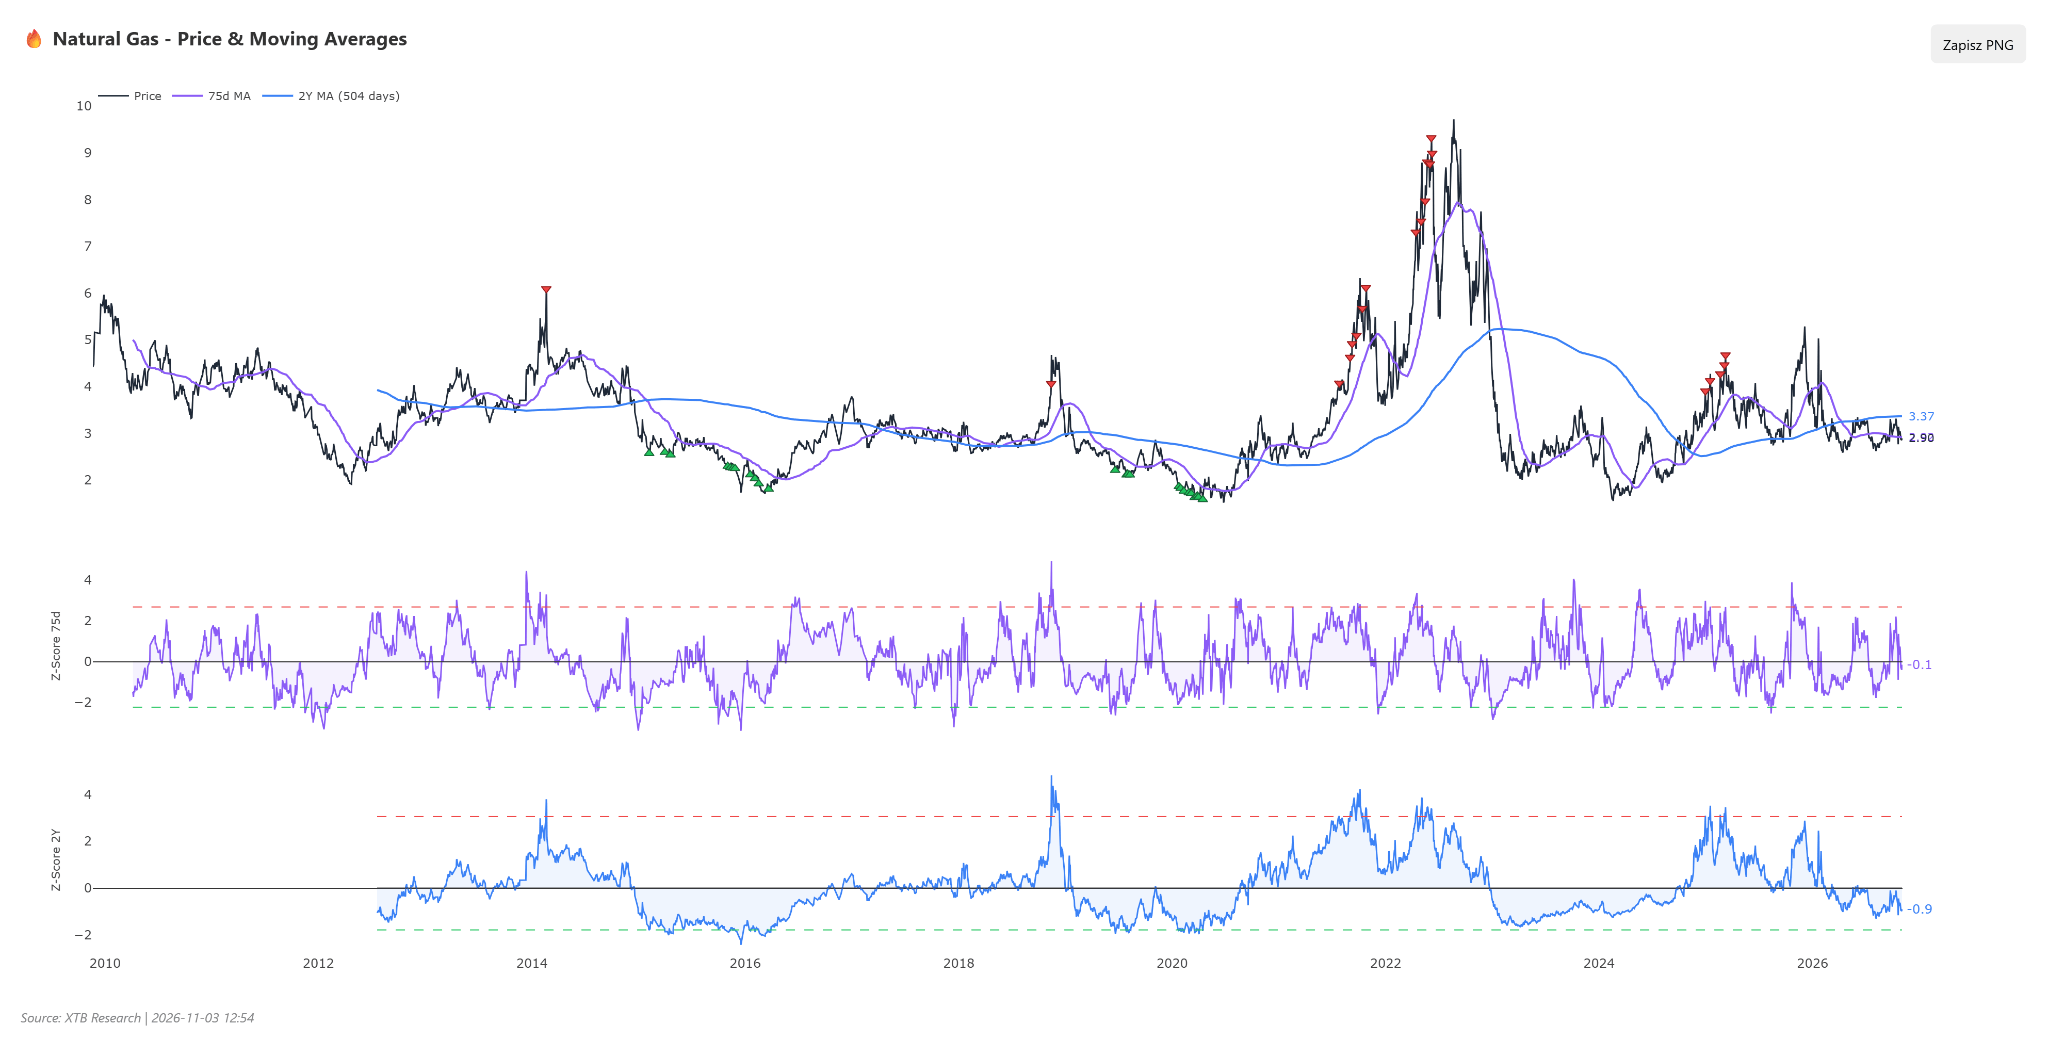
- US Henry Hub natural gas prices (NATGAS) are hovering around $2.9/MMBtu, down 4.9% week-on-week, 4.4% month-on-month, and over 20% year-to-date.
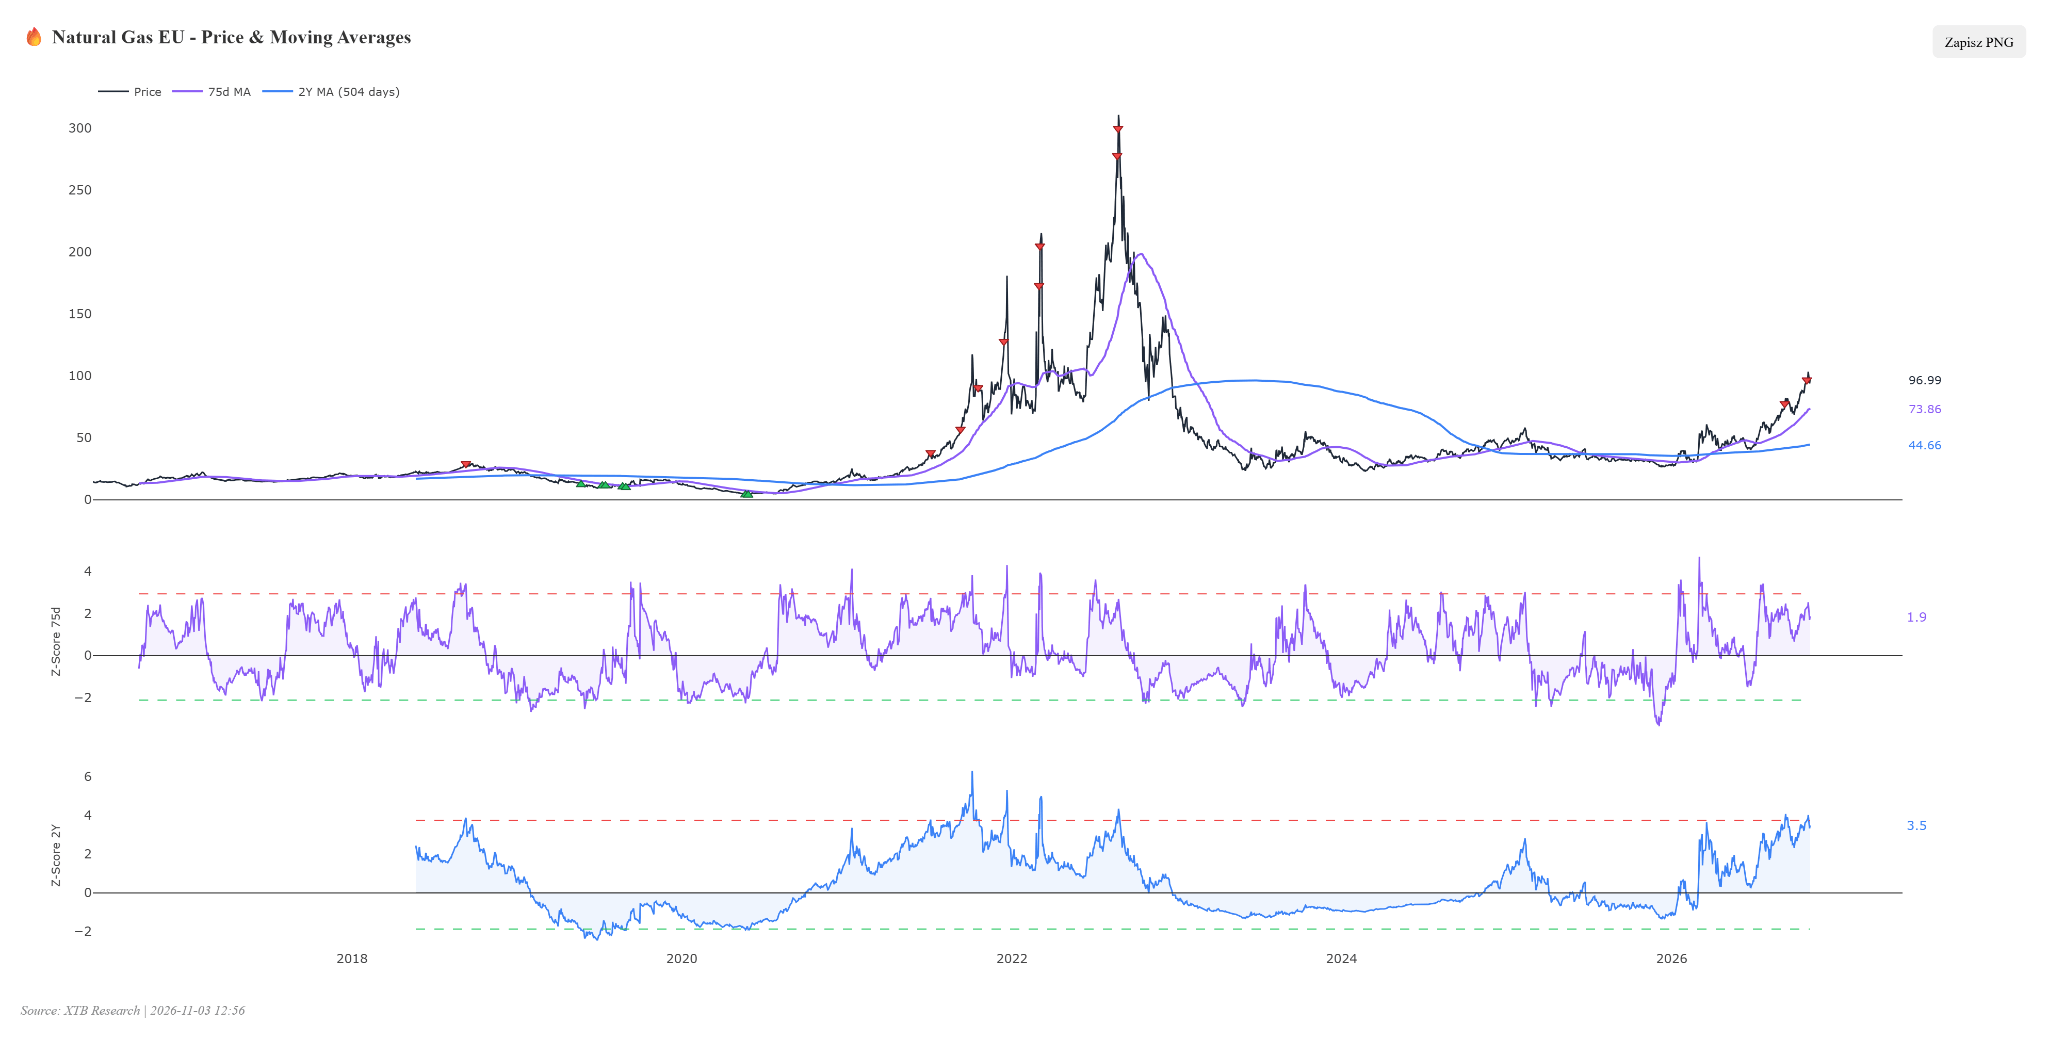
- Meanwhile, the European TTF benchmark (NATGAS.EU) is trading at completely different levels – the price is around 99 EUR/MWh, which after rising 1.8% in a week and 29.3% in a month represents a year-to-date increase of as much as 242.2%.
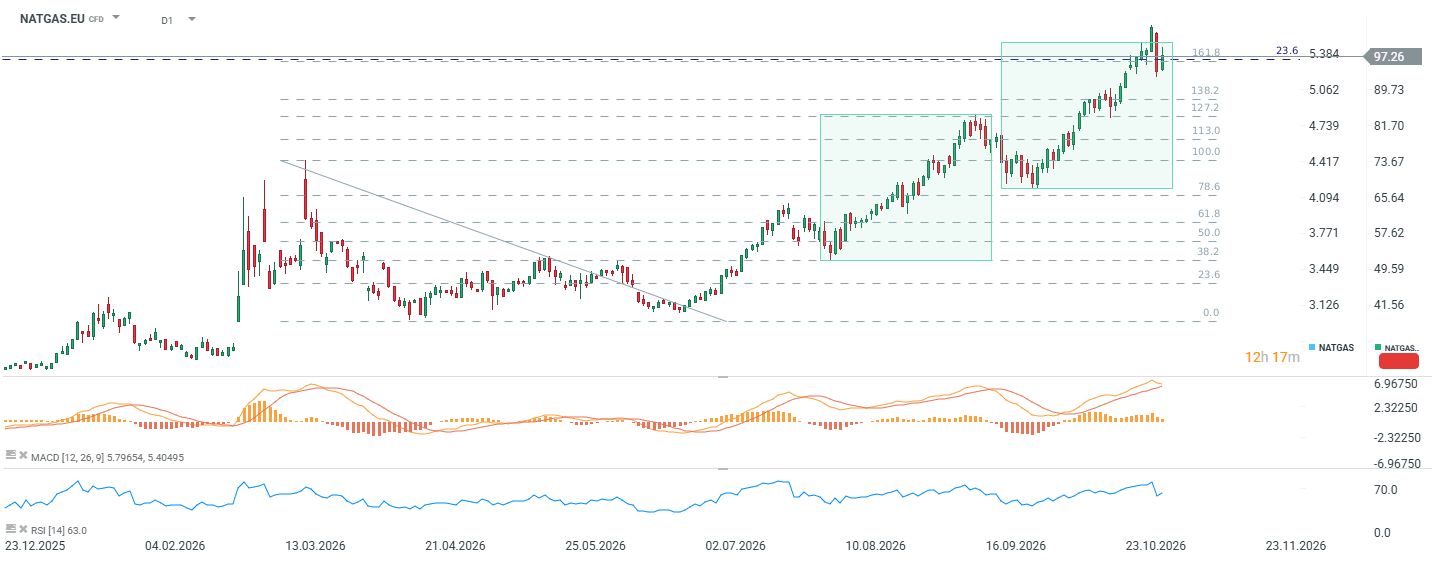
- The RSI for the US market stands at 45 points, which together with a bearish MACD setup and the price sitting 3.5% below the 50-period moving average indicates weakening momentum, although the market is not yet oversold. In the European market, the technical setup is distinctly bullish: RSI at 64, bullish moving average and MACD signals, and the price trading over 22% above its 50-period moving average confirm buyer dominance.
- The nearest support zone for the US contract lies near $2.8, with key resistance around $3.0–$3.1. For European gas, local support is located around 90–92 EUR, while the main supply barrier sits in the 102–105 EUR zone.
Fundamental and Market Context
- US natural gas storage inventories increased by 80 billion cubic feet (Bcf) last week, exceeding analyst expectations of 75 Bcf and accelerating from the 77 Bcf reported the previous week.
- Total US gas storage reached 3.724 trillion cubic feet (Tcf), putting it 3.8% below year-ago levels but still 1% above the 5-year seasonal average.
- Production across the Lower 48 US states rebounded to around 113.3 Bcf/d, increasing domestic supply availability.
- Weather forecasts for the United States predict above-normal temperatures through at least November 13, limiting early heating demand.
- Feedgas flows to the nine major US LNG export terminals rose to an average of 18.5 Bcf/d in October compared to 17.9 Bcf/d in September, acting as a key outlet for domestic oversupply.
- European gas storage facilities were only 74.56% full as of November 2, a level significantly below historical norms for the start of the heating season.
- Gas reserves in Germany stood at 151.01 TWh with imports at 256,626 terajoules, while storage facilities in France held 107.04 TWh with imports of 149,780 terajoules.
- An expected cold snap in Northern and Central Europe this week is forcing earlier-than-usual storage withdrawals by the municipal heating sector.
- The US military strike on Iran’s Qeshm Island and ongoing shipping disruptions in the Strait of Hormuz have fueled fears of cuts to Middle Eastern LNG cargoes bound for Europe.
- Reports of possible negotiations to unblock the Strait of Hormuz caused a brief drop in European prices of over 8%, after which the market quickly recovered losses due to fears of tanker paralysis.
- Russian missile strikes damaged energy infrastructure facilities in 10 Ukrainian regions, increasing pressure on the energy balance in the eastern part of the continent.
- The CEO of Saudi Aramco officially warned that global energy markets will face severe supply tightness in the upcoming winter.
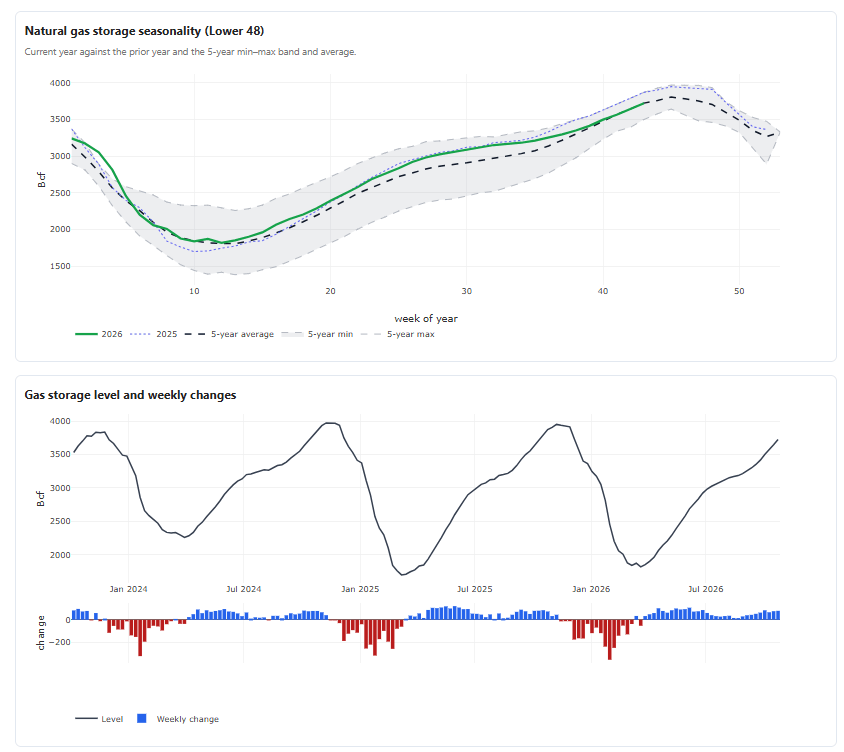
US inventories are hovering near the 5-year average. The standard storage withdrawal season should begin in the coming weeks. Source: EIA, XTB
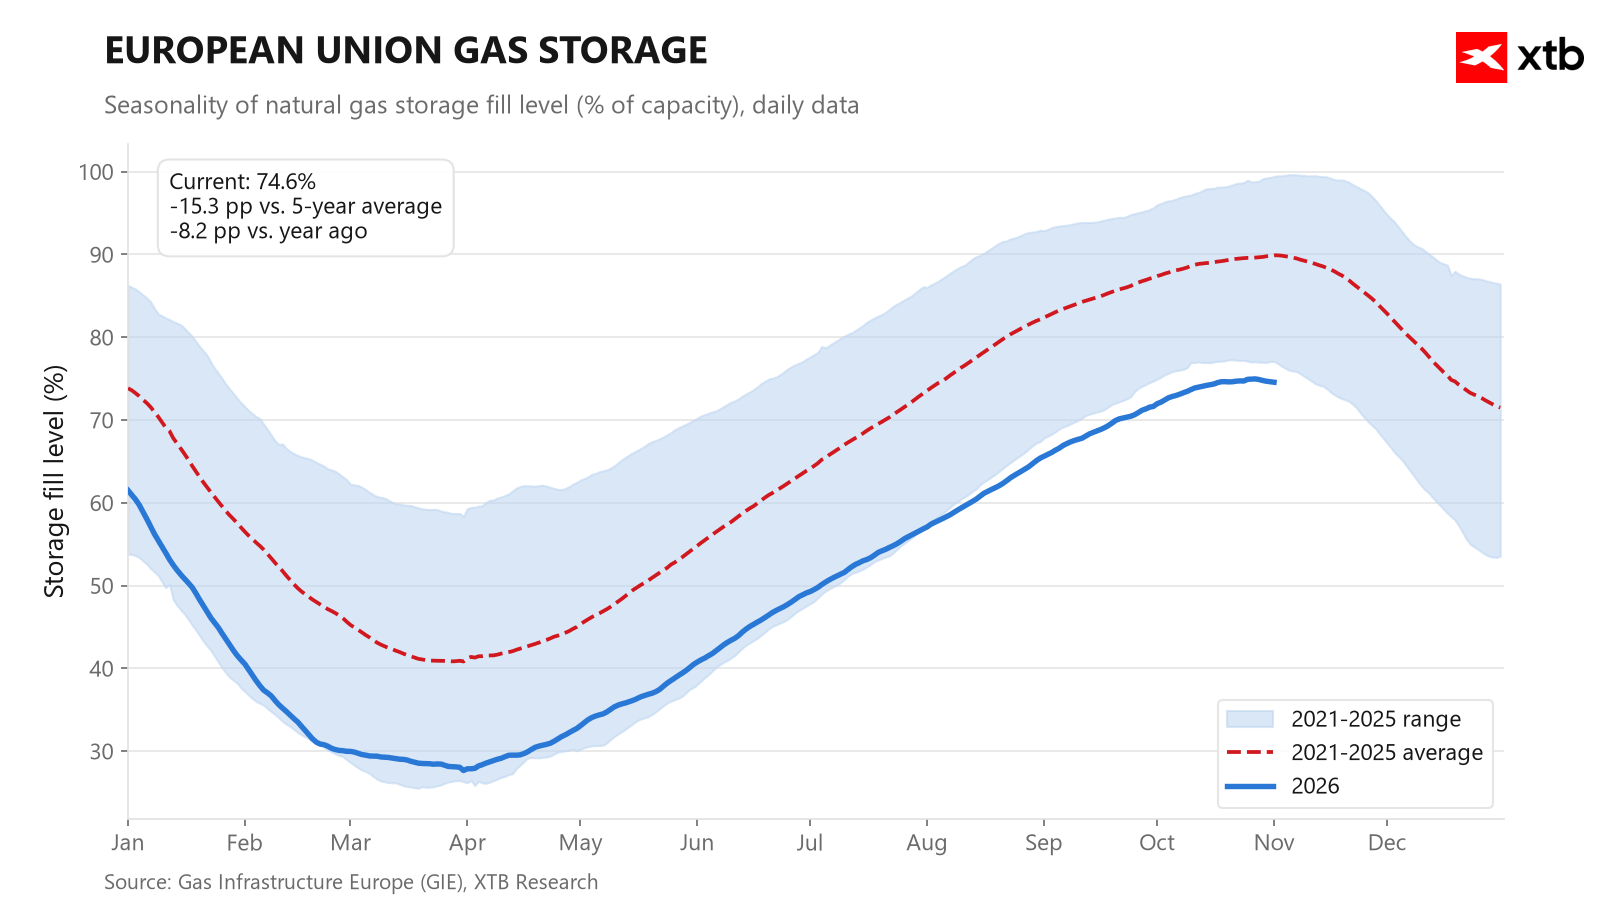
The situation in Europe appears quite tense at the moment, as gas storage withdrawals started relatively early. However, December and January performance will be crucial. Source: GIE, XTB
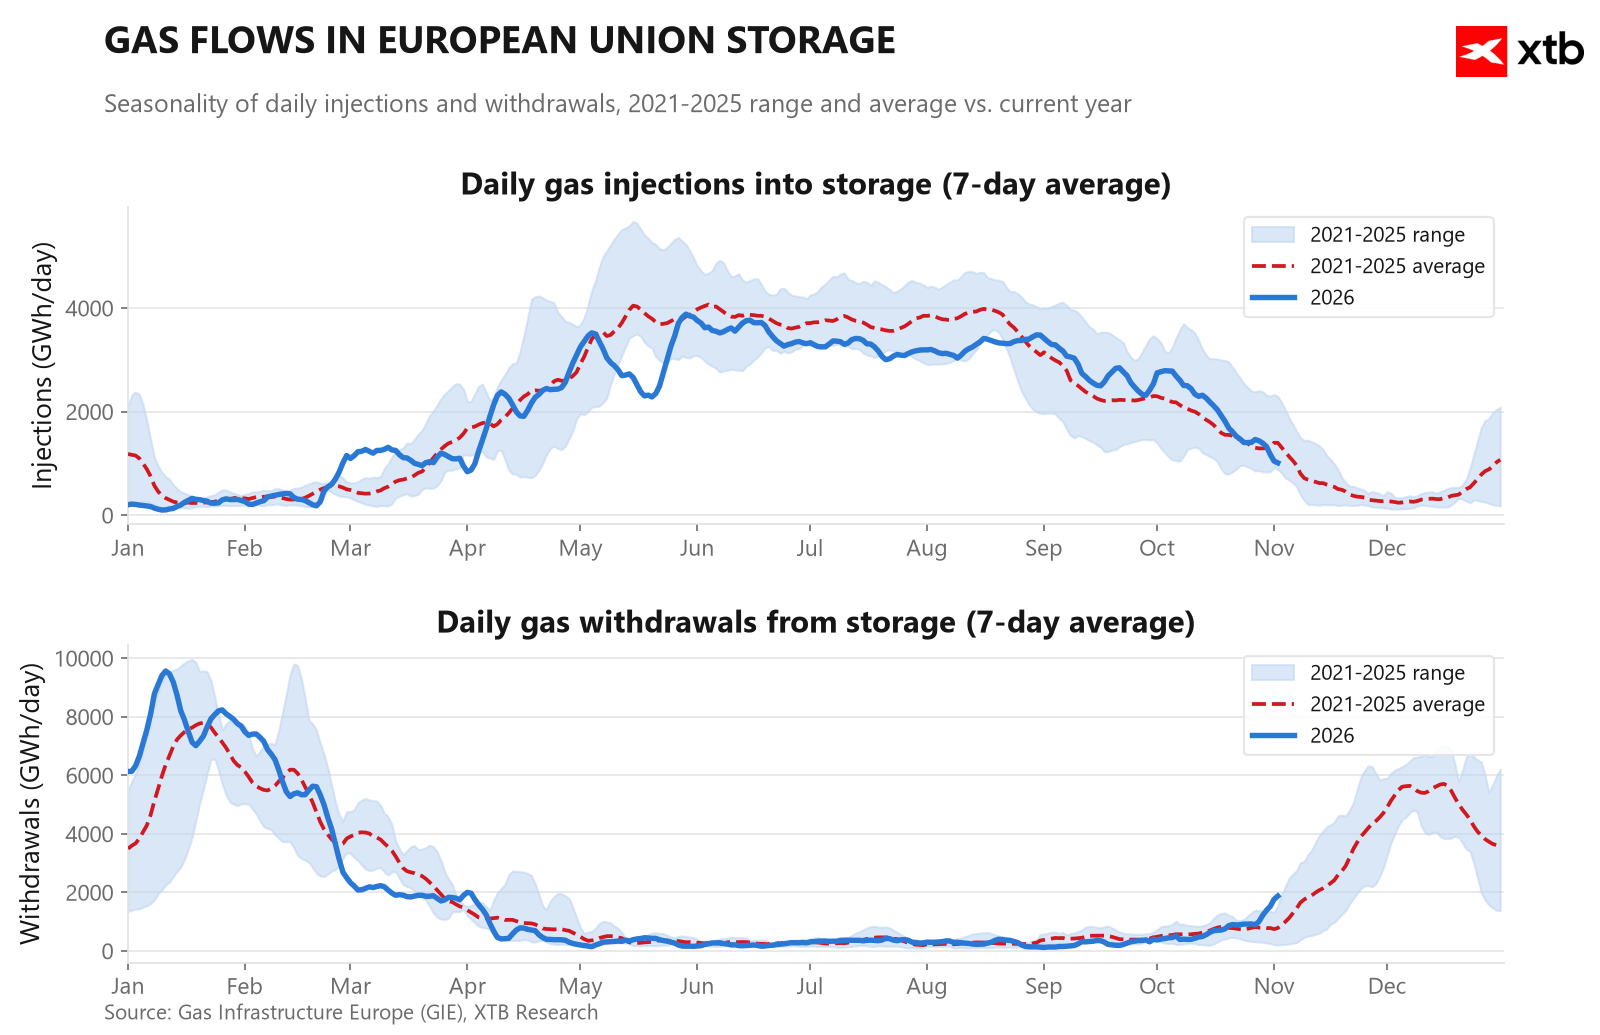
Storage withdrawals are taking place faster than usual. Source: Bloomberg Finance LP, XTB
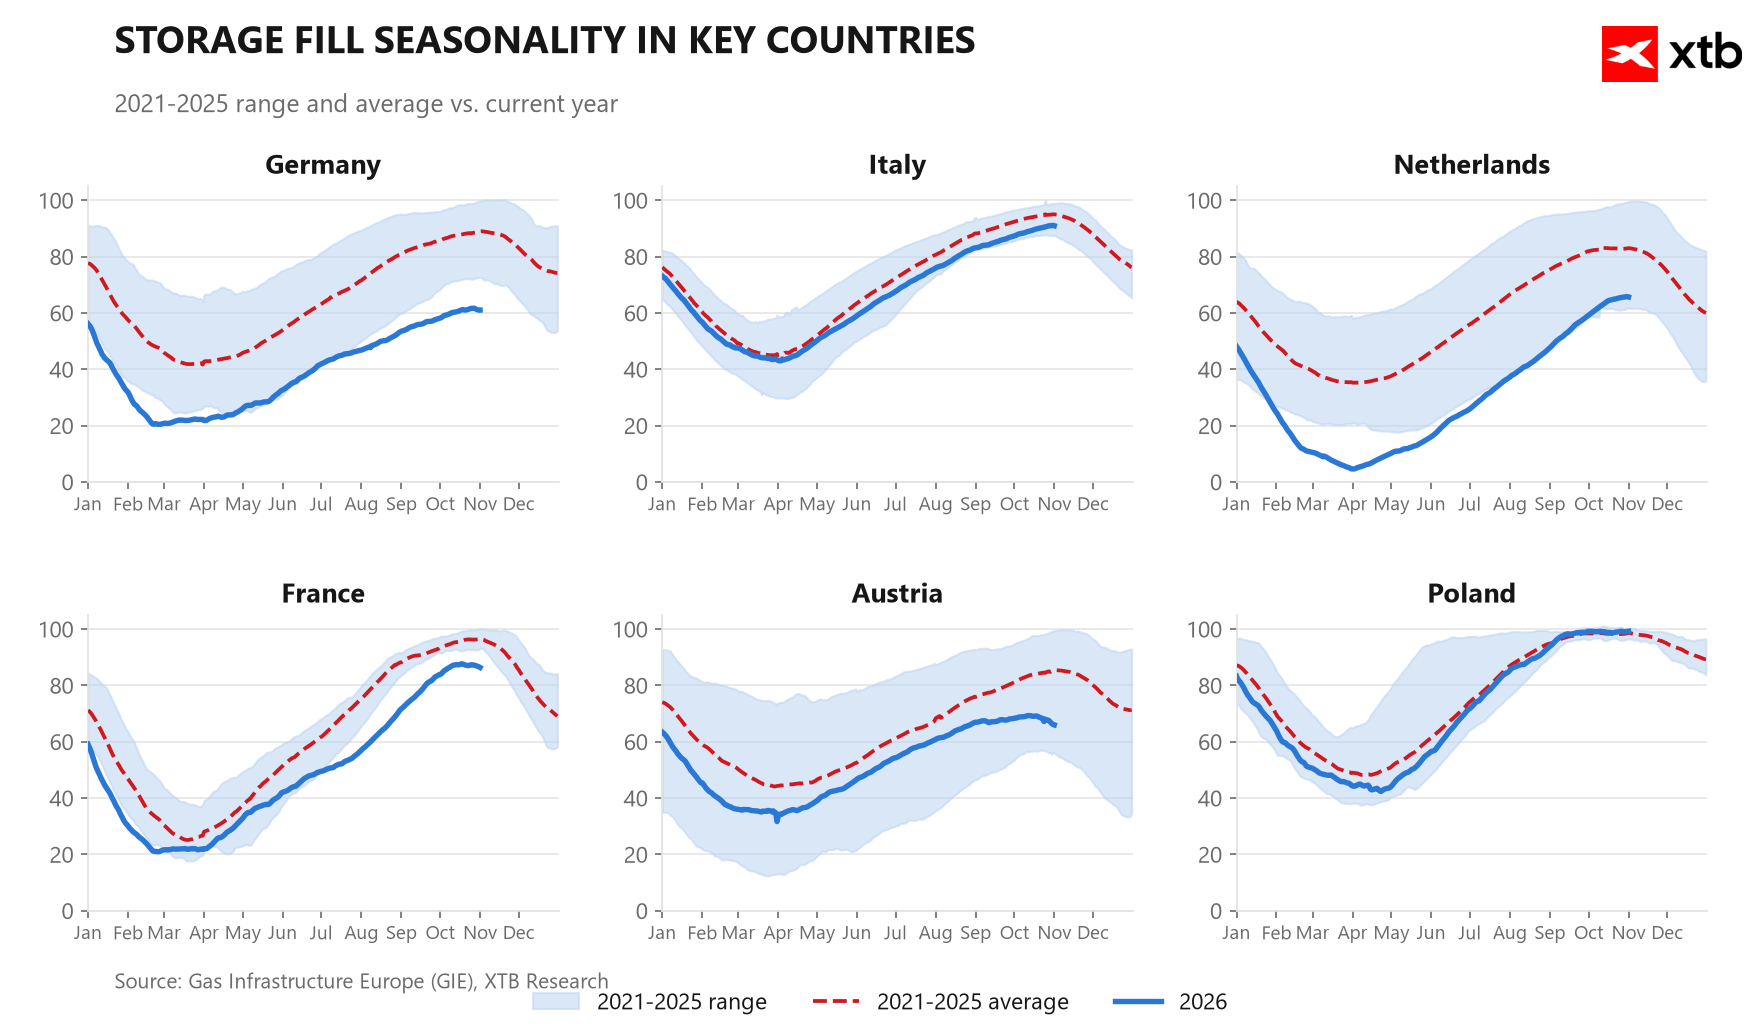
Storage levels in individual countries. Germany currently looks the worst, although its total storage capacity is very large. Nevertheless, in an extreme scenario, halting energy-intensive industries may be necessary if the upcoming winter turns out to be very cold. Source: GIE, XTB
Historical Valuation and Fund Positioning
Against multi-year valuation patterns, both markets sit at opposite extremes, creating an unprecedented spread widening between the two benchmarks. In the US, gas remains structurally cheap – valued moderately below the 5-year average (by less than half a standard deviation) and stabilizing in this area for several months, after being even more discounted relative to long-term averages six months and a quarter ago.
A completely different picture emerges in Europe. On the TTF benchmark, prices are extremely high compared to 1-year and 2-year averages (over 2.6 and nearly 3.6 standard deviations above normal, respectively). Relative to its 5-year average, the European contract has undergone a dynamic journey: just six months ago it was trading below long-term norms, before breaking out sharply higher in recent months driven by fears over physical LNG availability.
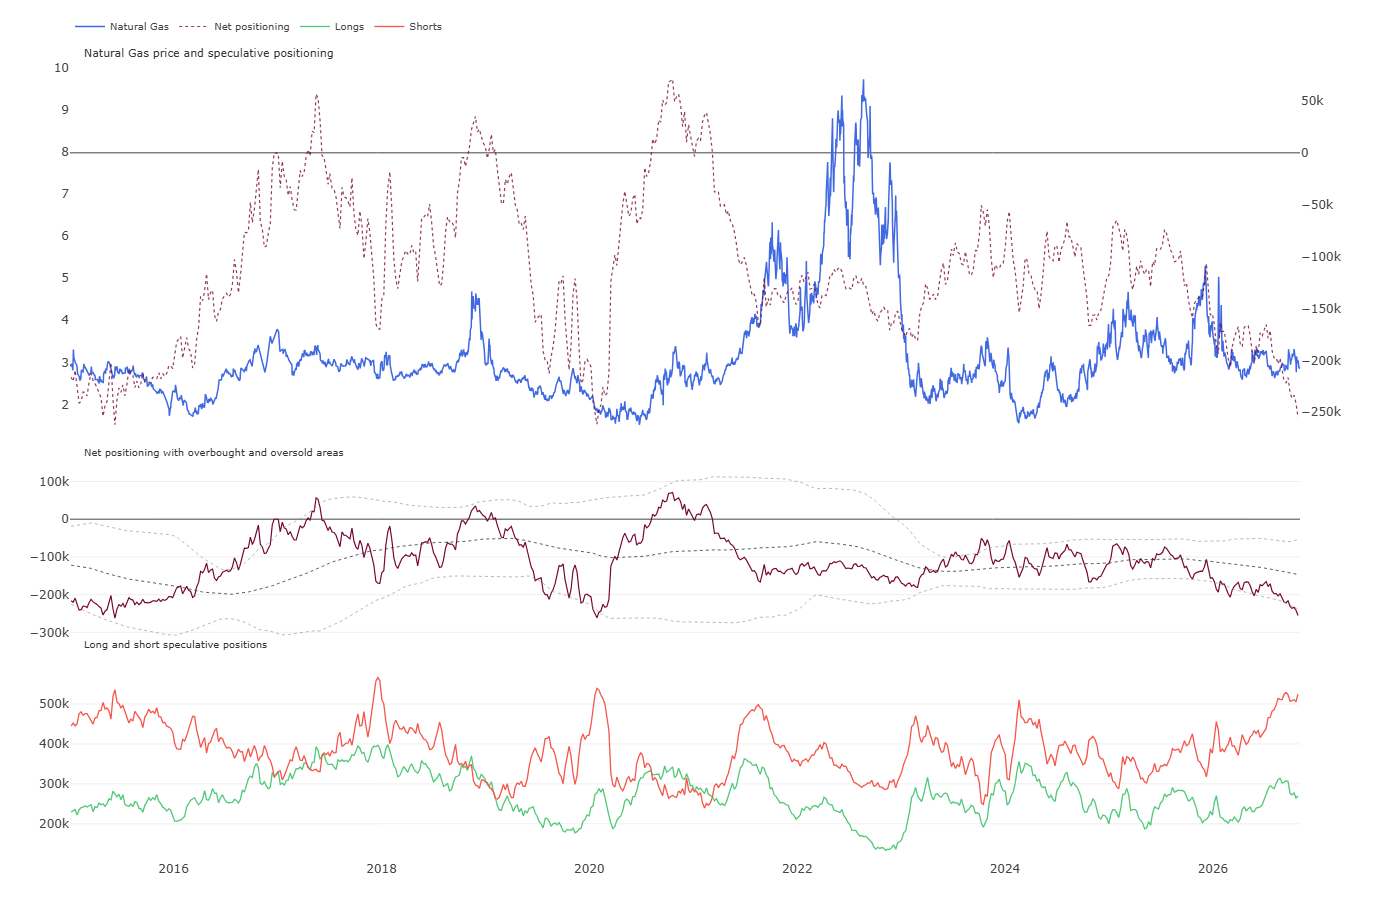
The stark fundamental divergence is confirmed by speculative fund positioning in the US market, as reported by the CFTC. Institutional investors hold an aggressively bearish stance – net positioning stands around -255k contracts, placing current sentiment in the bottom 0.2% of historical readings. Long positions account for a modest 33.9%, and funds expanded short exposure by nearly another 14k contracts last week. Such deep speculative pessimism in the US reflects abundant current production, yet creates an asymmetric risk of a sharp price rally (short squeeze) in the event of a sudden cold snap. In Europe, by contrast, such a high market premium leaves prices vulnerable to a sudden diplomatic breakthrough in the Middle East.
Scenarios
- Bullish Scenario: A sustained blockade of the Strait of Hormuz paralyzing Qatari LNG shipments to Europe, combined with a severe winter cold snap accelerating storage depletion below 70% capacity, will push European benchmarks higher. Meanwhile, increased gas intake by US export terminals above 19 Bcf/d alongside a sudden drop in US temperatures would support Henry Hub. Technical confirmation of this setup would be a breakout above $3.1/MMBtu in the US and breaking resistance near 102 EUR/MWh in Europe, opening the door toward $3.4–$3.6/MMBtu and 115–120 EUR/MWh, respectively.
- Bearish Scenario: Effective de-escalation of the military blockade around Iran, formalizing terms for unhindered transit through the Strait of Hormuz, and a return to mild weather in Europe would reduce the geopolitical premium on TTF. Concurrently, US production remaining above 113 Bcf/d with weekly storage injections exceeding 80 Bcf would deepen pressure on Henry Hub. The signal for this scenario would be pushing US contracts below support at $2.8/MMBtu and breaking the European 90 EUR/MWh level, directing prices toward $2.5–$2.6/MMBtu in the US and 75–80 EUR/MWh in Europe.
Wheat
Technical Analysis
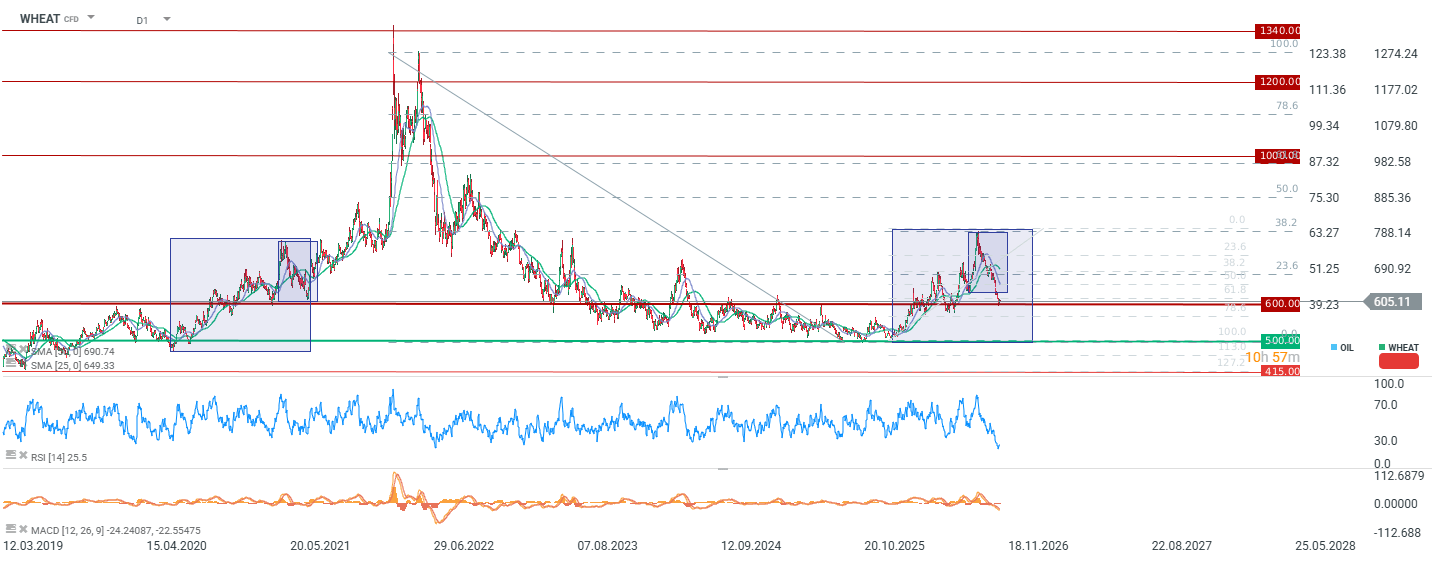
- Wheat prices are currently hovering around 605 cents per bushel; weekly performance shows a 1.4% drop, declining 11.6% over the month, while retaining a 19.2% gain year-to-date and 9.9% relative to the same period last year.
- The RSI indicator has dropped to 25 points, signaling an extremely oversold short-term condition, with the price sitting 12.7% below its 50-period moving average alongside negative MACD signals, even as the long-term simple moving average (SMA) maintains a bullish posture.
- The nearest key technical support runs around the round level of 590–600 cents per bushel, while the first significant resistance zone stretches across 630–640 cents.
Fundamental and Market Context
- Global wheat production is estimated to reach the second-highest level in history, significantly easing market concerns over global grain availability.
- US wheat inventories rose to 1.85 billion bushels compared to 0.92 billion bushels recorded in the prior reporting period.
- Vladimir Putin signaled readiness to resume tripartite peace negotiations involving the US and Ukraine in early November, reducing the geopolitical risk premium.
- Ukraine’s Ministry of Agriculture forecasts an 18% decline in winter wheat planted area ahead of next year’s harvest.
- Inflows of new-crop grain from expanding harvests in Australia and Argentina are increasing physical supply in export markets.
- Weekly US wheat export sales for the week ending October 15 came in below market expectations.
- Russia increased wheat shipments via alternative routes, stepping up transshipment through Baltic Sea ports among others.
- In the Black Sea basin, localized commercial shipping disruptions persist due to recurring attacks on coastal infrastructure.
- The US Department of Agriculture (USDA) released an updated crop condition report for winter wheat for the week ending November 1.
- Chinese trade representative Li met with a delegation from the US agricultural sector to discuss ongoing commodity trade.
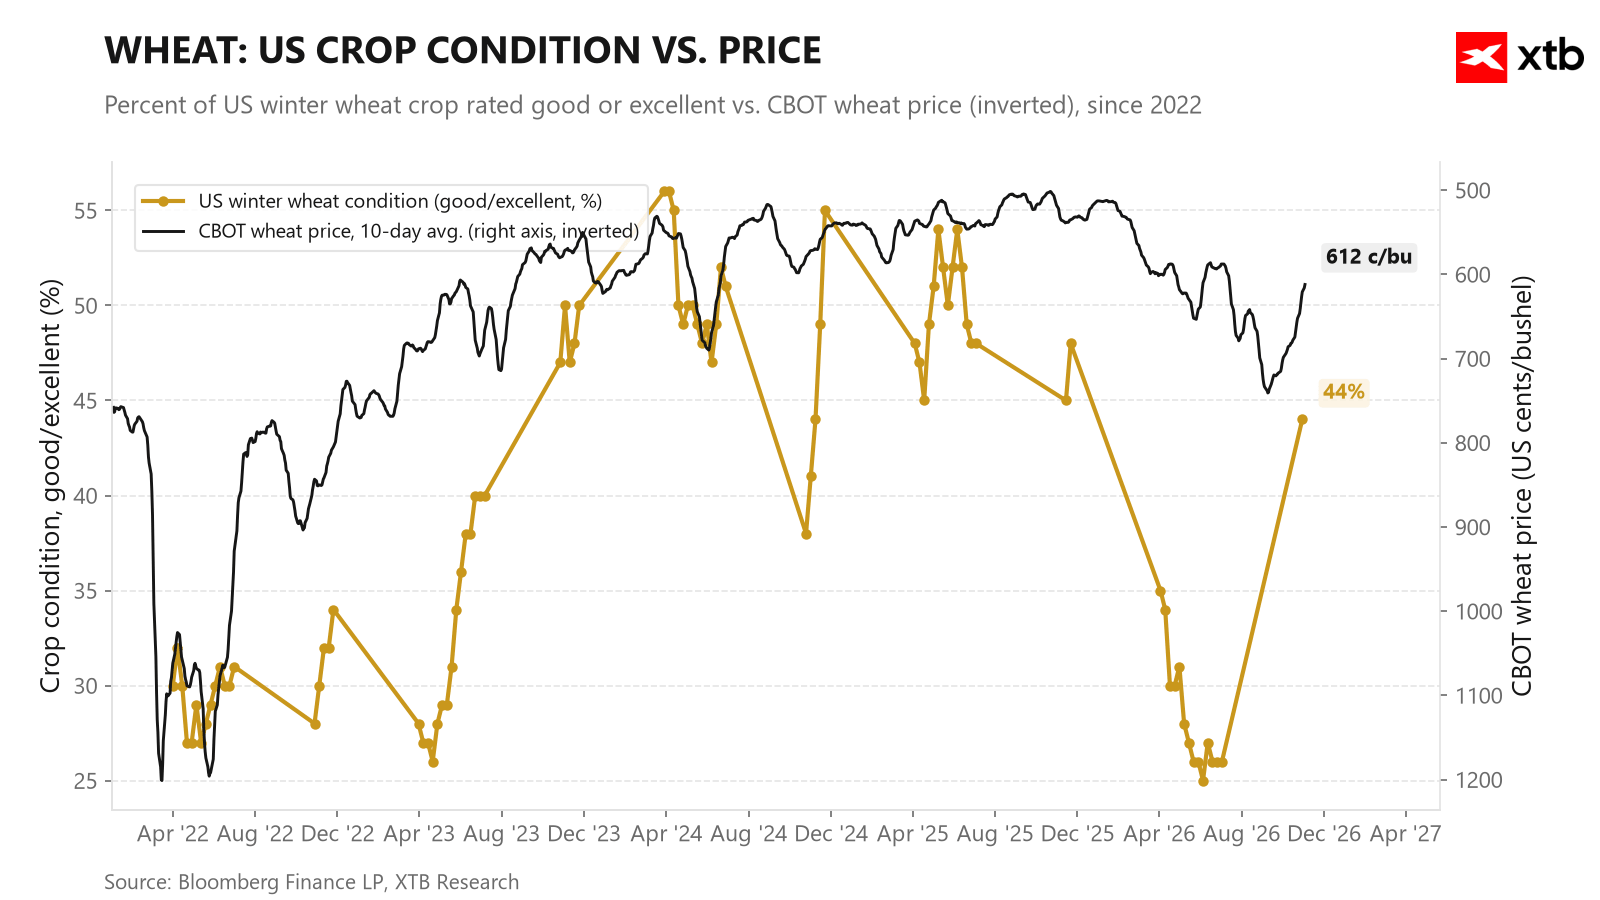
A clear uptick in early-season winter wheat ratings points to potential pressure next season. However, if the upcoming winter turns dry, conditions could deteriorate heading into spring. Source: Bloomberg Finance LP, XTB
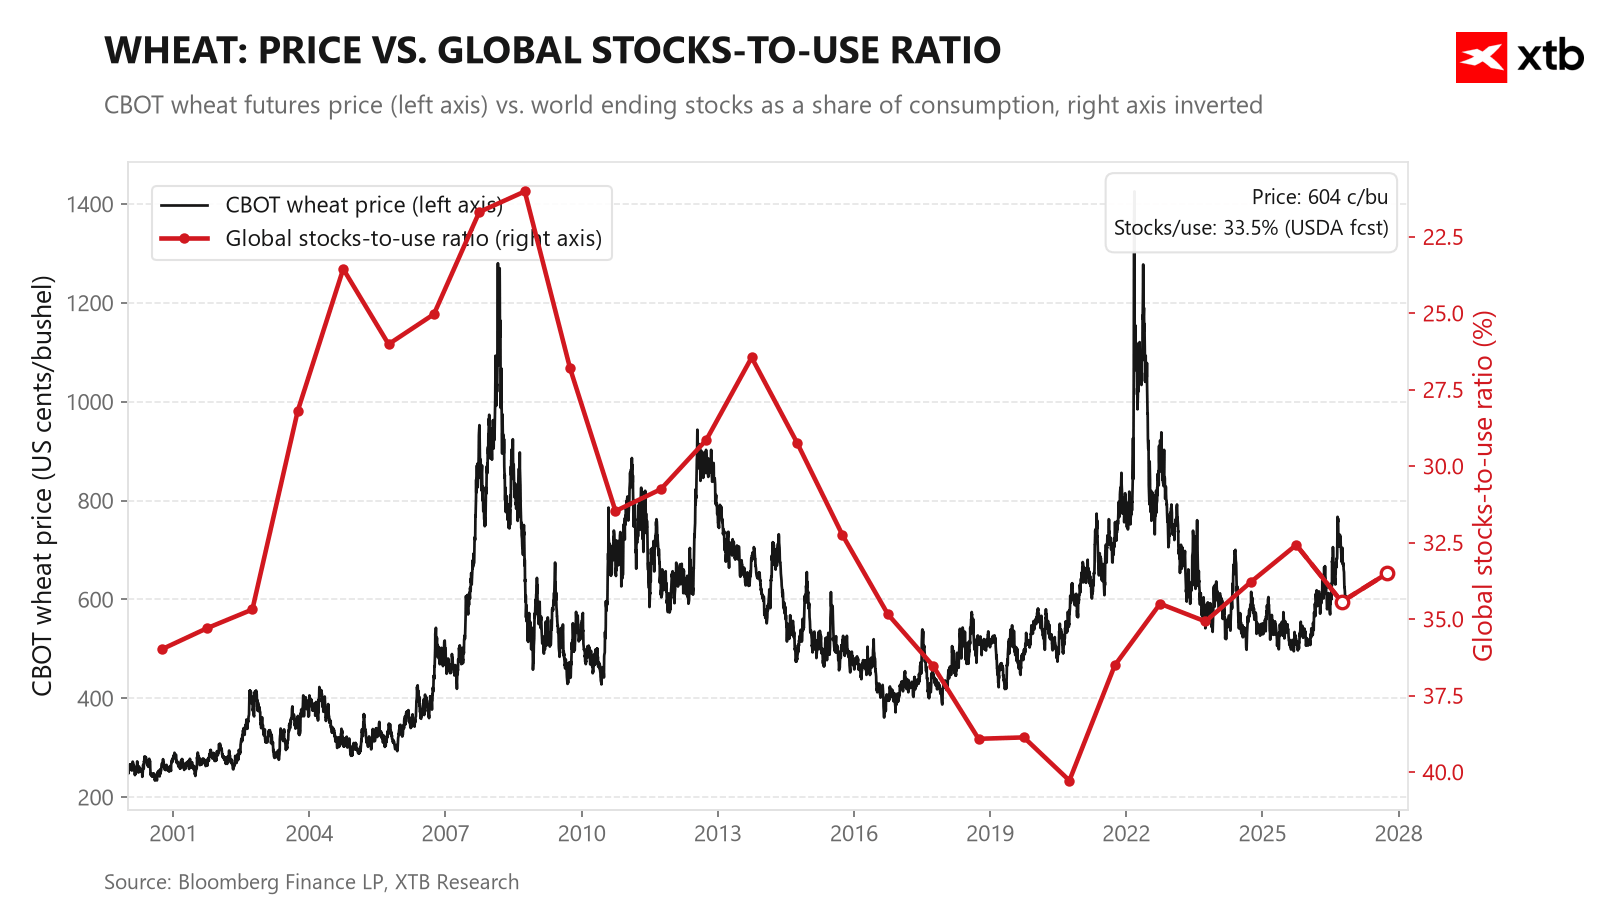
Stocks-to-use ratios have stabilized in recent seasons without sending clear signals. On the other hand, this indicator sits lower than in 2022 or 2023. Source: Bloomberg Finance LP, XTB
Historical Valuation and Fund Positioning
Wheat valuations have returned to areas well below long-term averages in recent weeks. Relative to its 5-year average, prices are moderately below normal (by 0.4 standard deviations). Six months ago, prices traded close to long-term averages before deepening losses three months ago, then temporarily breaking above the 5-year average a month ago. The latest sell-off abruptly wiped out that premium, pushing valuations back into discounted territory, though prices remain slightly above 2-year averages.
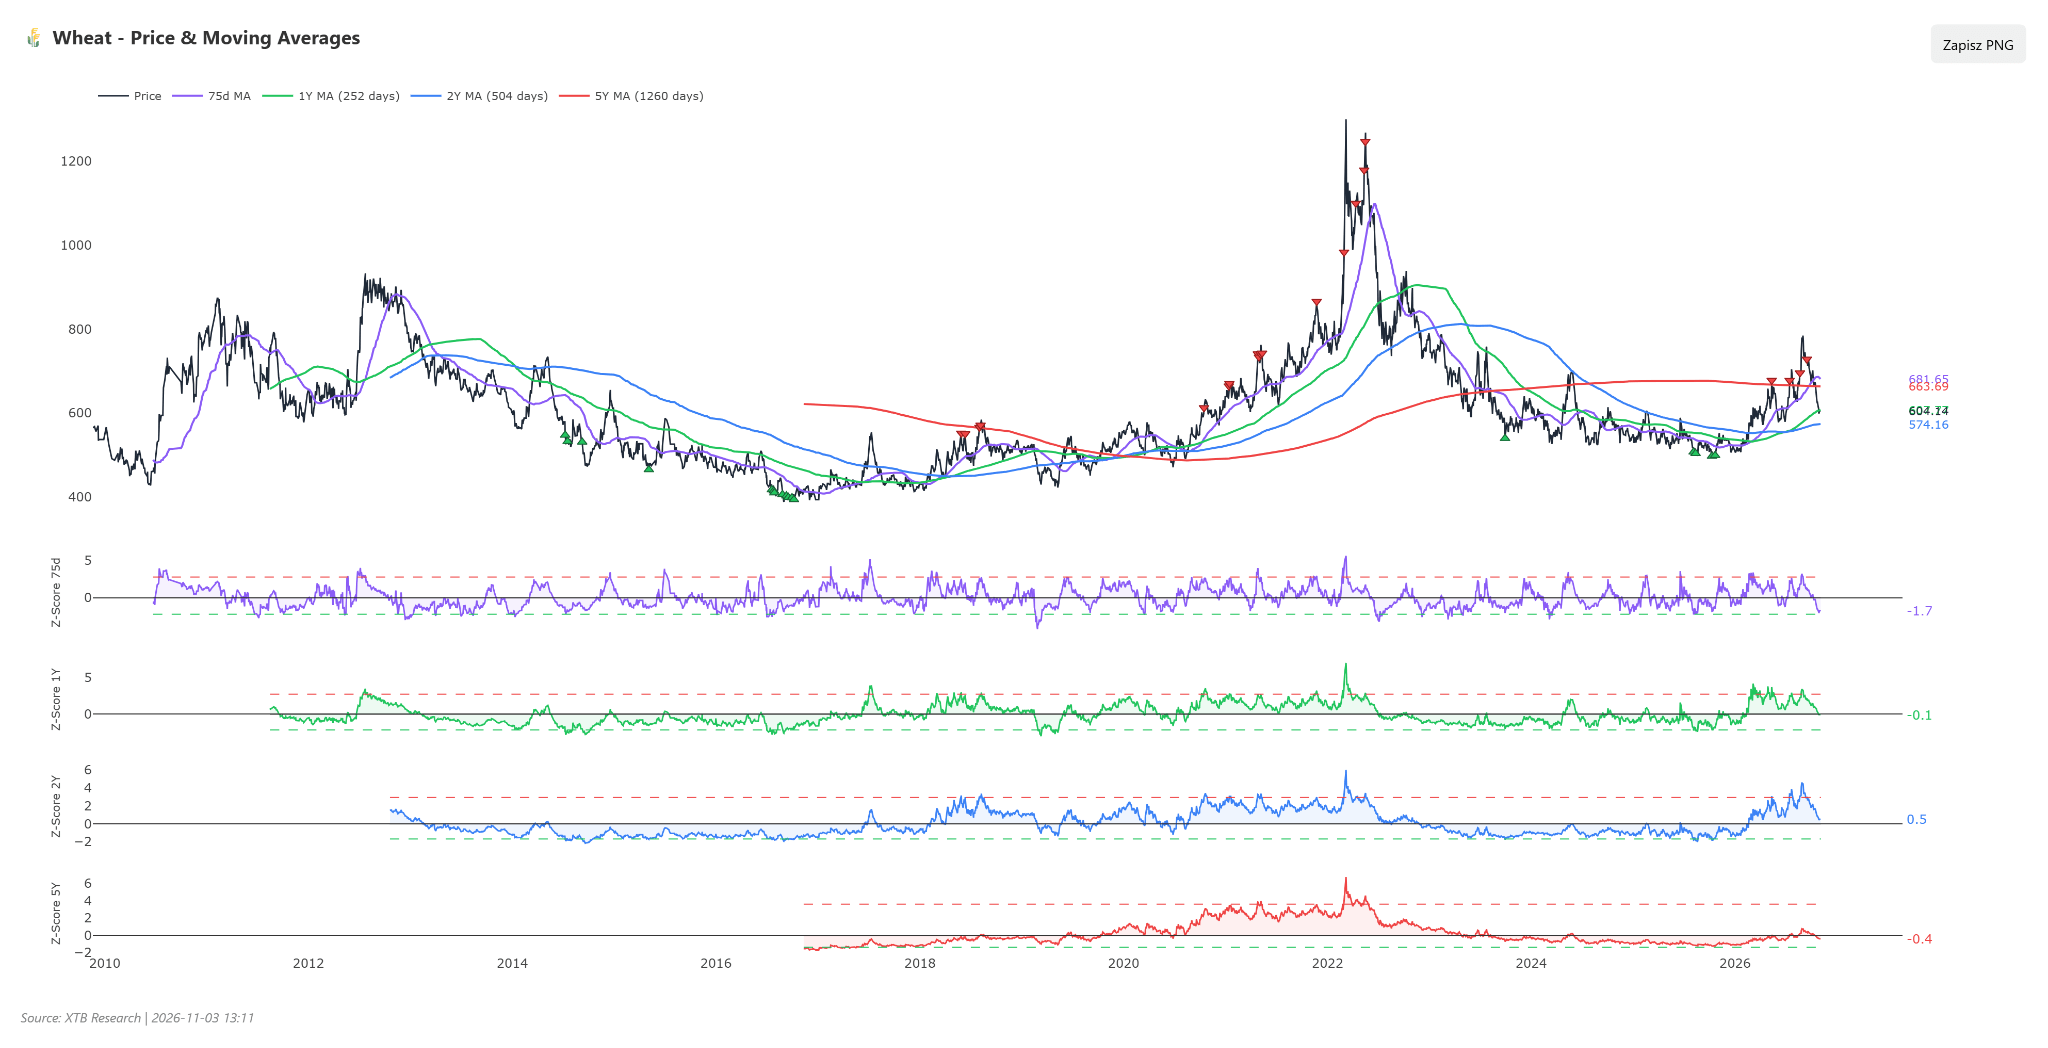
Pessimism dominates financial investor positioning. Speculative funds maintain a net short position of around 51k contracts, after increasing short exposure by over 21k contracts last week. Such defensive positioning is rare historically – current positioning sits at just the 16th percentile, with long positions accounting for only 41.2% of total exposure. The combination of relatively low valuations and extreme bearish fund sentiment creates asymmetric upside risk should managers be forced into quick short covering triggered by an unexpected supply shock.
Scenarios
- Bullish Scenario: In the event of a breakdown in scheduled November tripartite peace talks and intensified attacks on Black Sea routes, alongside confirmation of an 18% cut in Ukrainian winter crop acreage, the geopolitical risk premium would quickly return. Technical confirmation of this scenario would be a price recovery above resistance at 630–640 cents per bushel, opening the door for buyers toward the 670–690 cent area.
- Bearish Scenario: Progress in diplomatic negotiations and the opening of traditional maritime corridors, alongside supply pressure from near-record global harvests and exports from Argentina and Australia, would weigh further on grain prices. Confirmation of seller dominance would come from a sustained breakdown below psychological support at 590–600 cents per bushel. In that setup, prices could head toward 550–570 cents.
Gold
Technical Analysis
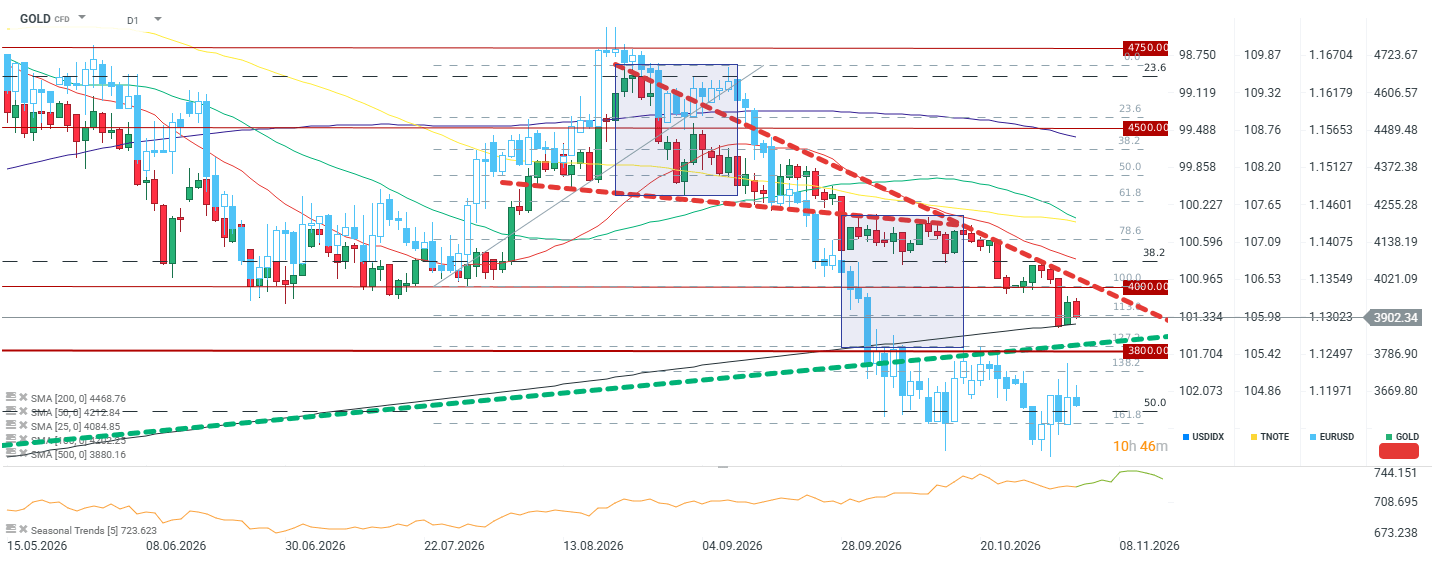
- Gold prices are hovering near $3,900/oz, down 4.1% over the week, 5.9% for the month, 10.0% year-to-date, and 0.9% compared to the same period last year.
- The RSI indicator sits at 34 points, approaching oversold territory, while moving average (SMA) signals and the MACD indicator remain bearish with the price sitting 7.5% below its 50-period moving average, confirming a clear medium-term supply advantage.
- The nearest key support zone lies around $3,800, while the first major technical resistance sits in the $3,950–$4,000 area.
Fundamental and Market Context
- The US military strike on Iran’s Qeshm Island heightened fears of renewed inflationary pressures, limiting room for Federal Reserve interest rate cuts.
- Sustained high US Treasury yields raise the opportunity cost of holding non-yielding precious metals.
- An Iranian government spokesperson stated that the ball is in Washington’s court regarding a potential agreement to end military conflict.
- President Donald Trump suggested on social media that the Iranian side seeks to reach a diplomatic settlement with the US as quickly as possible.
- Diplomats from the US, Russia, and China are probing the possibility of organizing a trilateral summit, curbing safe-haven demand for gold.
- A sell-off in AI and technology stocks triggered a widespread flight to liquidity and forced margin liquidation across metals markets.
- Political uncertainty ahead of US midterm elections rose amid potential Democratic control of both houses of Congress.
- Structural de-dollarization of reserve assets in emerging markets provides a long-term demand cushion for physical gold despite current liquidity turbulence.
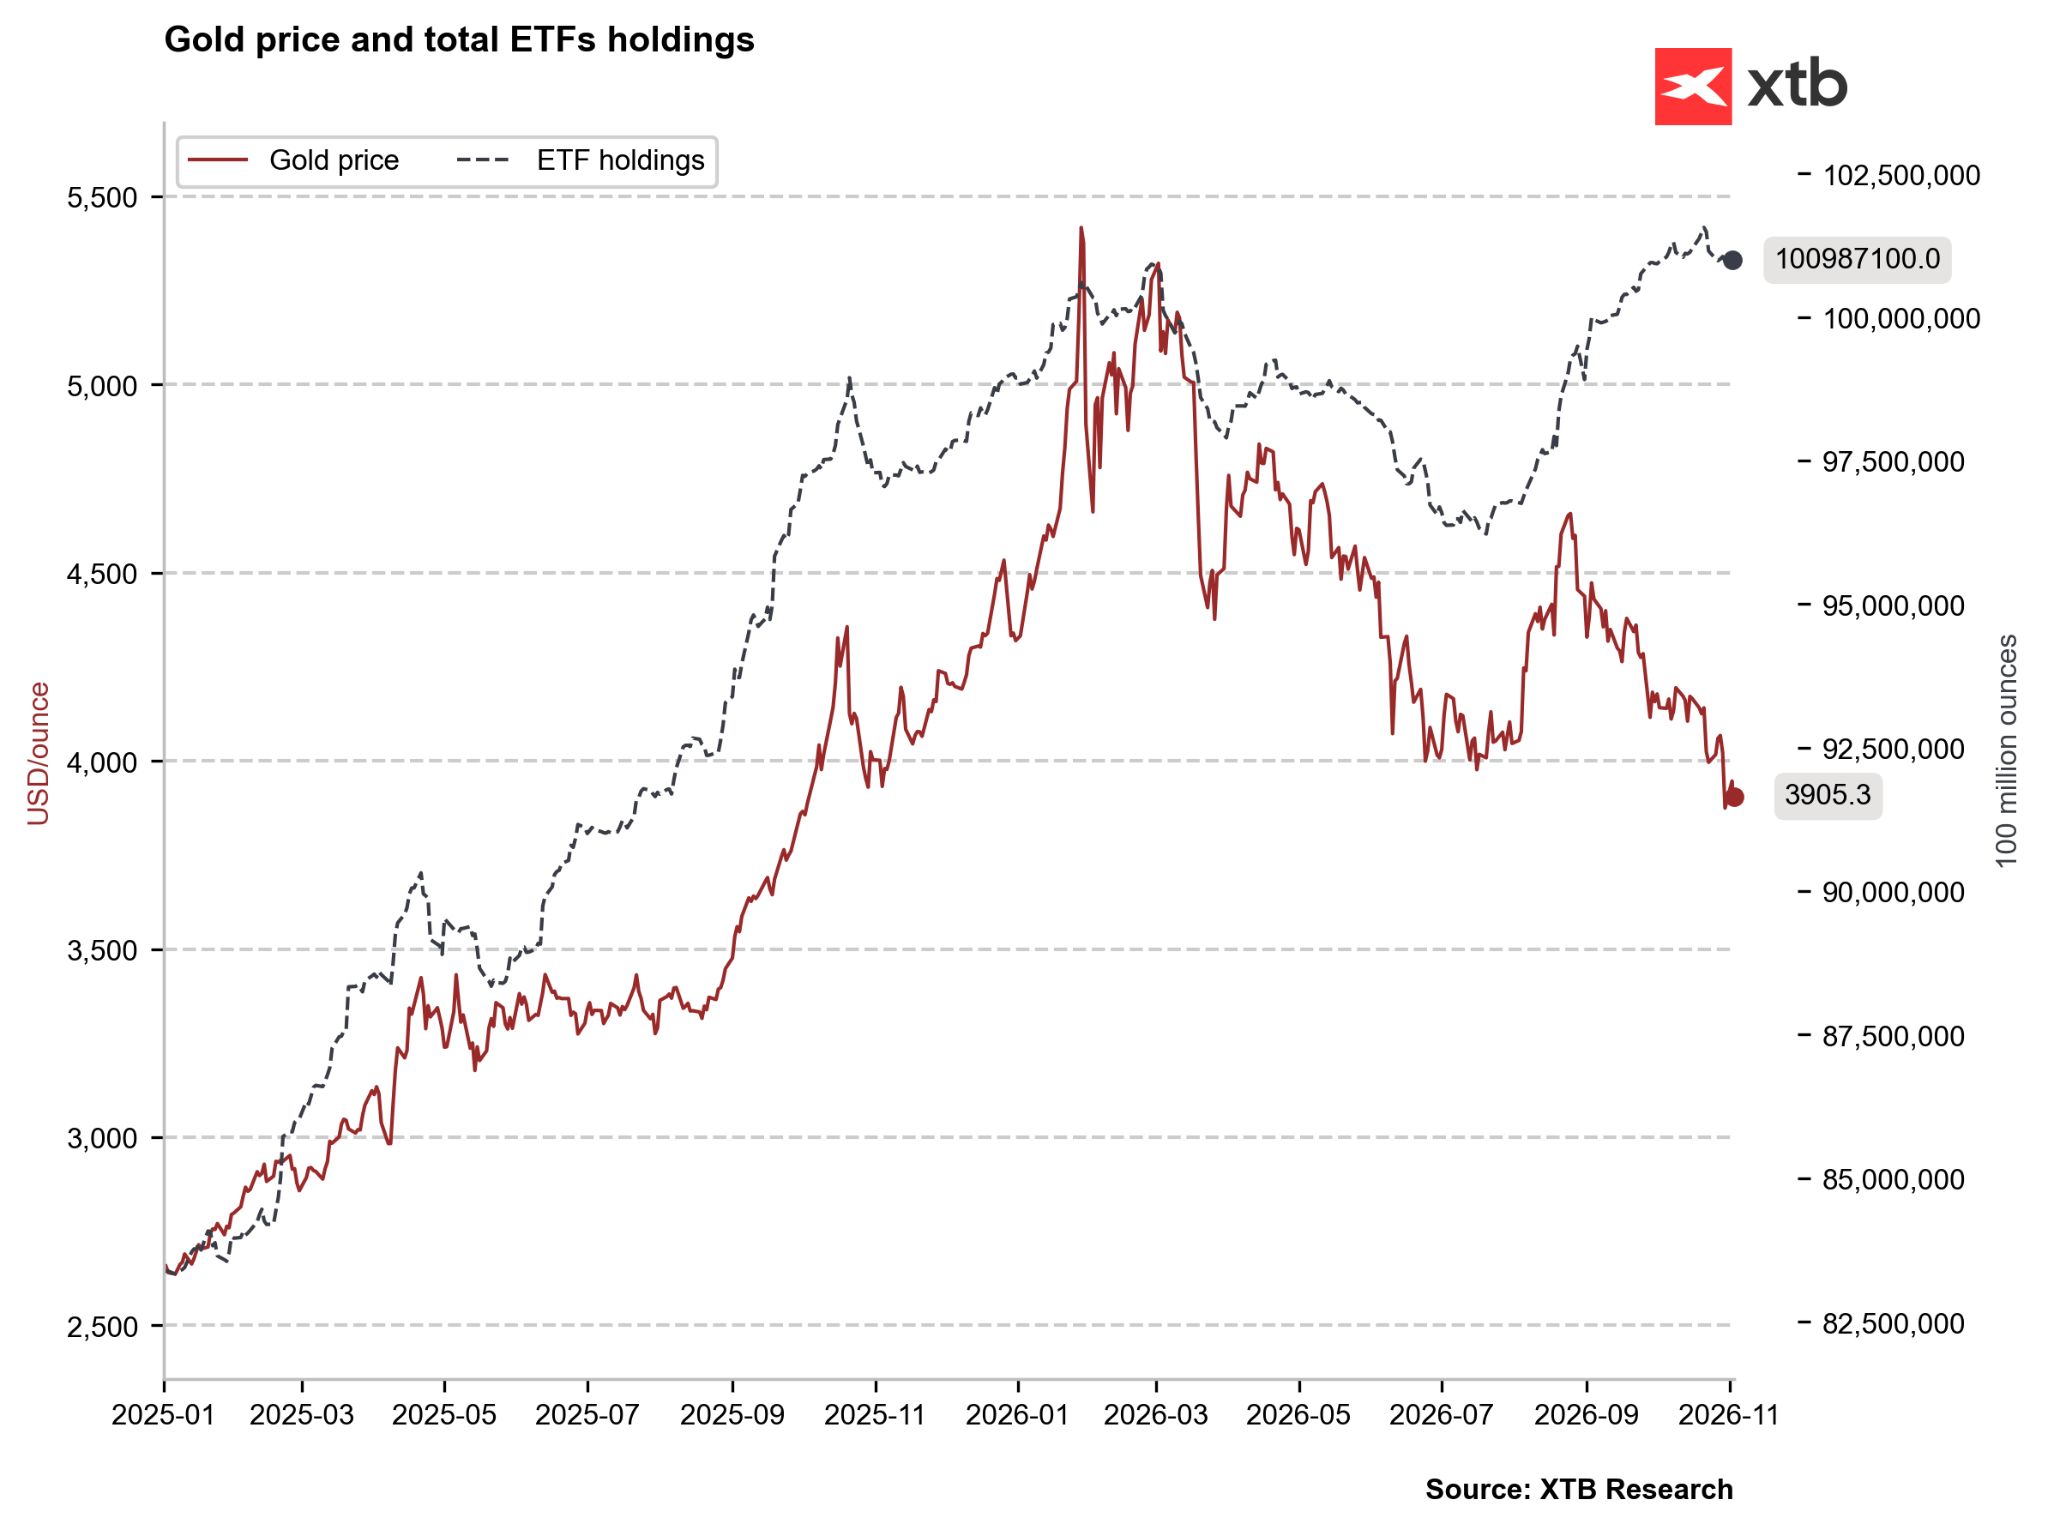
ETF funds slightly reduced gold holdings in vaults recently, but it is not a sharp correction. Source: Bloomberg Finance LP, XTB
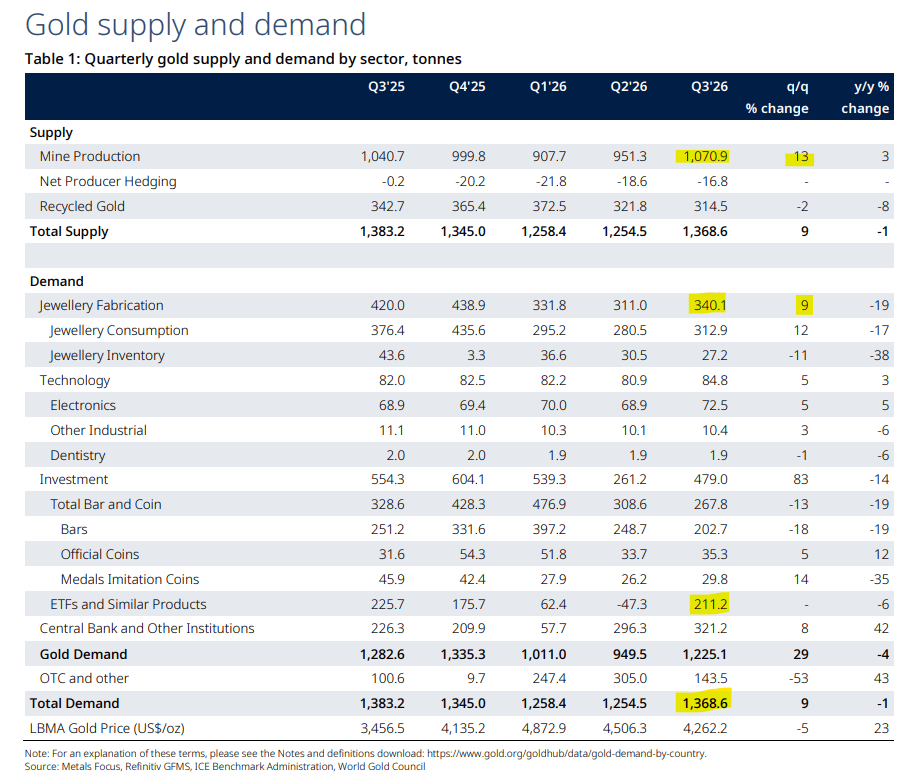
The latest World Gold Council report highlights interesting developments for Q3 2026. First, we see a massive rebound in mine production, which is weighing noticeably on prices. At the same time, we observe a modest recovery in jewelry demand, as reflected in Indian import data. Meanwhile, Q3 was supported largely by ETF flows. Without this, demand could have been lower than in Q2. Central banks showed strong demand, buying even more gold than in the second quarter. Source: WGC
Historical Valuation and Fund Positioning
Gold valuations in a historical context are undergoing a clear cooling period. Relative to its 1-year average, the metal is priced well below normal, falling over 1.6 standard deviations below. Over a 2-year horizon, prices have aligned with historical averages, while remaining moderately expensive relative to a 5-year period. Six months ago, valuation premiums were extremely high, but over the past three months and the past month, they have steadily eroded, bringing valuations back to neutral levels.
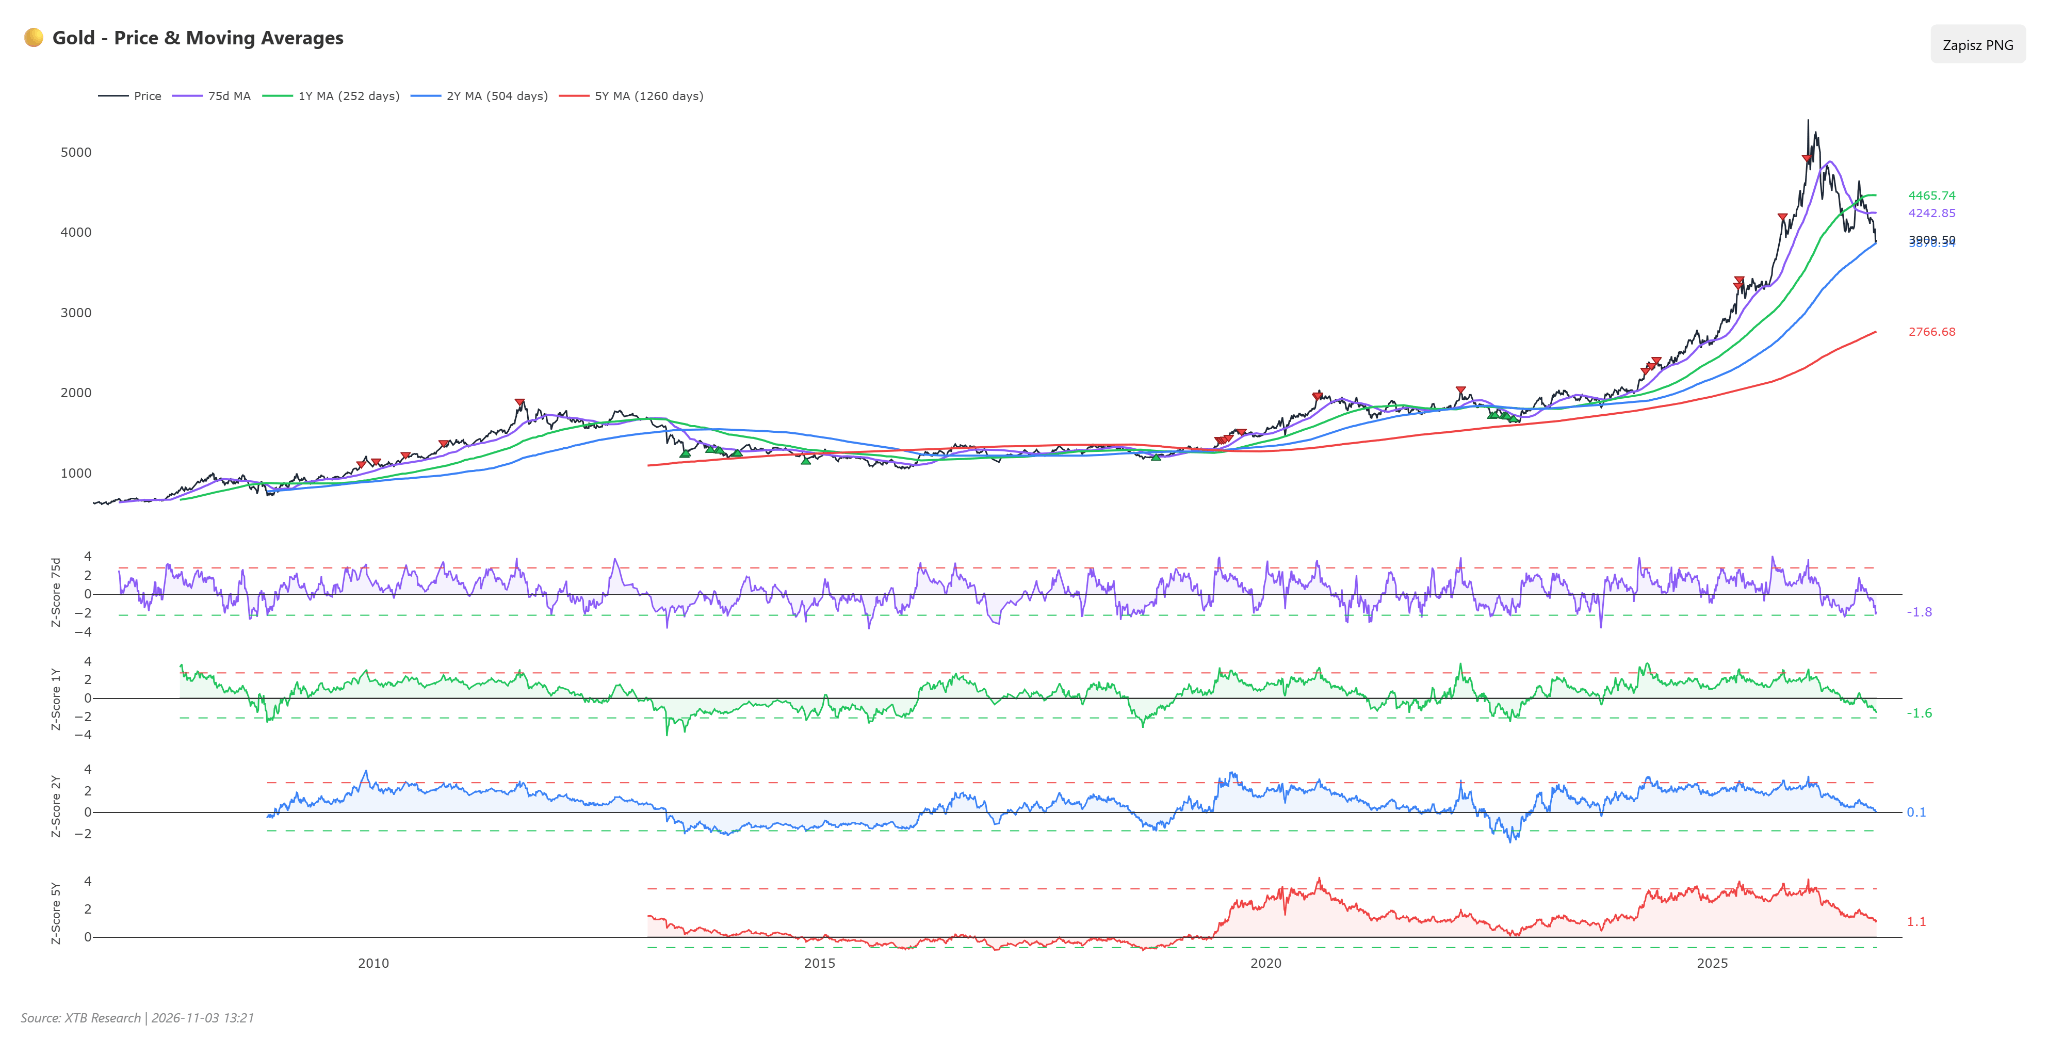
With further declines, deviation from 3-month and 1-year averages will soon trigger an extreme oversold signal. Source: XTB Speculative fund positioning indicates ongoing long exposure reductions. Managers still hold a net long advantage, accounting for 85.7% of total portfolio exposure, with a net balance of around 186k contracts. While this corresponds to a high 76th percentile historically, investors cut net long positions by over 13k contracts last week, dropping below 2-year norms. Sustained high long exposure alongside a breakdown in 1-year valuations creates the risk of cascading stop-loss liquidations if the market fails to defend current lows.
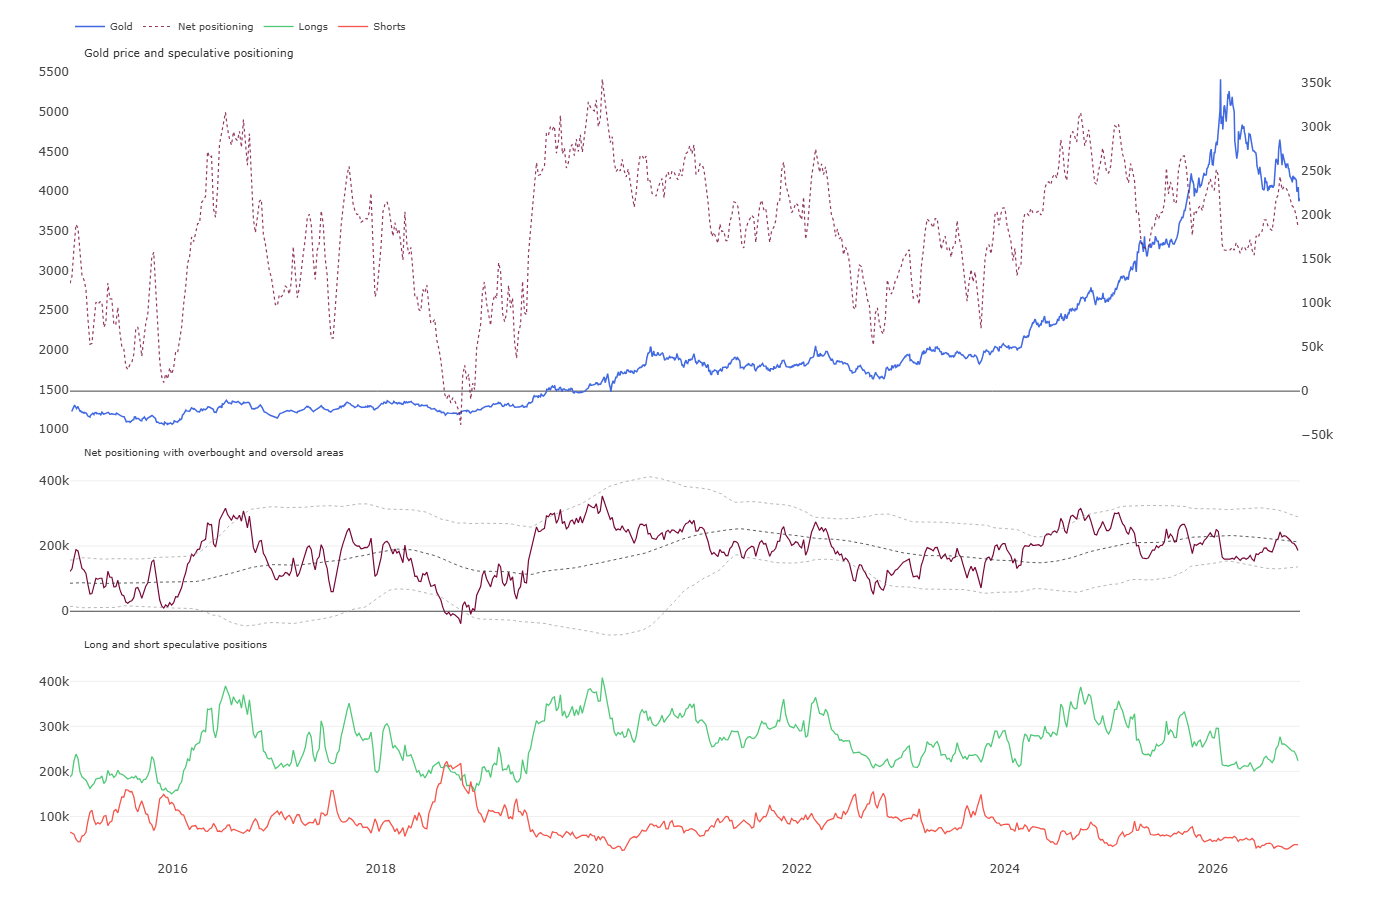
Long positions have been cut noticeably, but in the near term could drop to extreme 6-year lows. Historically, long positions rebounded after nearing 200k contracts. Source: XTB
Scenarios
- Bullish Scenario: A breakdown in diplomatic talks between Washington and Tehran alongside renewed armed escalation around Qeshm Island could sharply revive safe-haven demand. This would force support defense and a technical breakout above resistance near $3,950, opening the path for a rebound toward $4,050–$4,100.
- Bearish Scenario: Swift progress on a peace agreement with Iran confirmed by the Trump administration, paired with continued liquidity draining from stock markets, would deepen the sell-off in precious metals. A sustained breakdown below support near $3,850 would confirm bear dominance and target the $3,750–$3,800 zone.
Crude Oil (WTI & Brent)
Technical Analysis
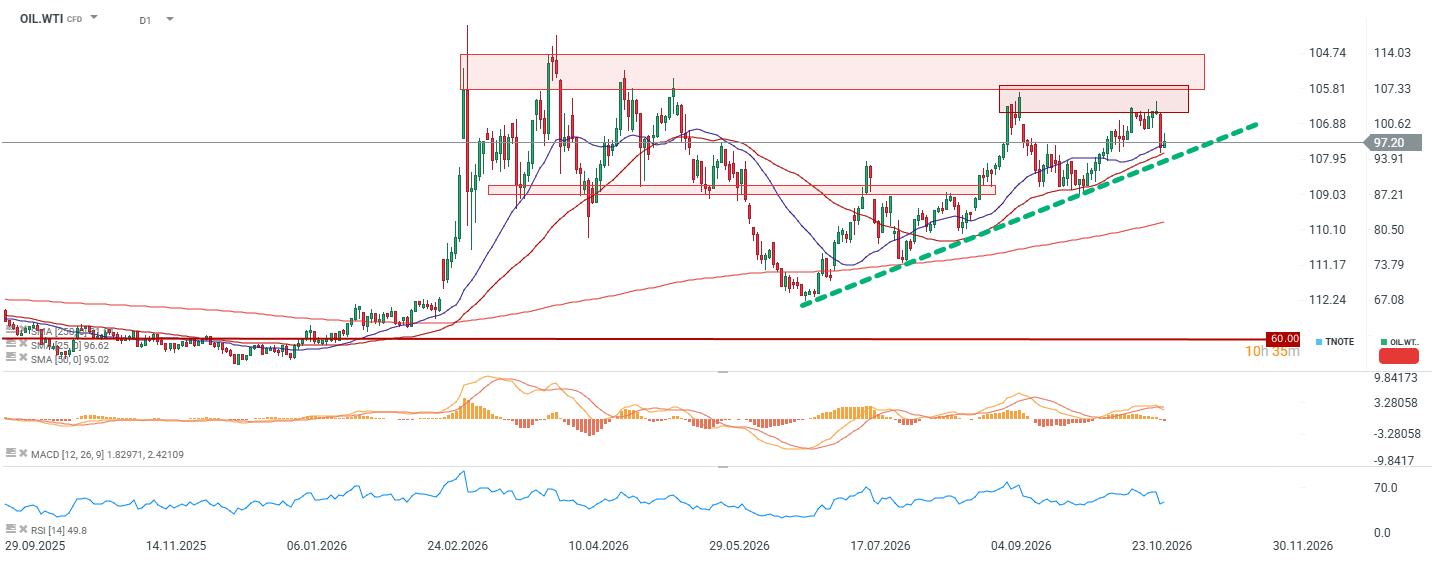
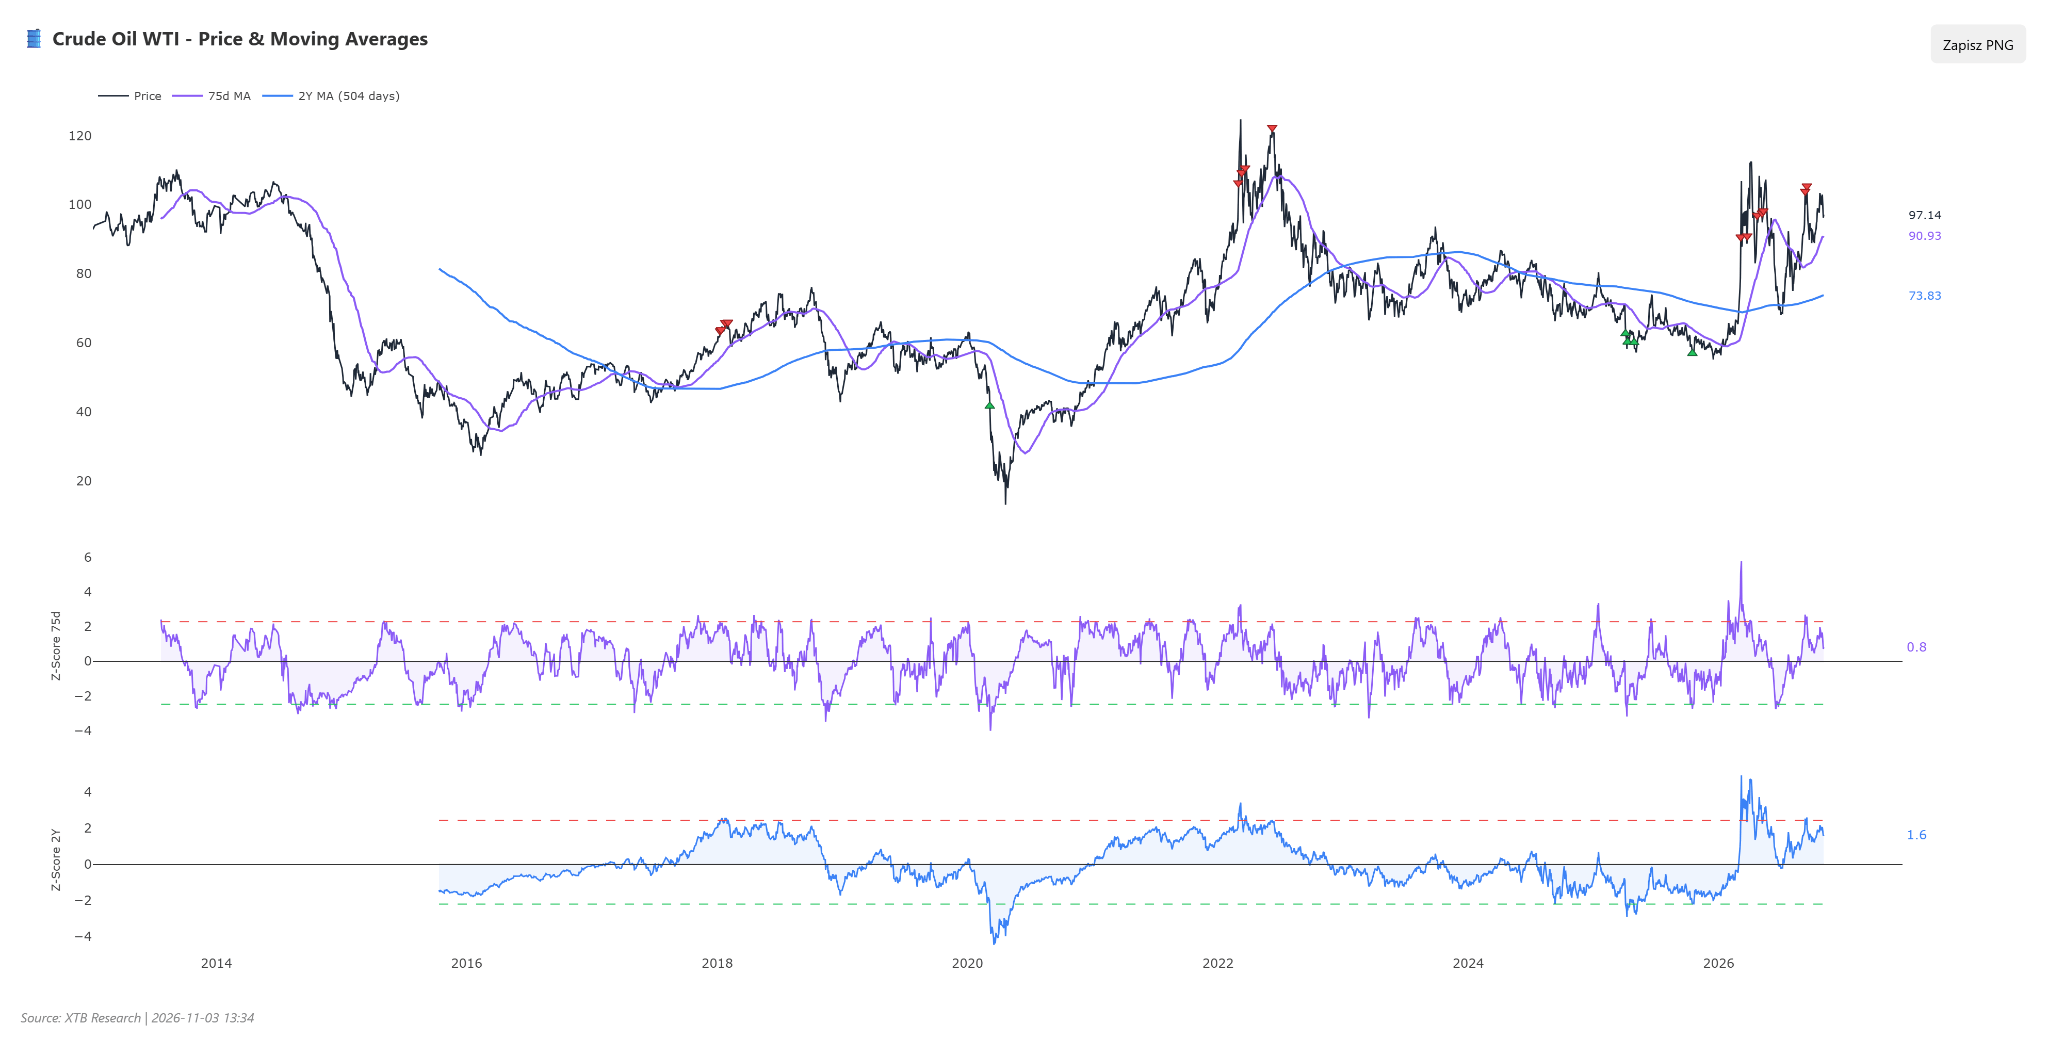
- WTI prices are hovering around $97 (down 1.7% weekly, but up 71.5% year-to-date), while Brent crude trades near $106 (down 2.5% weekly with YTD gains at 66.3%), maintaining a relatively wide regional spread of around $9 in favor of North Sea crude.
- RSI indicators for both benchmarks sit at neutral levels (below 50 for WTI and 51 for Brent), signaling a balanced market without immediate oversold risks; SMAs preserve a bullish alignment, though MACD indicators generate bearish cooling signals.
- Both crude grades remain above their 50-period moving averages (WTI by 3.3%, Brent by 4.3%), pointing to a preserved medium-term uptrend despite a sharp early-week correction.
- Key support for WTI runs near $95–$96, with major resistance around $102; for Brent, immediate support sits near $104, while main supply resistance rests at the psychological $110 level.
Fundamental and Market Context
- The remaining seven signatories to the voluntary OPEC+ output cut agreement, led by Saudi Arabia and Russia, decided to freeze production at reduced levels through the end of 2026.
- Official crude production in Saudi Arabia stood at 8.37 mb/d (compared to 6.24 mb/d in the prior period), while Russian output came in at 8.64 mb/d.
- Weekly US crude output reached a record 13.99 mb/d, with shale sector production contributing around 10.4 mb/d.
- US commercial crude inventories fell by 1.89 million barrels last week according to government data, while API figures indicated a 2.03 million barrel draw.
- Global oil demand in 2026 is contracting by 80k b/d, representing a sharp deceleration after growth slowed to 700k b/d in 2025.
- Physical refinery run cuts in Asia and the Middle East reached 6 mb/d due to military disruptions to shipping in the Strait of Hormuz and Bab al-Mandab.
- Global consumption of petrochemical feedstocks – naphtha, ethane, and LPG – saw a daily demand contraction of 1.8 million barrels.
- Brent crude prices rebounded above $106 following US strikes on Iran’s Qeshm Island, throwing into doubt progress in Qatar-hosted negotiations.
- The CEO of Saudi Aramco officially stated that the global energy balance will face heavy supply pressure during the coming winter season.
- Shipping firm BGN increased VLCC tanker investments to secure alternative oil supply routes bypassing the Iranian war zone.
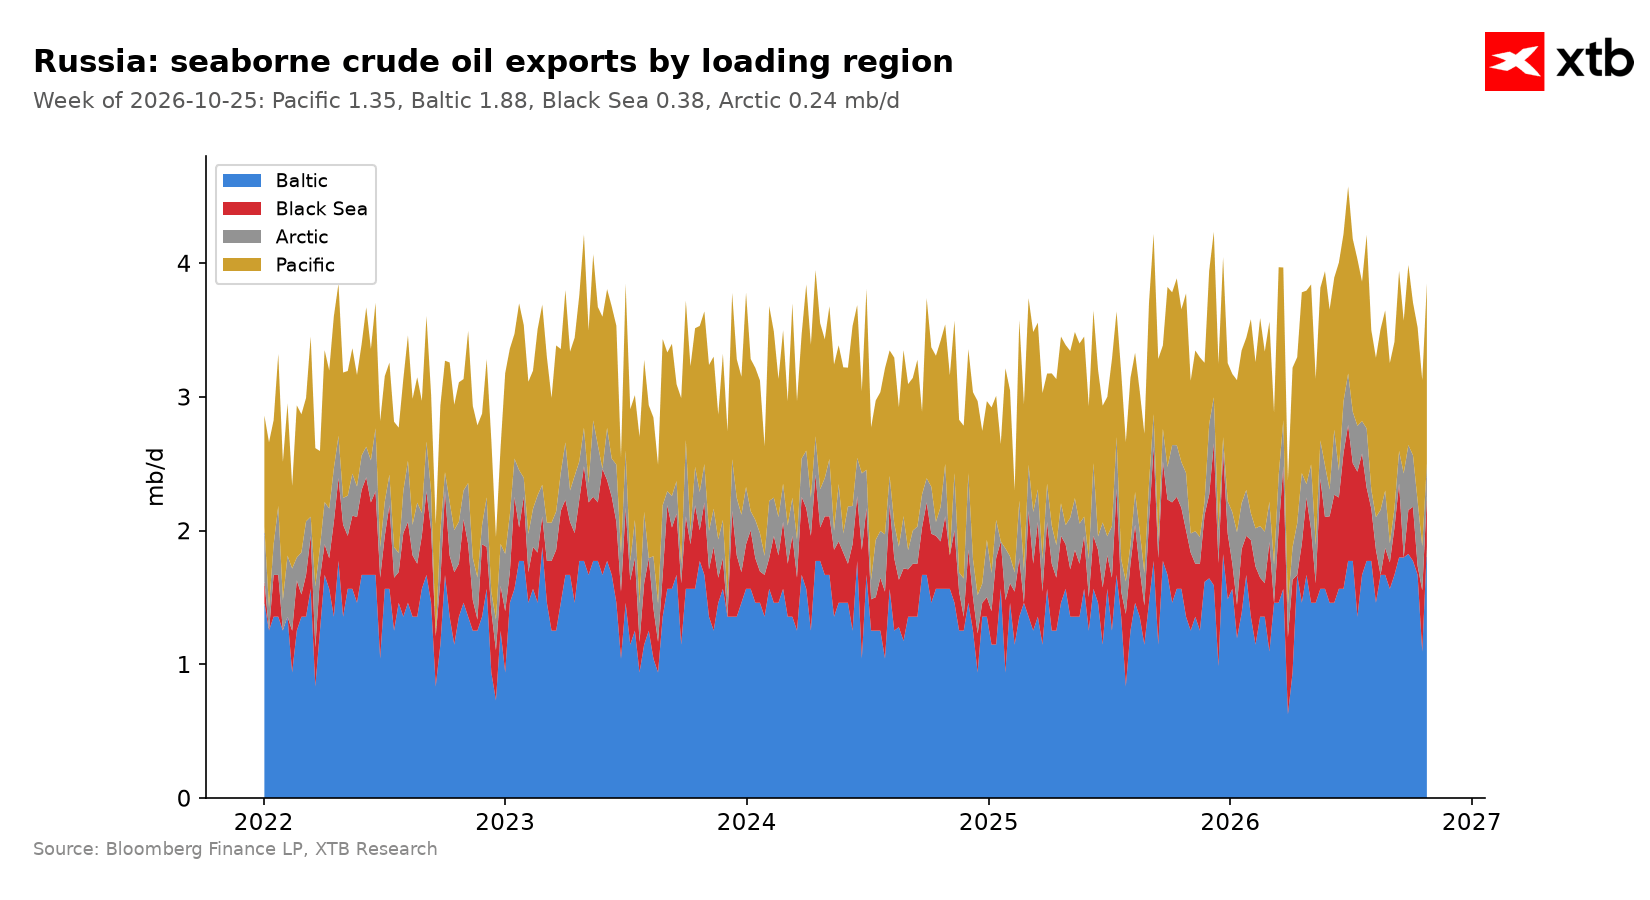
Russian crude exports are rebounding, mainly to Asia, easing upward pressure on oil prices. Source: Bloomberg Finance LP, XTB
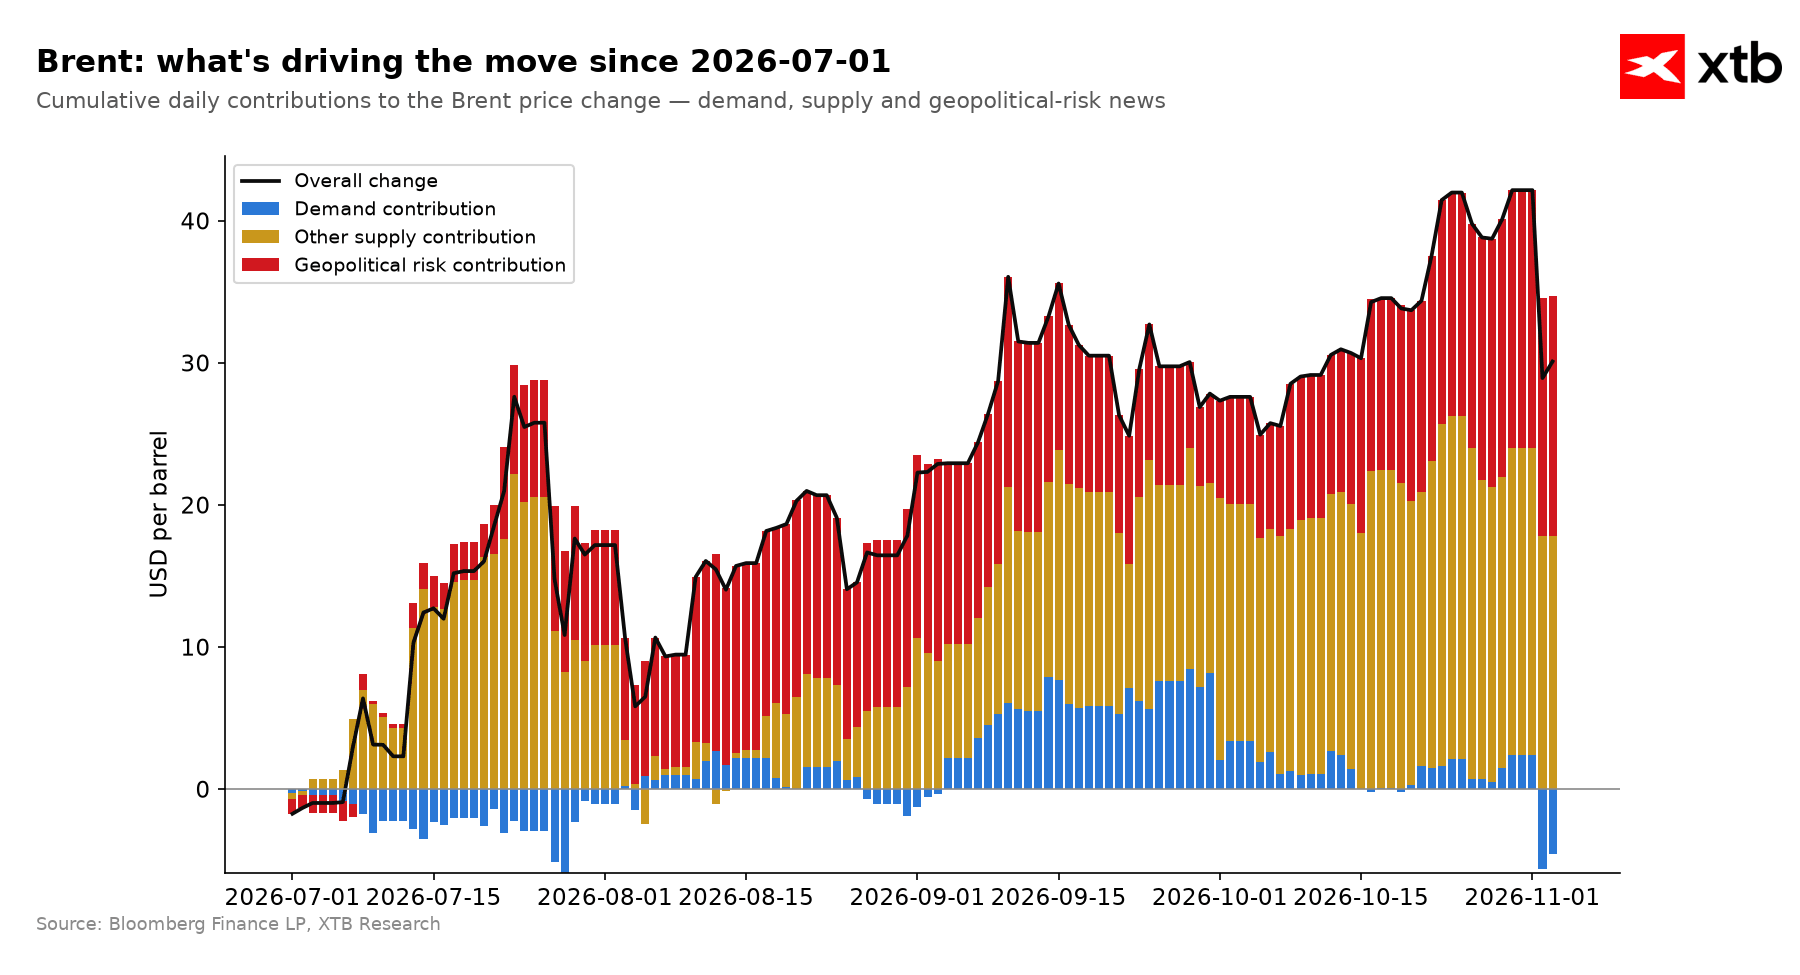
Negative demand drivers have appeared for Brent crude pointing to demand destruction, now visible not only in Asia but also in Europe and the US. Source: Bloomberg Finance LP, XTB
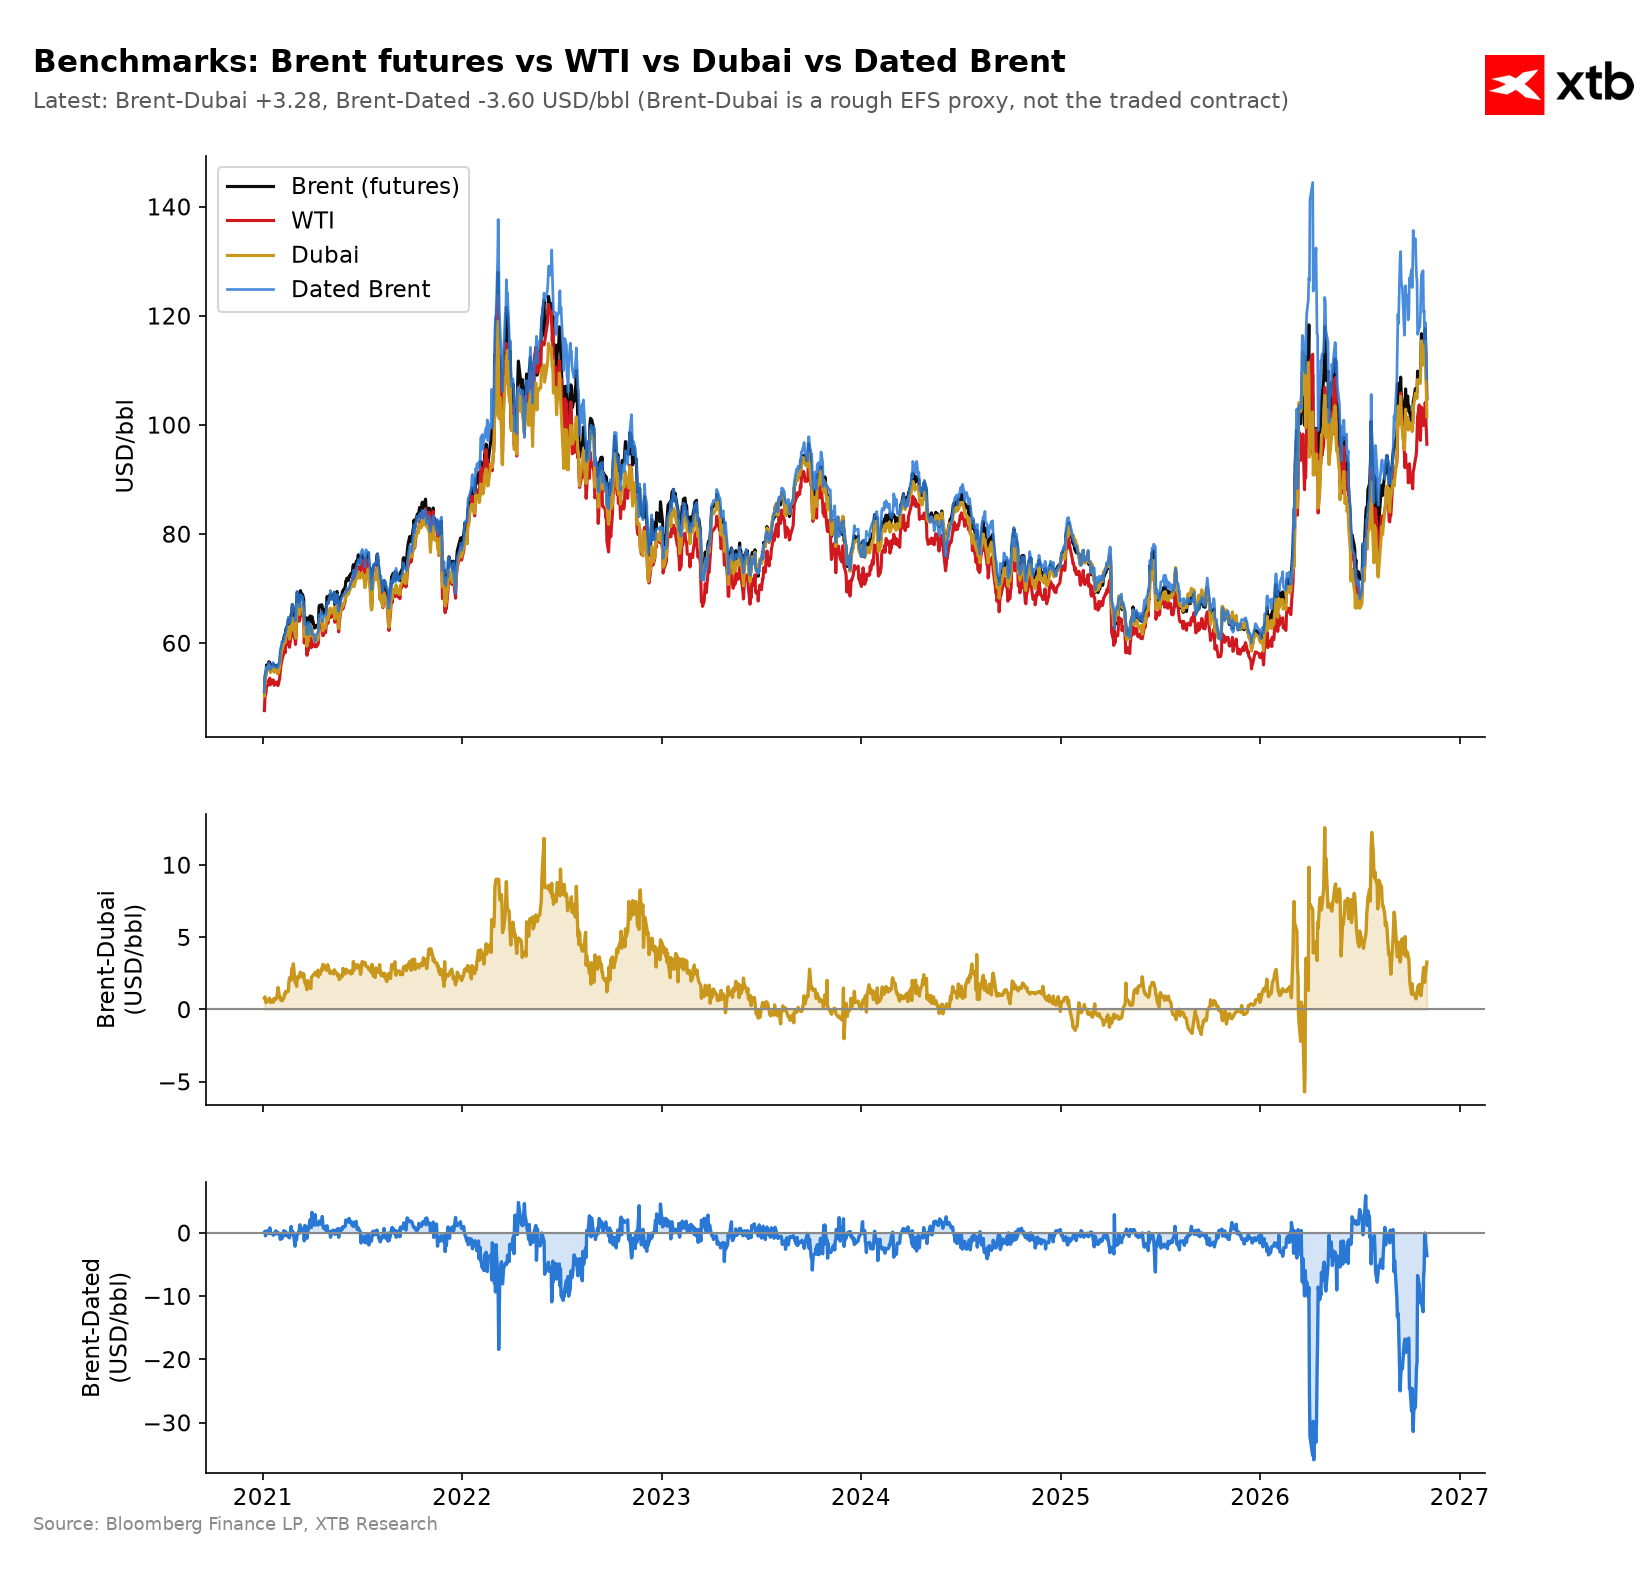
Physical Dated Brent prices in North Sea deliveries converged with front-month futures, indicating the elimination of upside technical pressure on futures contracts. Source: Bloomberg Finance LP, XTB
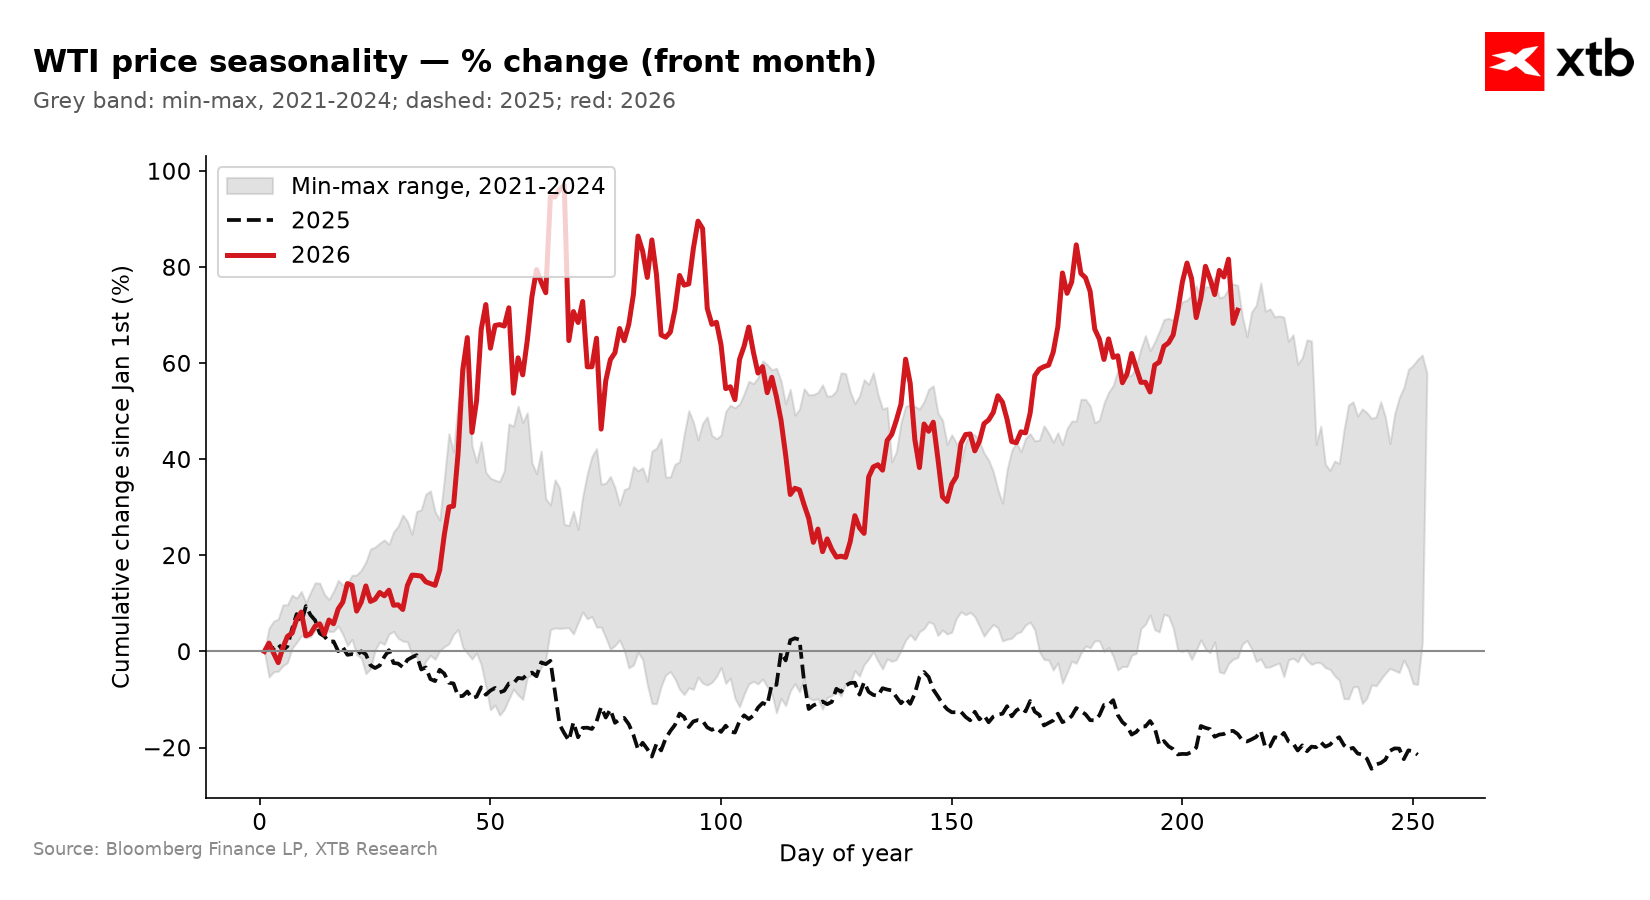
Looking at seasonality, WTI crude typically loses ground near year-end. Source: Bloomberg Finance LP, XTB
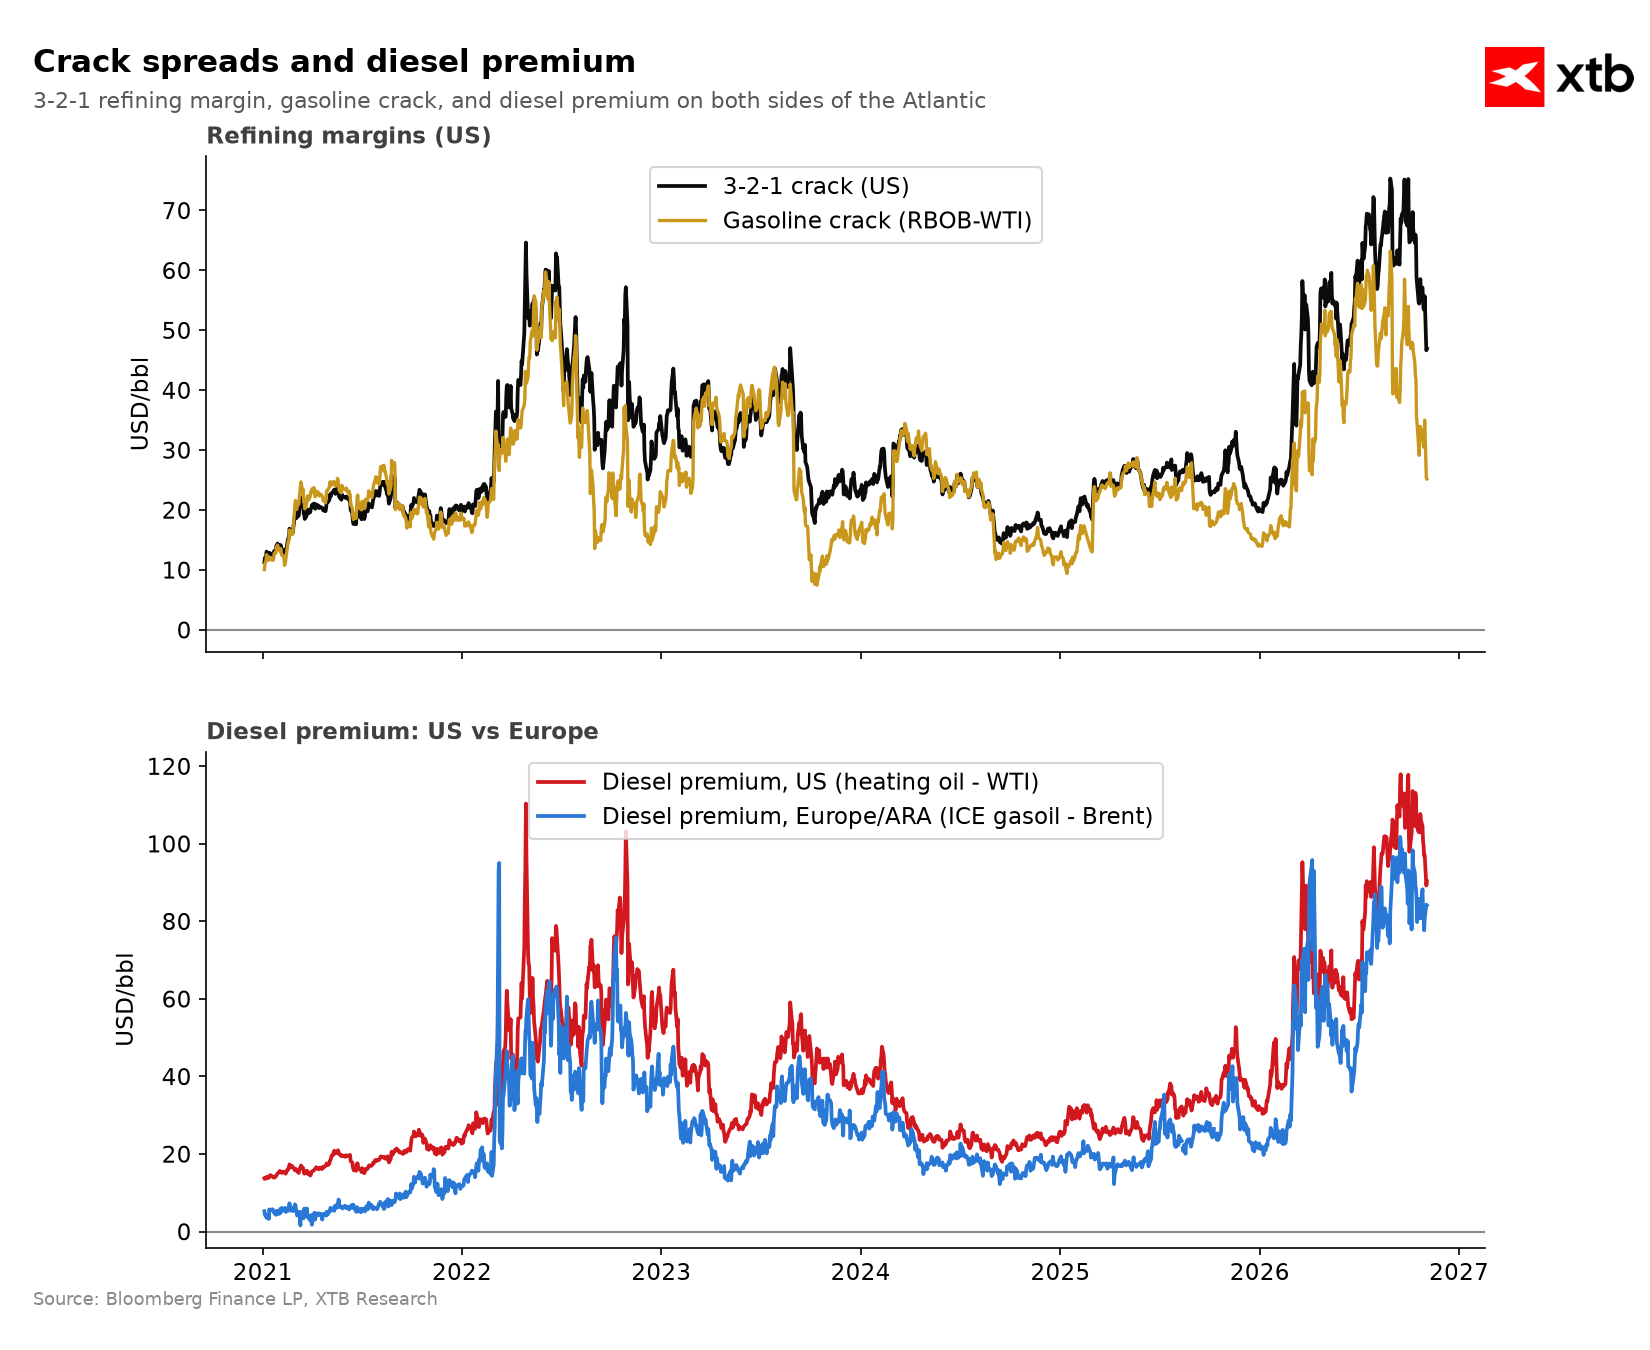
Refining margins and fuel crack spreads are melting away, which may stem from demand destruction, additional supply entering the market, or increased refinery runs. Source: Bloomberg Finance LP, XTB
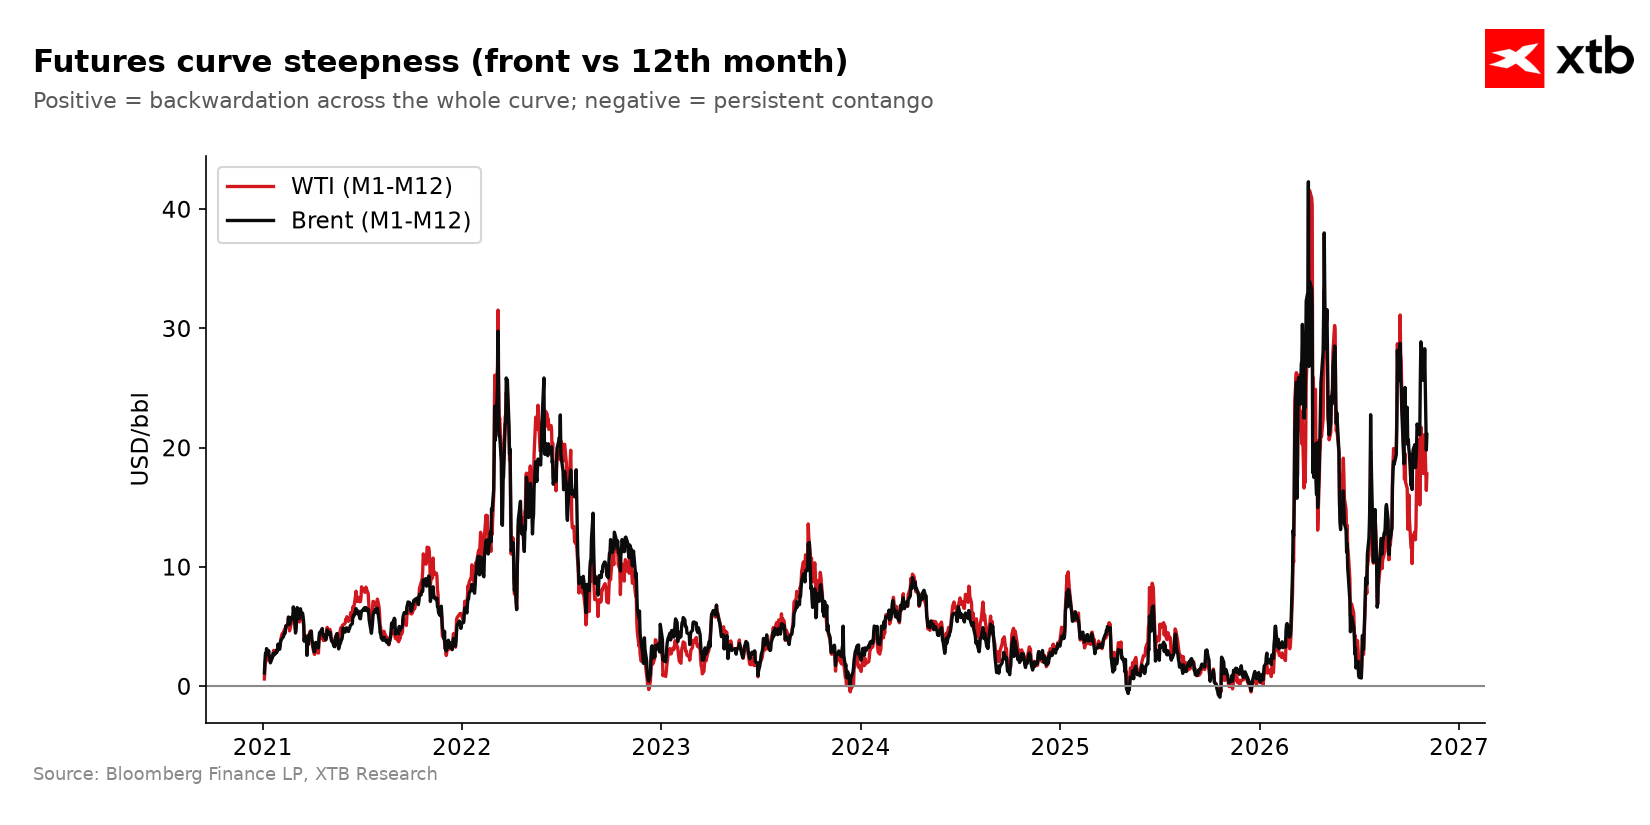
The annual calendar spread is narrowing, further suggesting the market reached extreme overbought levels recently. Source: Bloomberg Finance LP, XTB
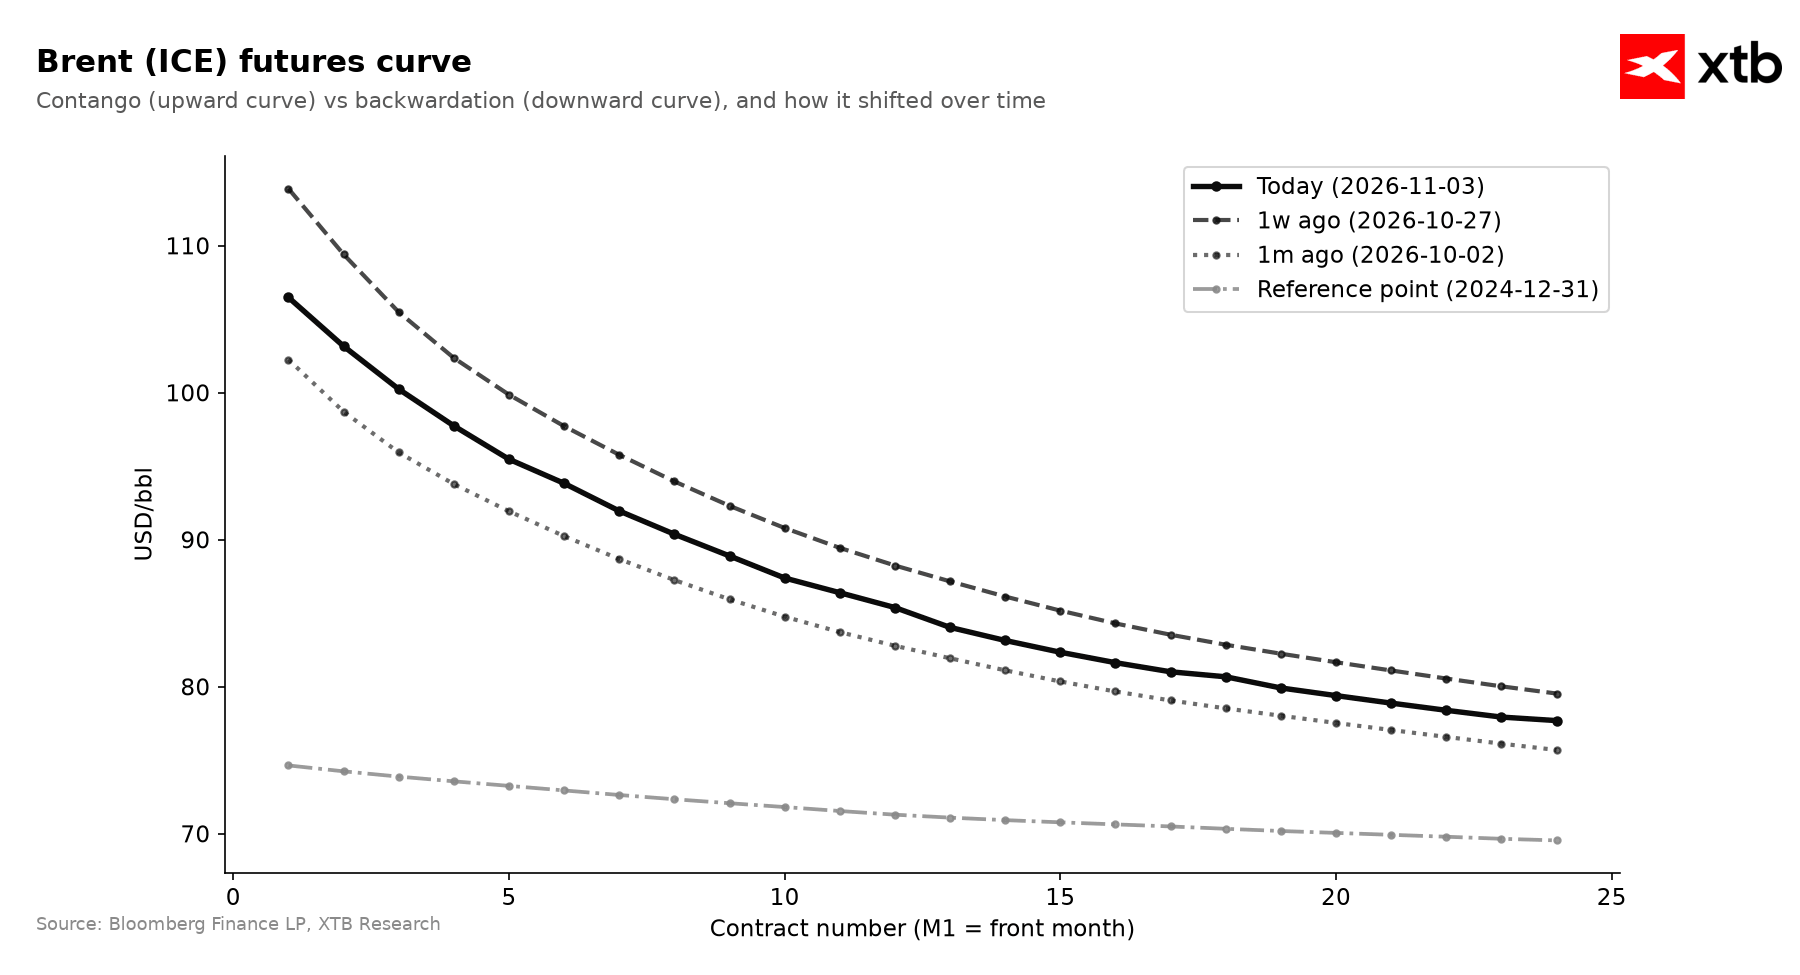
The Brent futures curve is shifting down across all tenors, showing that the market is unwinding overall risk rather than just short-term risk. Source: Bloomberg Finance LP, XTB
Historical Valuation and Fund Positioning
From a multi-year perspective, valuations for both crude oil benchmarks remain elevated relative to historical norms, directly reflecting a geopolitical war risk premium. WTI currently trades moderately above its 1-year average and clearly above 2-year and 5-year averages (by ~1.4 standard deviations). European Brent trades at an even wider deviation, exceeding its 5-year average by over 1.7 standard deviations, explaining the wide inter-market spread. Valuation evolution over recent months shows strong dynamics: six months ago prices were extremely elevated at >2 standard deviations above normal, returning close to historical averages by late summer, before October geopolitical escalation around the Strait of Hormuz pushed prices back to elevated levels.
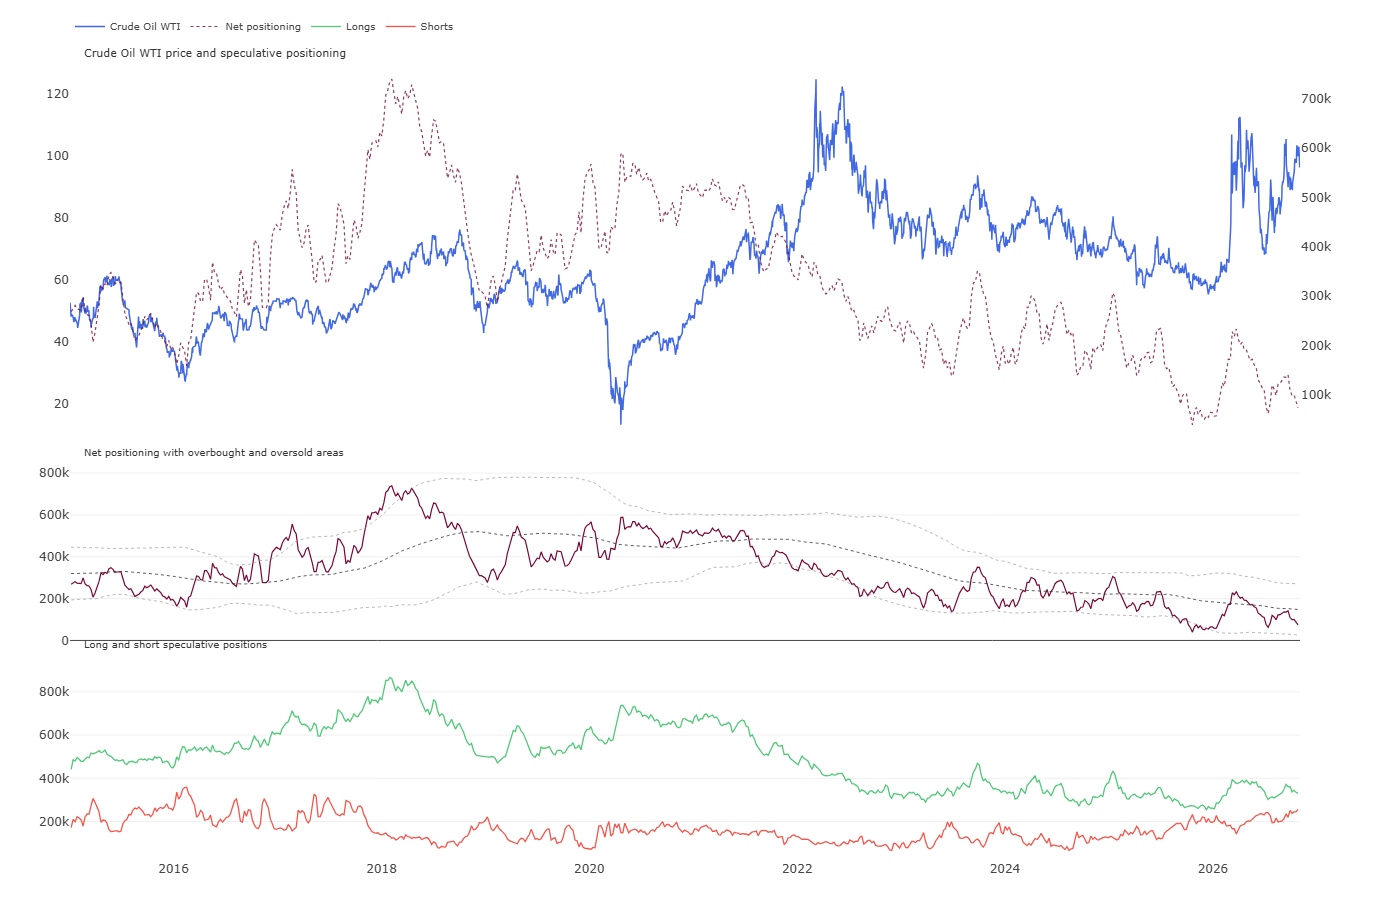
CFTC reports point to a striking divergence in speculative positioning across both markets. On WTI, funds hold a net long position of ~74k contracts, cutting long exposure by nearly 15k contracts last week, placing sentiment near the 52nd percentile – right at the midpoint of historical distribution. On Brent, financial investors hold a net short position of ~-29k contracts with long positions accounting for just 36%, despite modest buying of 6k contracts last week. Such fund caution amidst high spot prices means valuations are not driven by speculative euphoria; consequently, risks of a crash driven by mass profit-taking remain limited, while fresh supply disruptions could turn forced short covering on Brent into fuel for a sharp rally.
Scenarios
- Bullish Scenario: A breakdown of diplomatic talks in Qatar, renewed military incidents in the Strait of Hormuz blocking VLCC shipping lanes, or a drop in US production below 13.8 mb/d amid warnings from Saudi Aramco of winter supply shortages would trigger another buying wave. Technical confirmation of demand dominance would come from a sustained WTI breakout above $102 resistance and Brent breaking above $110. In that setup, WTI would target $108–$110, while Brent would open a path back toward $115–$118.
- Bearish Scenario: A de-escalation agreement signed between the US and Iran alongside growing supply from the UAE pumping over 4.1 mb/d would meet contracting global demand (-80k b/d), accelerating the unwinding of the war premium. WTI dropping below key support at $95 and Brent pushed under $104 would confirm negative MACD indicators. Under this scenario, the target for WTI becomes $88–$90, while Brent slides toward $96–$98.