






The Nasdaq 100 (US100) has been showing signs of a noticeable slowdown in recent days. The index is currently around 3.8 per cent below its all-time highs (ATH). During yesterday’s session alone, it fell by 1.7 per cent. The index is being dragged down by shares in companies such as Meta Platforms, Broadcom and Cisco Systems.
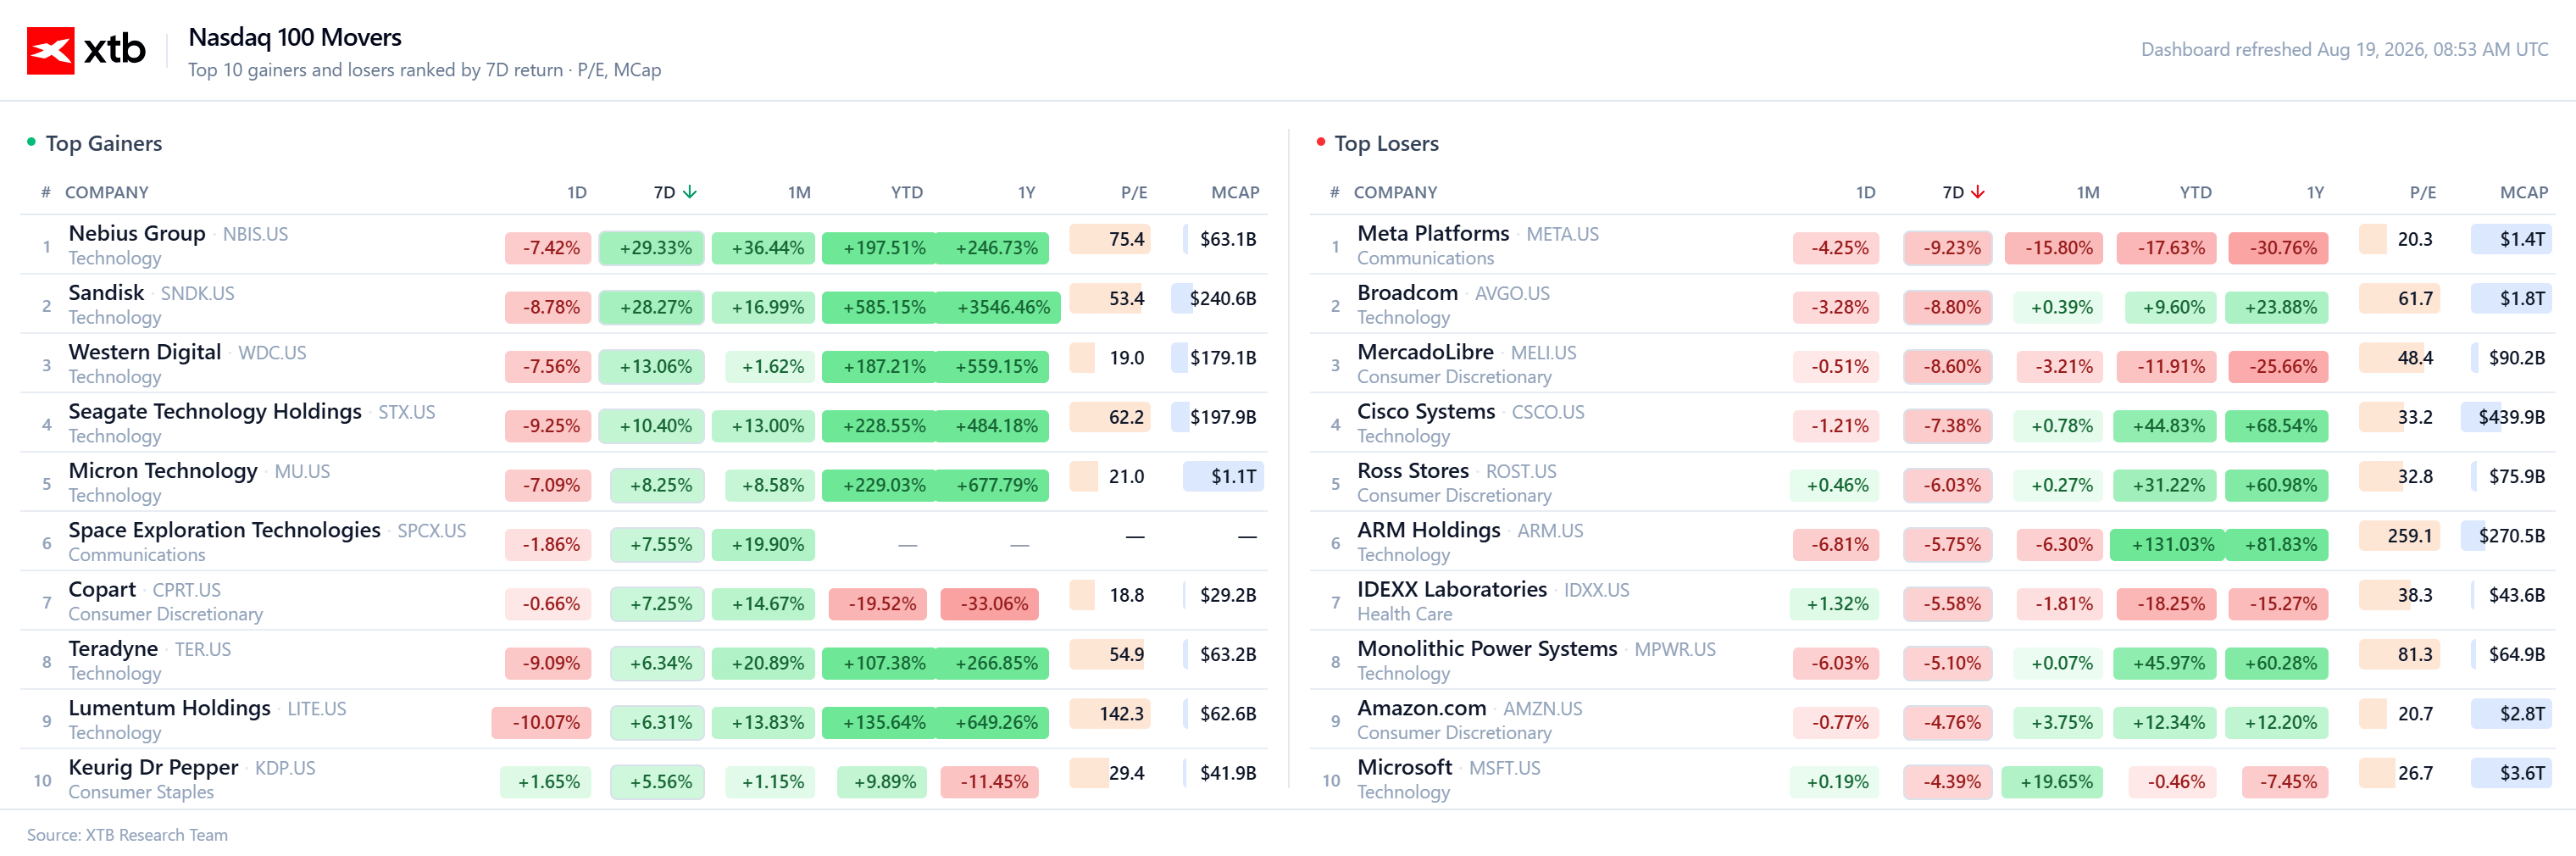
Source: XTB Despite this short-term nominal weakness, from a multiplier perspective, the market is starting to look increasingly interesting. A cooling-off of the indicators and a fall below the standard deviation
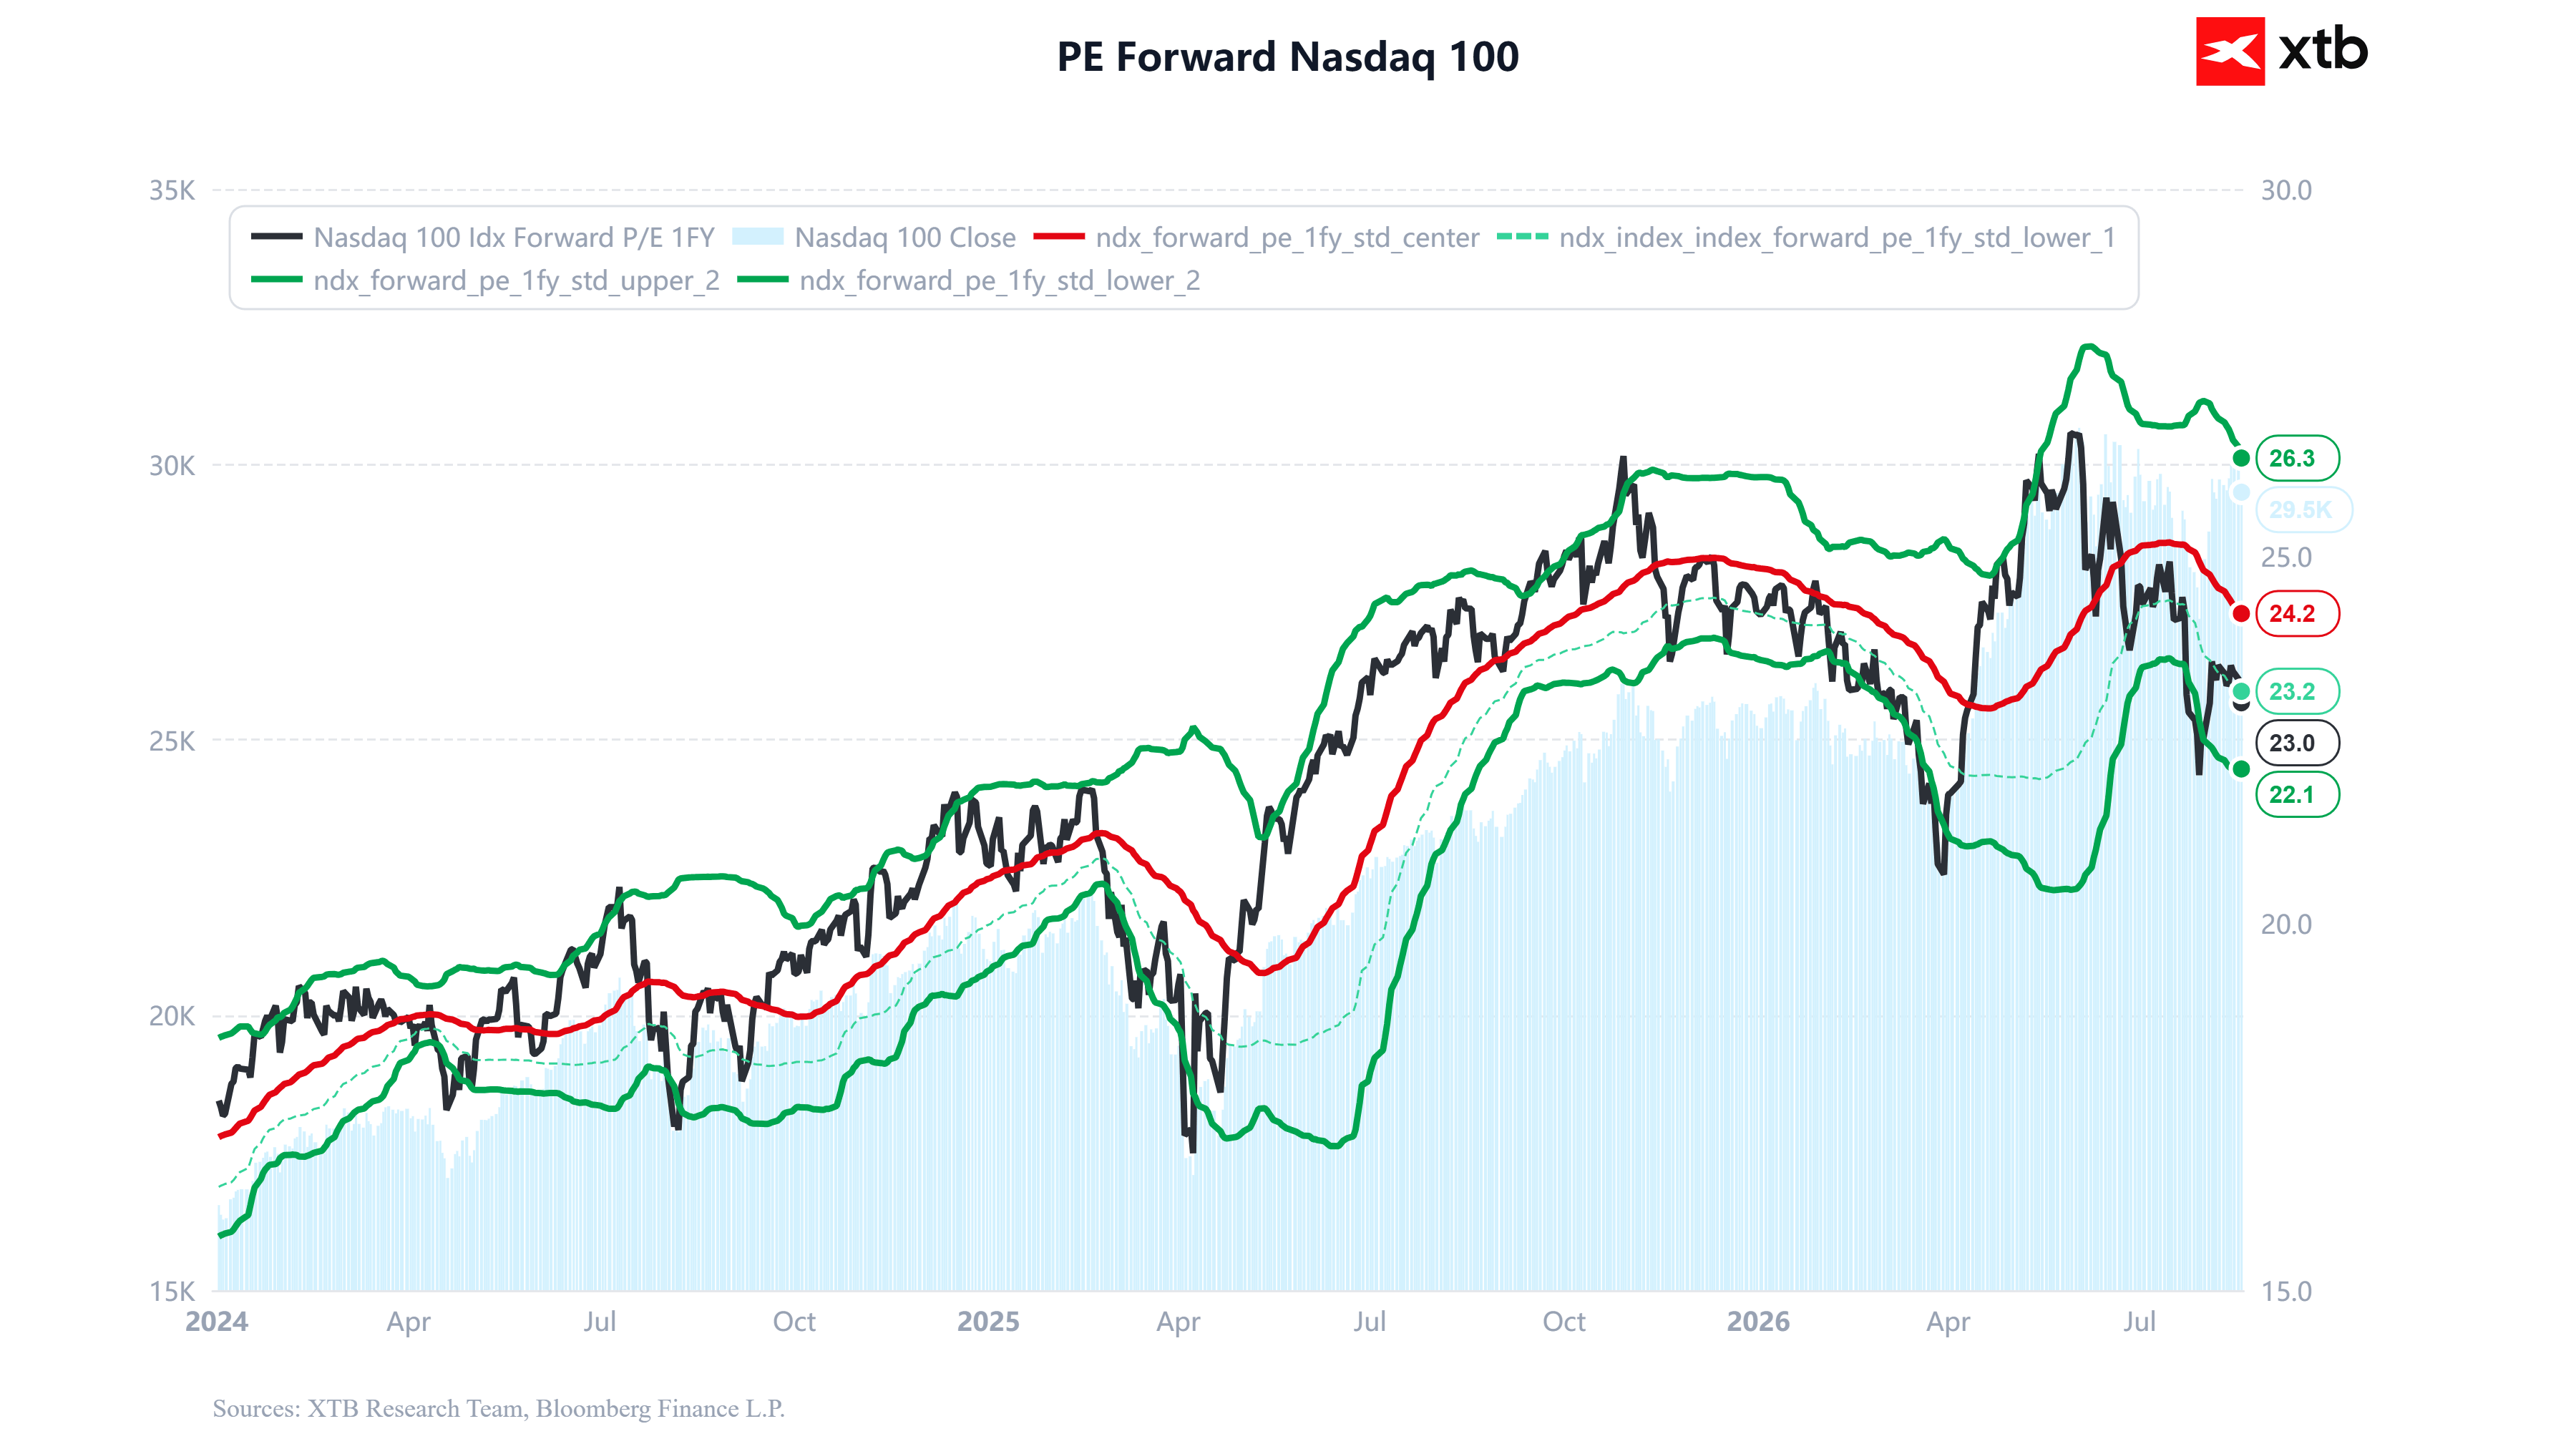
- The forward P/E ratio (price to forecast earnings for the next 12 months) for the Nasdaq 100 index has fallen to around 23.0.
- Most importantly, the forward P/E ratio has fallen below the lower limit of one negative standard deviation when analysing the range since the start of 2024.
- The median (average) for this indicator over the period under review is higher, at 24.2.
This pattern suggests that the US100 index is becoming relatively cheaper. Since the multiple is falling below standard deviations, this means that earnings forecasts (the denominator of the ratio) are holding up strongly, whilst the fall in share prices (the numerator) is ‘cooling’ the market, removing some of the excess optimistic overvaluation. Technical situation on the chart (D1 timeframe)
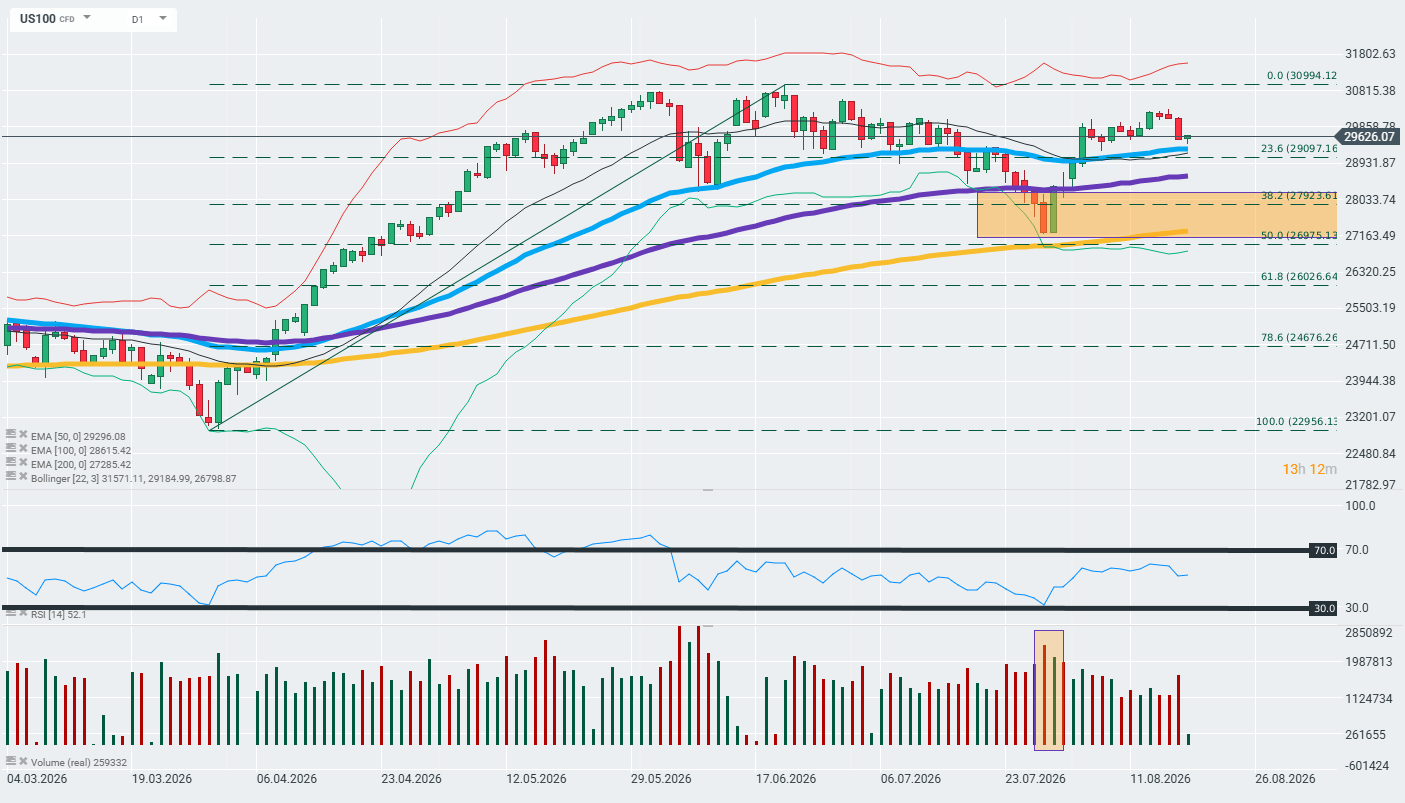
Looking at the daily chart, the US100 contract price is currently fluctuating around 29,626 points. If the current selling pressure persists and investors continue to reduce their positions, the zone defined by the 38.2% Fibonacci retracement, located around 27,923 points, as well as the range of the two daily candles from 29 and 30 July, when we saw increased trading volume, indicating a possible rise in demand in this zone. Source: xStation