






The US100 index of U.S. technology companies is down for another session, retreating to around 29,800 points (−1.1%), as a wave of profit-taking sweeps through global markets, targeting semiconductor and AI-related stocks. This is not a crash caused by a collapse in fundamentals—it is rather a reassessment of the cost of capital in a world of higher and potentially rising interest rates. Investors are not questioning whether there is demand for AI, but rather what price is worth paying for this growth.
The Trigger: Data Center Debt and Rising Inflation
The catalyst was the higher-than-expected CPI inflation reading for September, which reignited fears of further Fed rate hikes, but it was the tech sector that led the sell-off. The focus shifted to the financing of the AI infrastructure boom. Yields on bonds issued by CoreWeave—an “neo-cloud” operator—skyrocketed to around 15% (the 2032 maturity at 14.8%), while the stock itself plummeted by 15.5%. Elon Musk summed up these moves with a single word: “yikes.” Oracle (−9%), Nebius (−10%), and Dell (−11%) also came under pressure, and the cost of insuring the debt of AI giants (CDS) rose in some cases to record levels. The scale of the phenomenon is evident in the background: the hyperscalers alone—Alphabet, Amazon, Meta, and Oracle—have issued over $228 billion in bonds this year, more than double the amount issued in all of 2025.
Asia was hit the hardest
Asia was hit hardest by the sell-off, as it is the most exposed to memory and semiconductors. South Korea’s KOSPI plunged 7.57% to a six-month low, falling as much as 9.29% along the way and triggering a circuit breaker for the first time since July. Samsung Electronics lost nearly 9.5%, while SK Hynix fell as much as 11.1%. The Nikkei 225 dropped 5.4%, with Kioxia and SoftBank falling by more than 9–11%. Against this backdrop, TSMC stood out by defying the pessimism: the Taiwanese giant posted a record net profit in the third quarter—763.1 billion TWD (approx. 23.6 billion USD), up 69% year-over-year—beating forecasts and reporting its sixth consecutive record quarter. This is a strong counterargument: demand for flagship chips remains strong, regardless of the jitters surrounding companies at the end of the supply chain. Despite this, TSMC’s stock price fell by 2%, which clearly reflects the nature of this sell-off—the market is overestimating the company’s valuation and the cost of capital, rather than actual demand for computing power.
Technical Analysis of the US100
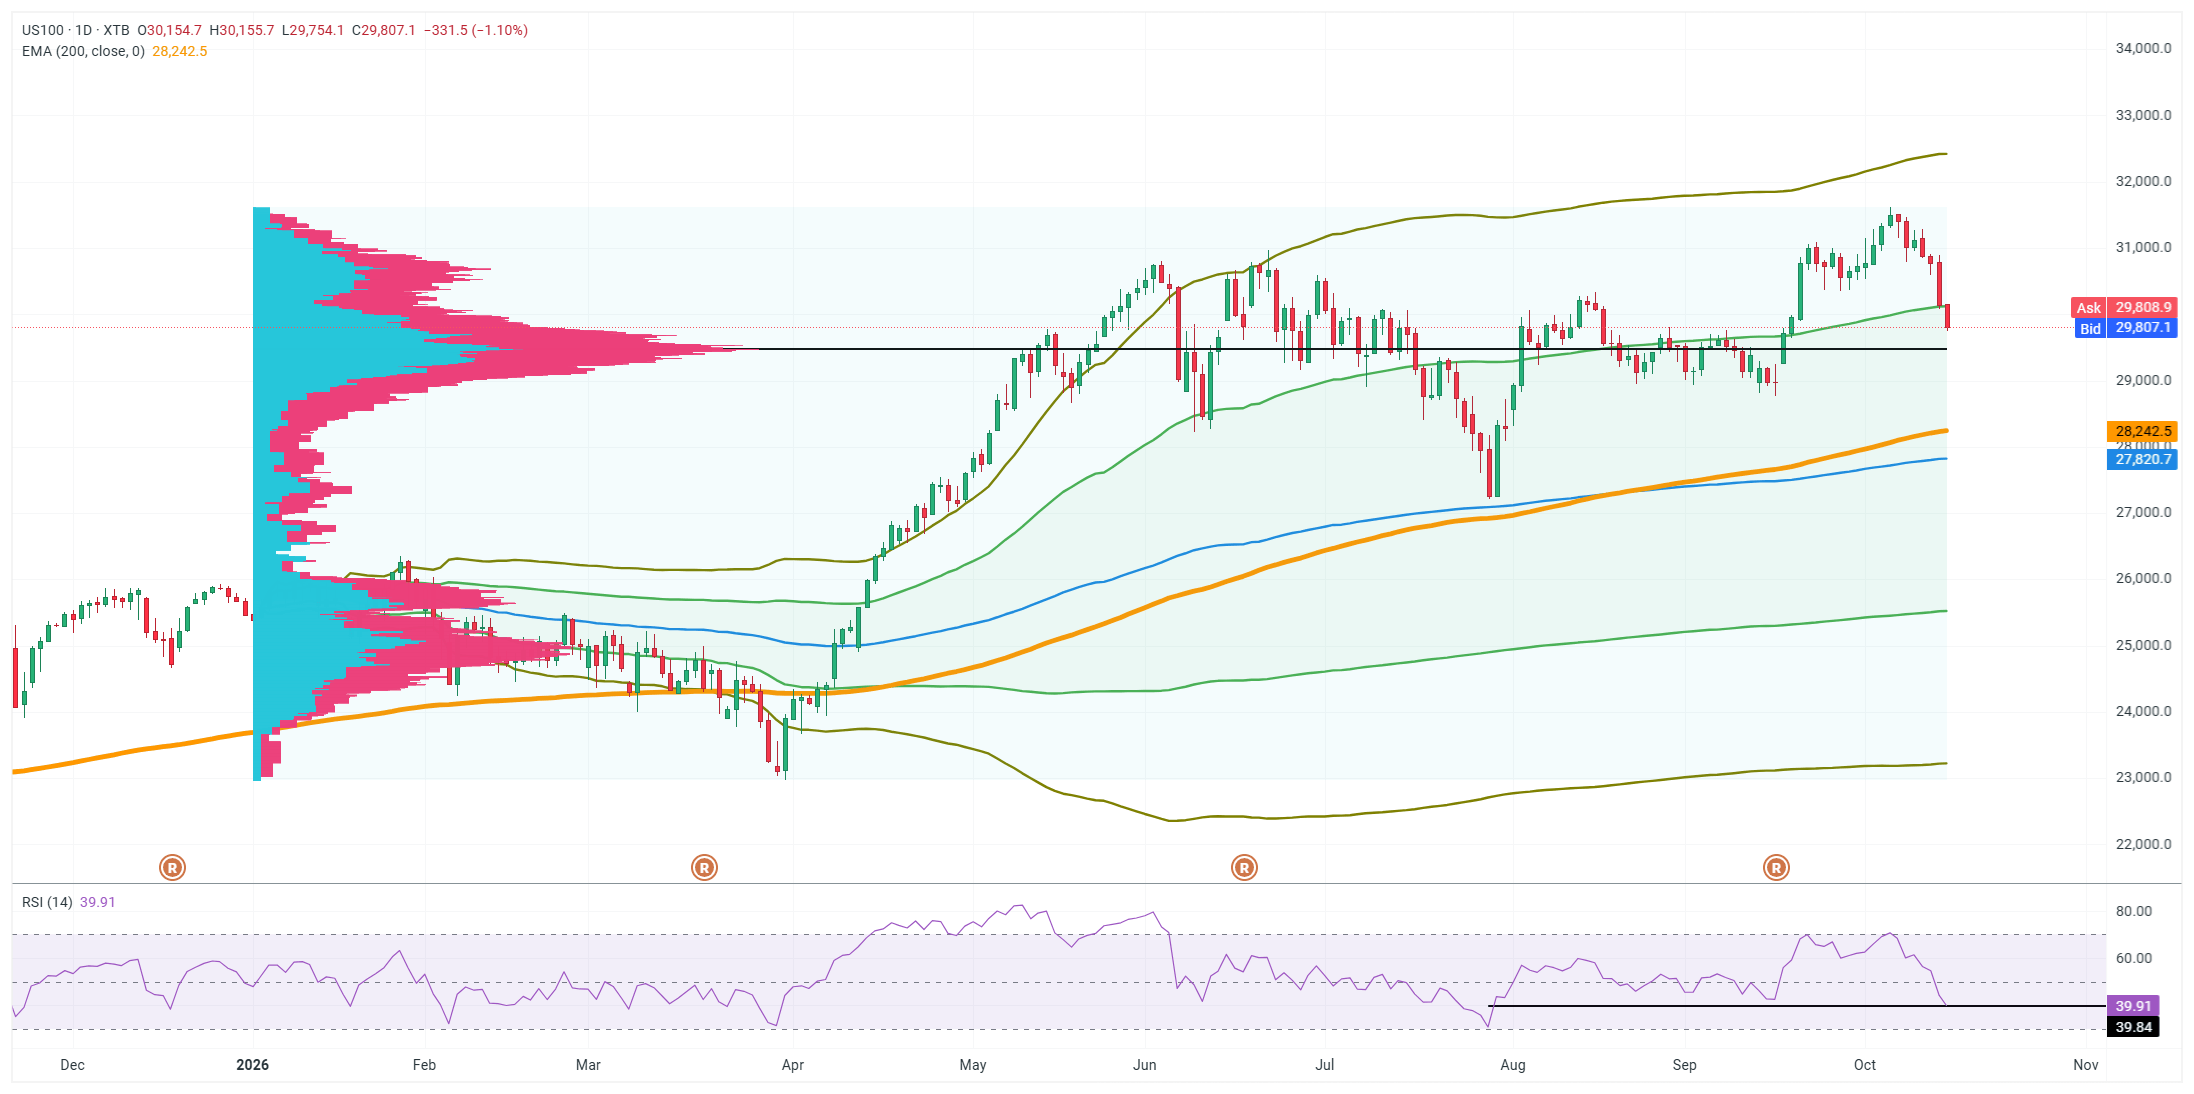
The US100 daily chart shows a clear reversal in momentum after the index hit new highs above 31,000 points in early October. The current pullback has brought prices down to around 29,800 points, where an important zone lies—a black horizontal line defined by earlier consolidations from July through September, which coincides with the lower band of the green channel. This is the first technical test to see whether buyers will defend the ground regained after the summer lull.
A key signal is coming from the RSI. On the daily chart, the indicator has slipped to around 39.9 —its lowest level since July of this year and below the conventional 40 line, which has repeatedly served as the lower boundary of corrections during this year’s bull market. The pace of the decline itself is also telling: this is the most decisive downward momentum impulse we’ve seen since the middle of the summer.
As long as the RSI remains in the 40–50 range, we’re still talking about a correction within an uptrend; a sustained drop below this level would pave the way for a deeper pullback and a test of lower-lying moving averages. Below current levels, the long-term 200-day EMA around 28,240 points is drawing attention—this is a natural zone of potential, deeper support should supply pressure intensify. It is also worth noting the deteriorating market breadth: the proportion of Nasdaq 100 companies trading above their 50-session moving average has fallen to about 40%, confirming that the sell-off is broad-based and not limited to a few of the most indebted stocks.