






Monthly Summary
September was a month in which the commodities market stopped moving as a whole. The average weekly change of the basket was minus 2.31%, and only eight of the twenty-six instruments finished the last session in positive territory. This is not a picture of a broad bull market or a broad bear market, but rather a market split into two extremely different directions. It is also worth emphasizing that the presented percentage changes also include futures contract rollovers, which, due to some huge backwardation or contango, are very large.
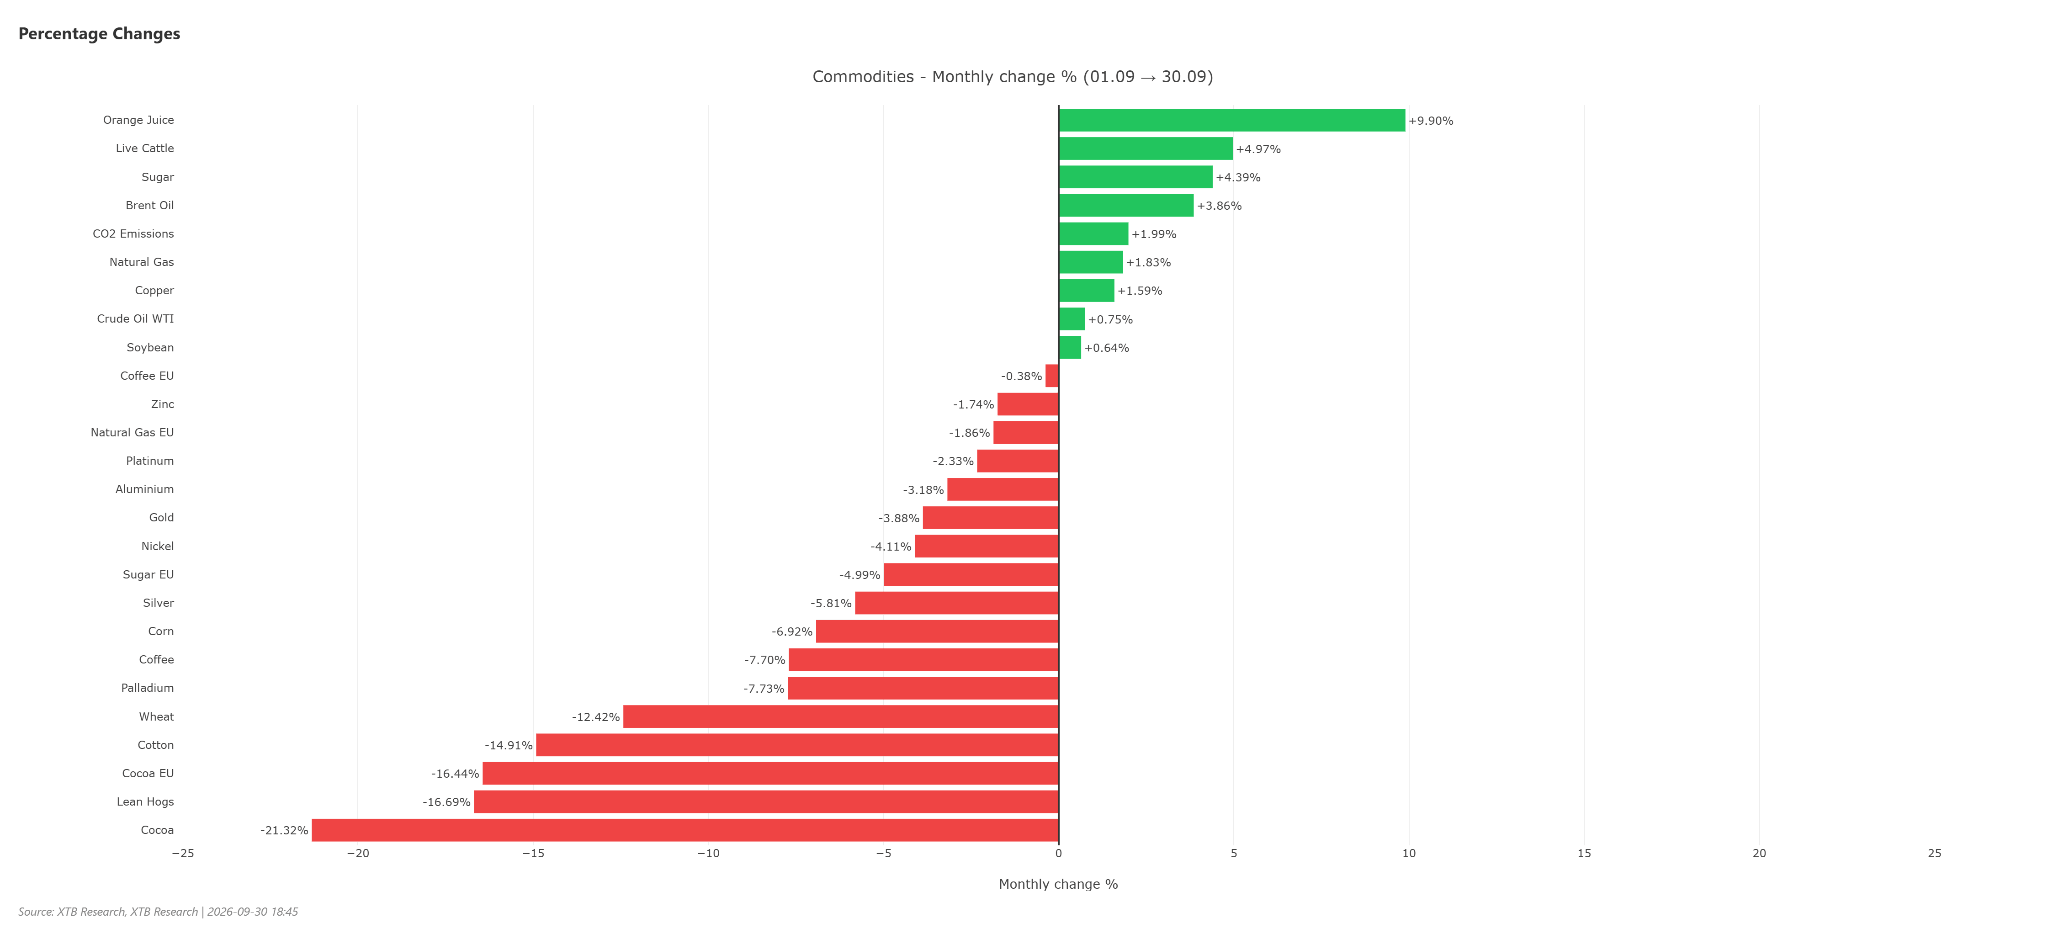
At one pole stands energy. European natural gas gained 5.28% in the last session to reach EUR 72.43/MWh, bringing its year-to-date gain to 151.49% and securing the position of clear leader of the entire list. Brent rose by 3.36% today to USD 98.84 and maintains a 62.75% YTD gain, while WTI rose 2.78% to USD 91.38 with 59.59% YTD. In September alone, Brent added 3.86%, and American crude oil 0.75%.
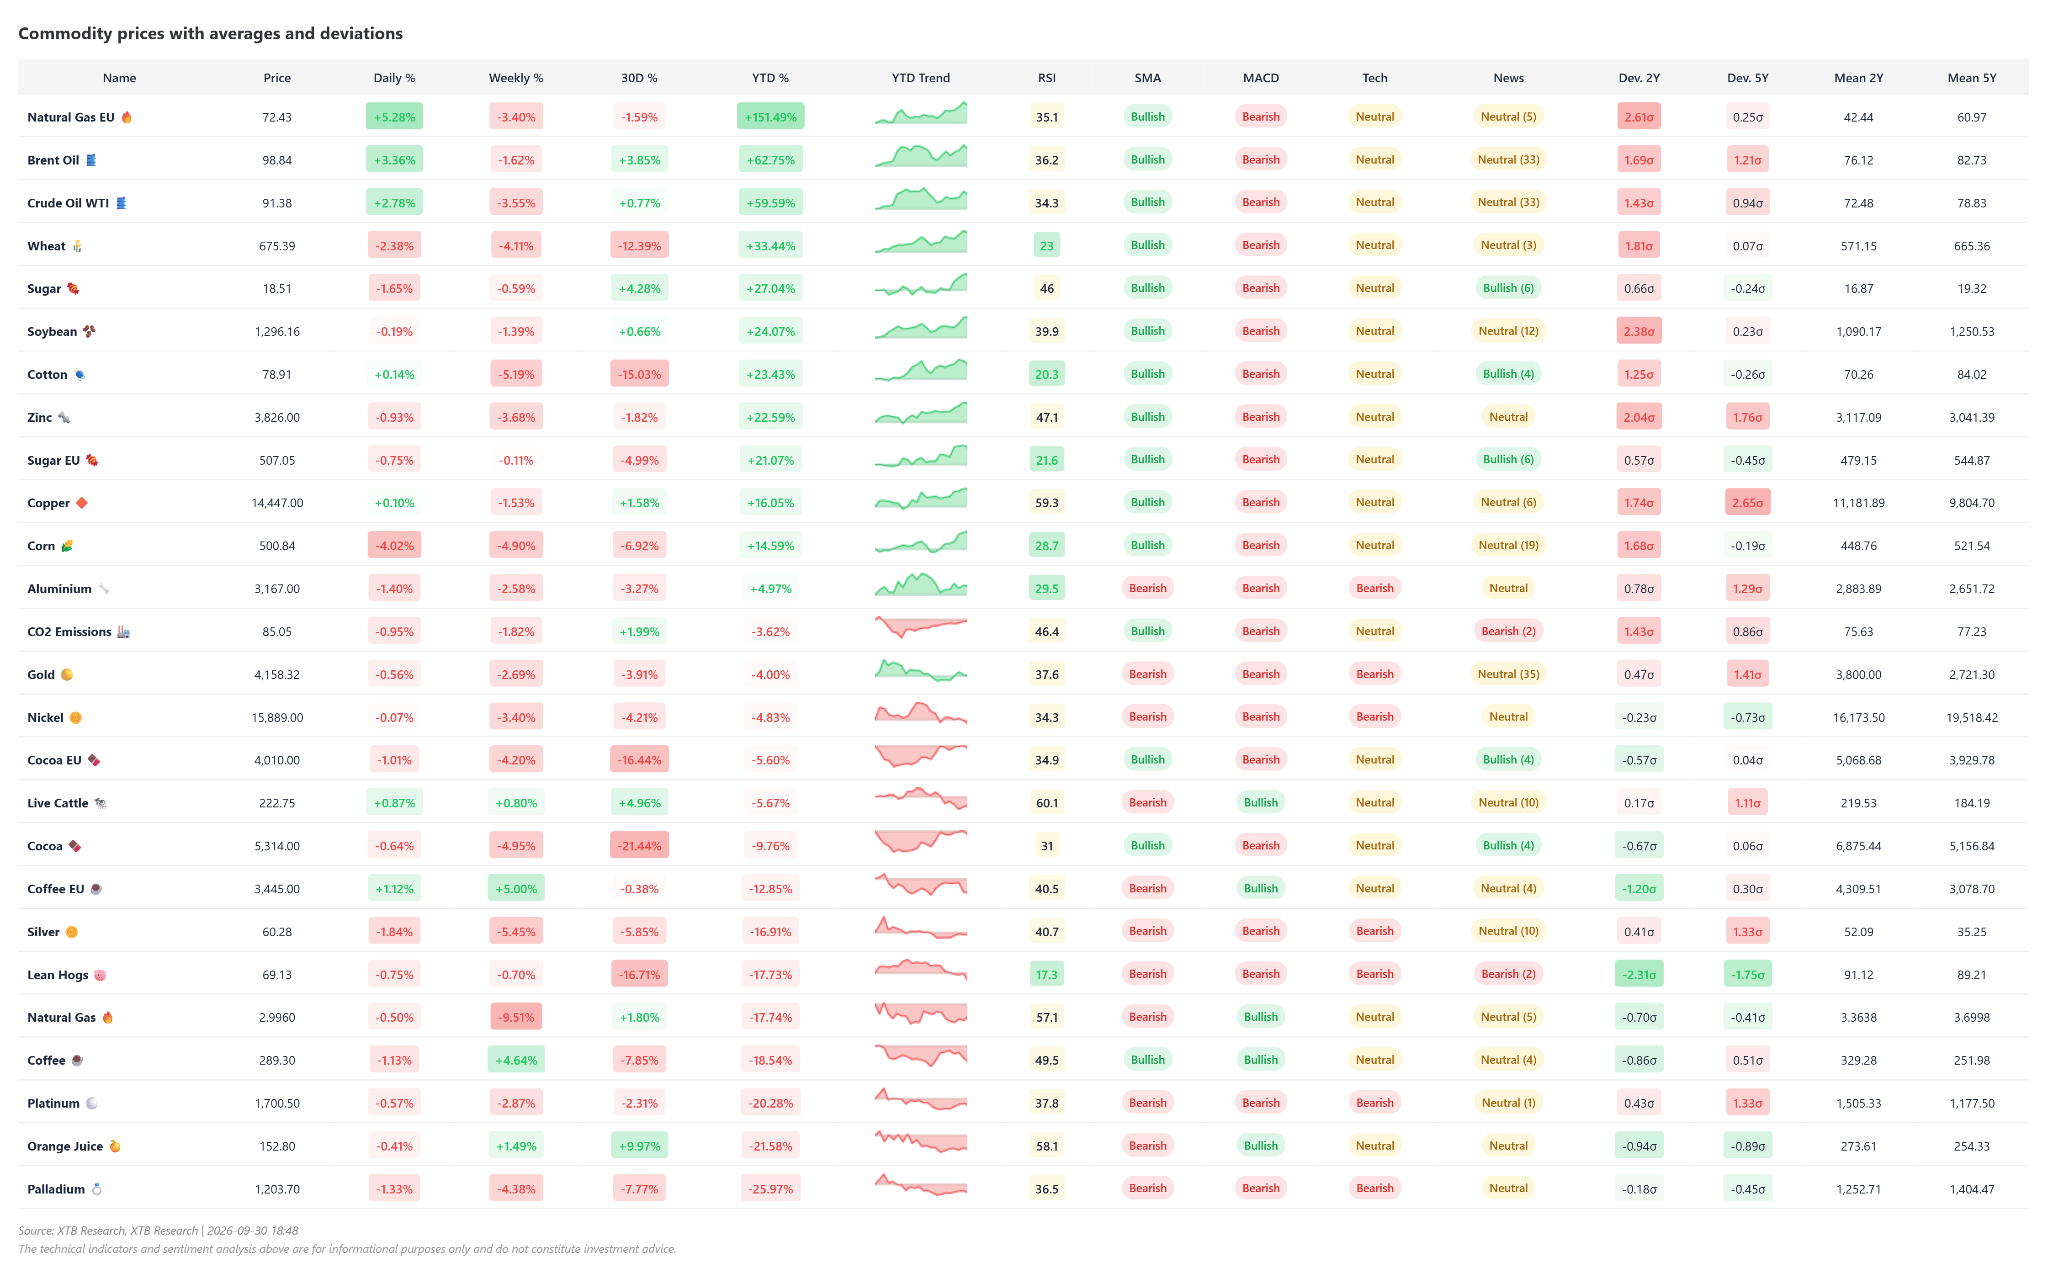
At the other pole, we have a slump in soft commodities and parts of agriculture. Cocoa lost 21.32% in a month, lean hogs 16.69%, cotton 14.91%, and wheat 12.42%. Corn fell 4.02% in the last session following inventory data, deepening its monthly loss to 6.92%. Precious metals went through September clearly in the red. Gold lost 3.88% to USD 4,158, silver 5.81% to USD 60.28, platinum 2.33% to USD 1,700.50, and palladium 7.73% to USD 1,203.70. The reason is single and well-recognized: the Fed’s first interest rate hike in three years and ten-year yields in the region of 5.2%. For non-yielding assets, this environment is simply hostile.
The Third Quarter in Numbers
The quarter belonged to oil. Brent entered July below USD 74, reached nearly USD 110 in September, and closed the period at USD 102.59 (November contract). The cause was the war in the Middle East and transit restrictions through the Strait of Hormuz. However, it is worth noting what is happening at the very end of the quarter: exports from the region returned to about 17.5 million barrels per day, roughly 98 percent of the pre-conflict level, and the US offered 40 million barrels from the strategic reserve. The market began removing the war premium. Characteristic of this quarter was how many commodities peaked in August and gave back most of the movement in September. Gold reached USD 4,696 and dropped to 4,111. Silver touched USD 71.16 and returned to 61. Cotton spiked to 91.44 cents and closed the quarter at 75.13. Cocoa rose to USD 6,603 and fell to 5,408. This symmetry is not coincidental, but a consequence of the pivot in monetary policy that came in September.
Positioning: Where the Crowd Is One-Sided
CFTC data from September 22 shows several setups worth noting, as they highlight the risks for the coming weeks.
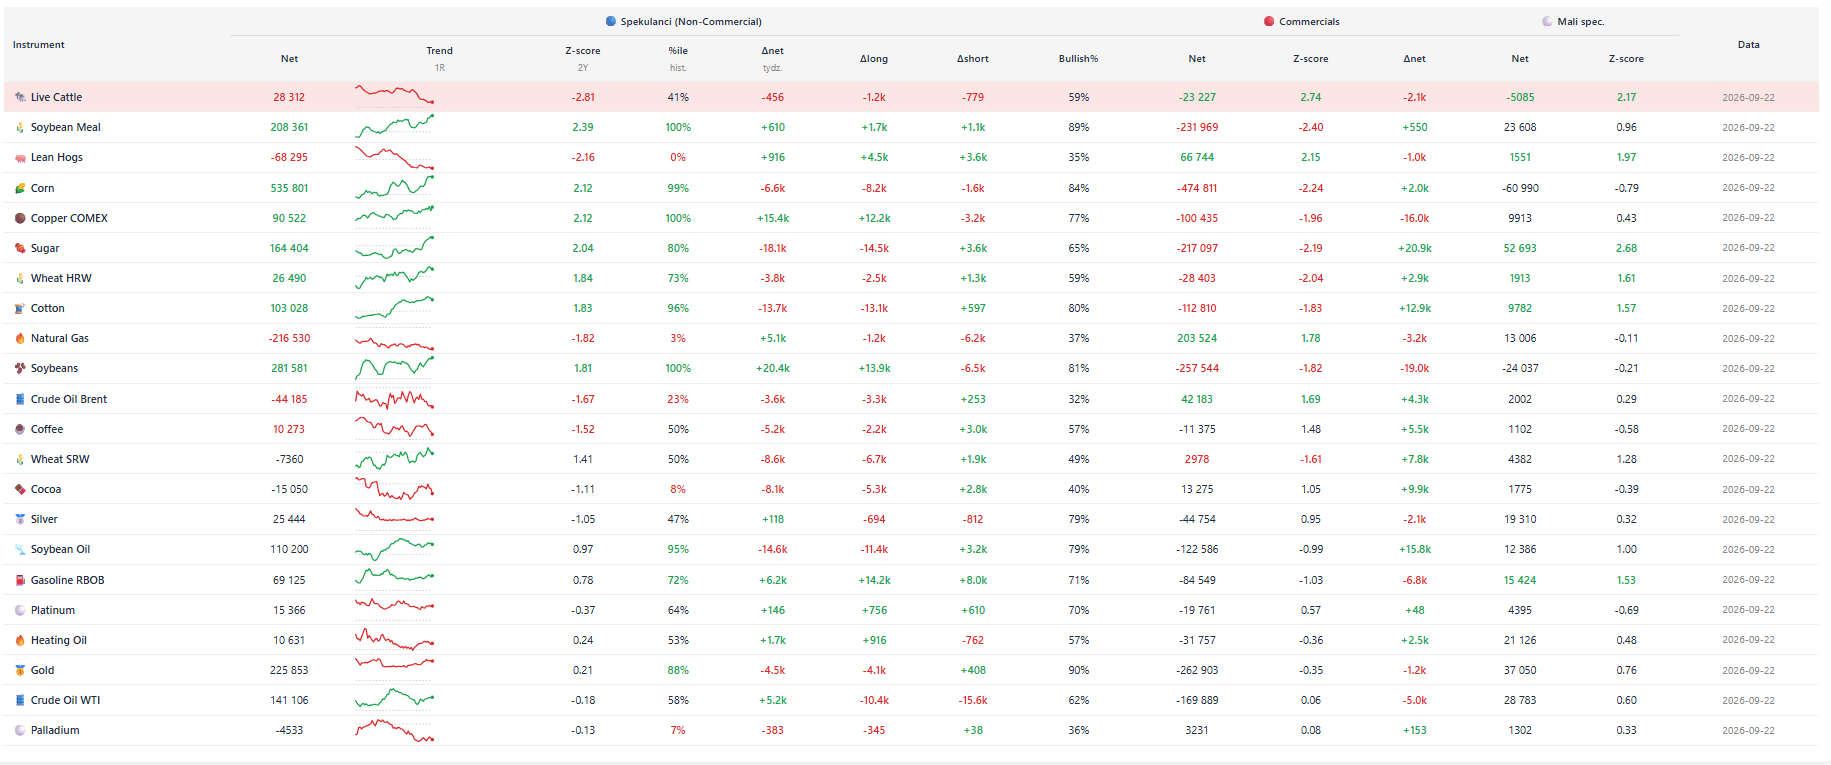
The most crowded long positions are in agriculture. Corn has 535,801 net contracts at a Z-score of 2.12 and the 99th historical percentile, soybeans at 281,581 with a Z-score of 1.81 and a full 100th percentile, and soybean meal at 208,361 with 2.39 and also the 100th percentile. COMEX Copper stands at 90,522 net contracts, a Z-score of 2.12, and the 100th percentile, after a weekly surge of 15.4 thousand. These are levels from which liquidation can be sharp, and September’s 6.92% drop in corn may be its first installment. On the opposite side, we have extreme pessimism. US Natural Gas holds a net position of minus 216,530 contracts, a Z-score of minus 1.82, and just the 3rd percentile. Lean Hogs stand at a Z-score of minus 2.16 and exactly the 0th percentile, the most negative reading in available history. Live Cattle is at minus 2.81 with the 41st percentile. Such extremes usually do not signal an immediate rebound, but they limit the room for further sell-offs, as there is no one left to sell. Interesting is the case of Brent crude oil, where speculators maintain a net position of minus 44,185 contracts with a Z-score of minus 1.67 and the 23rd percentile, despite a 40% price increase in the quarter. However, this applies to the NYMEX exchange, not ICE. WTI, with a Z-score of minus 0.18 and the 58th percentile, is much more neutral.
Valuations Relative to History
A comparison of deviations from five-year averages shows where valuation risk lies.
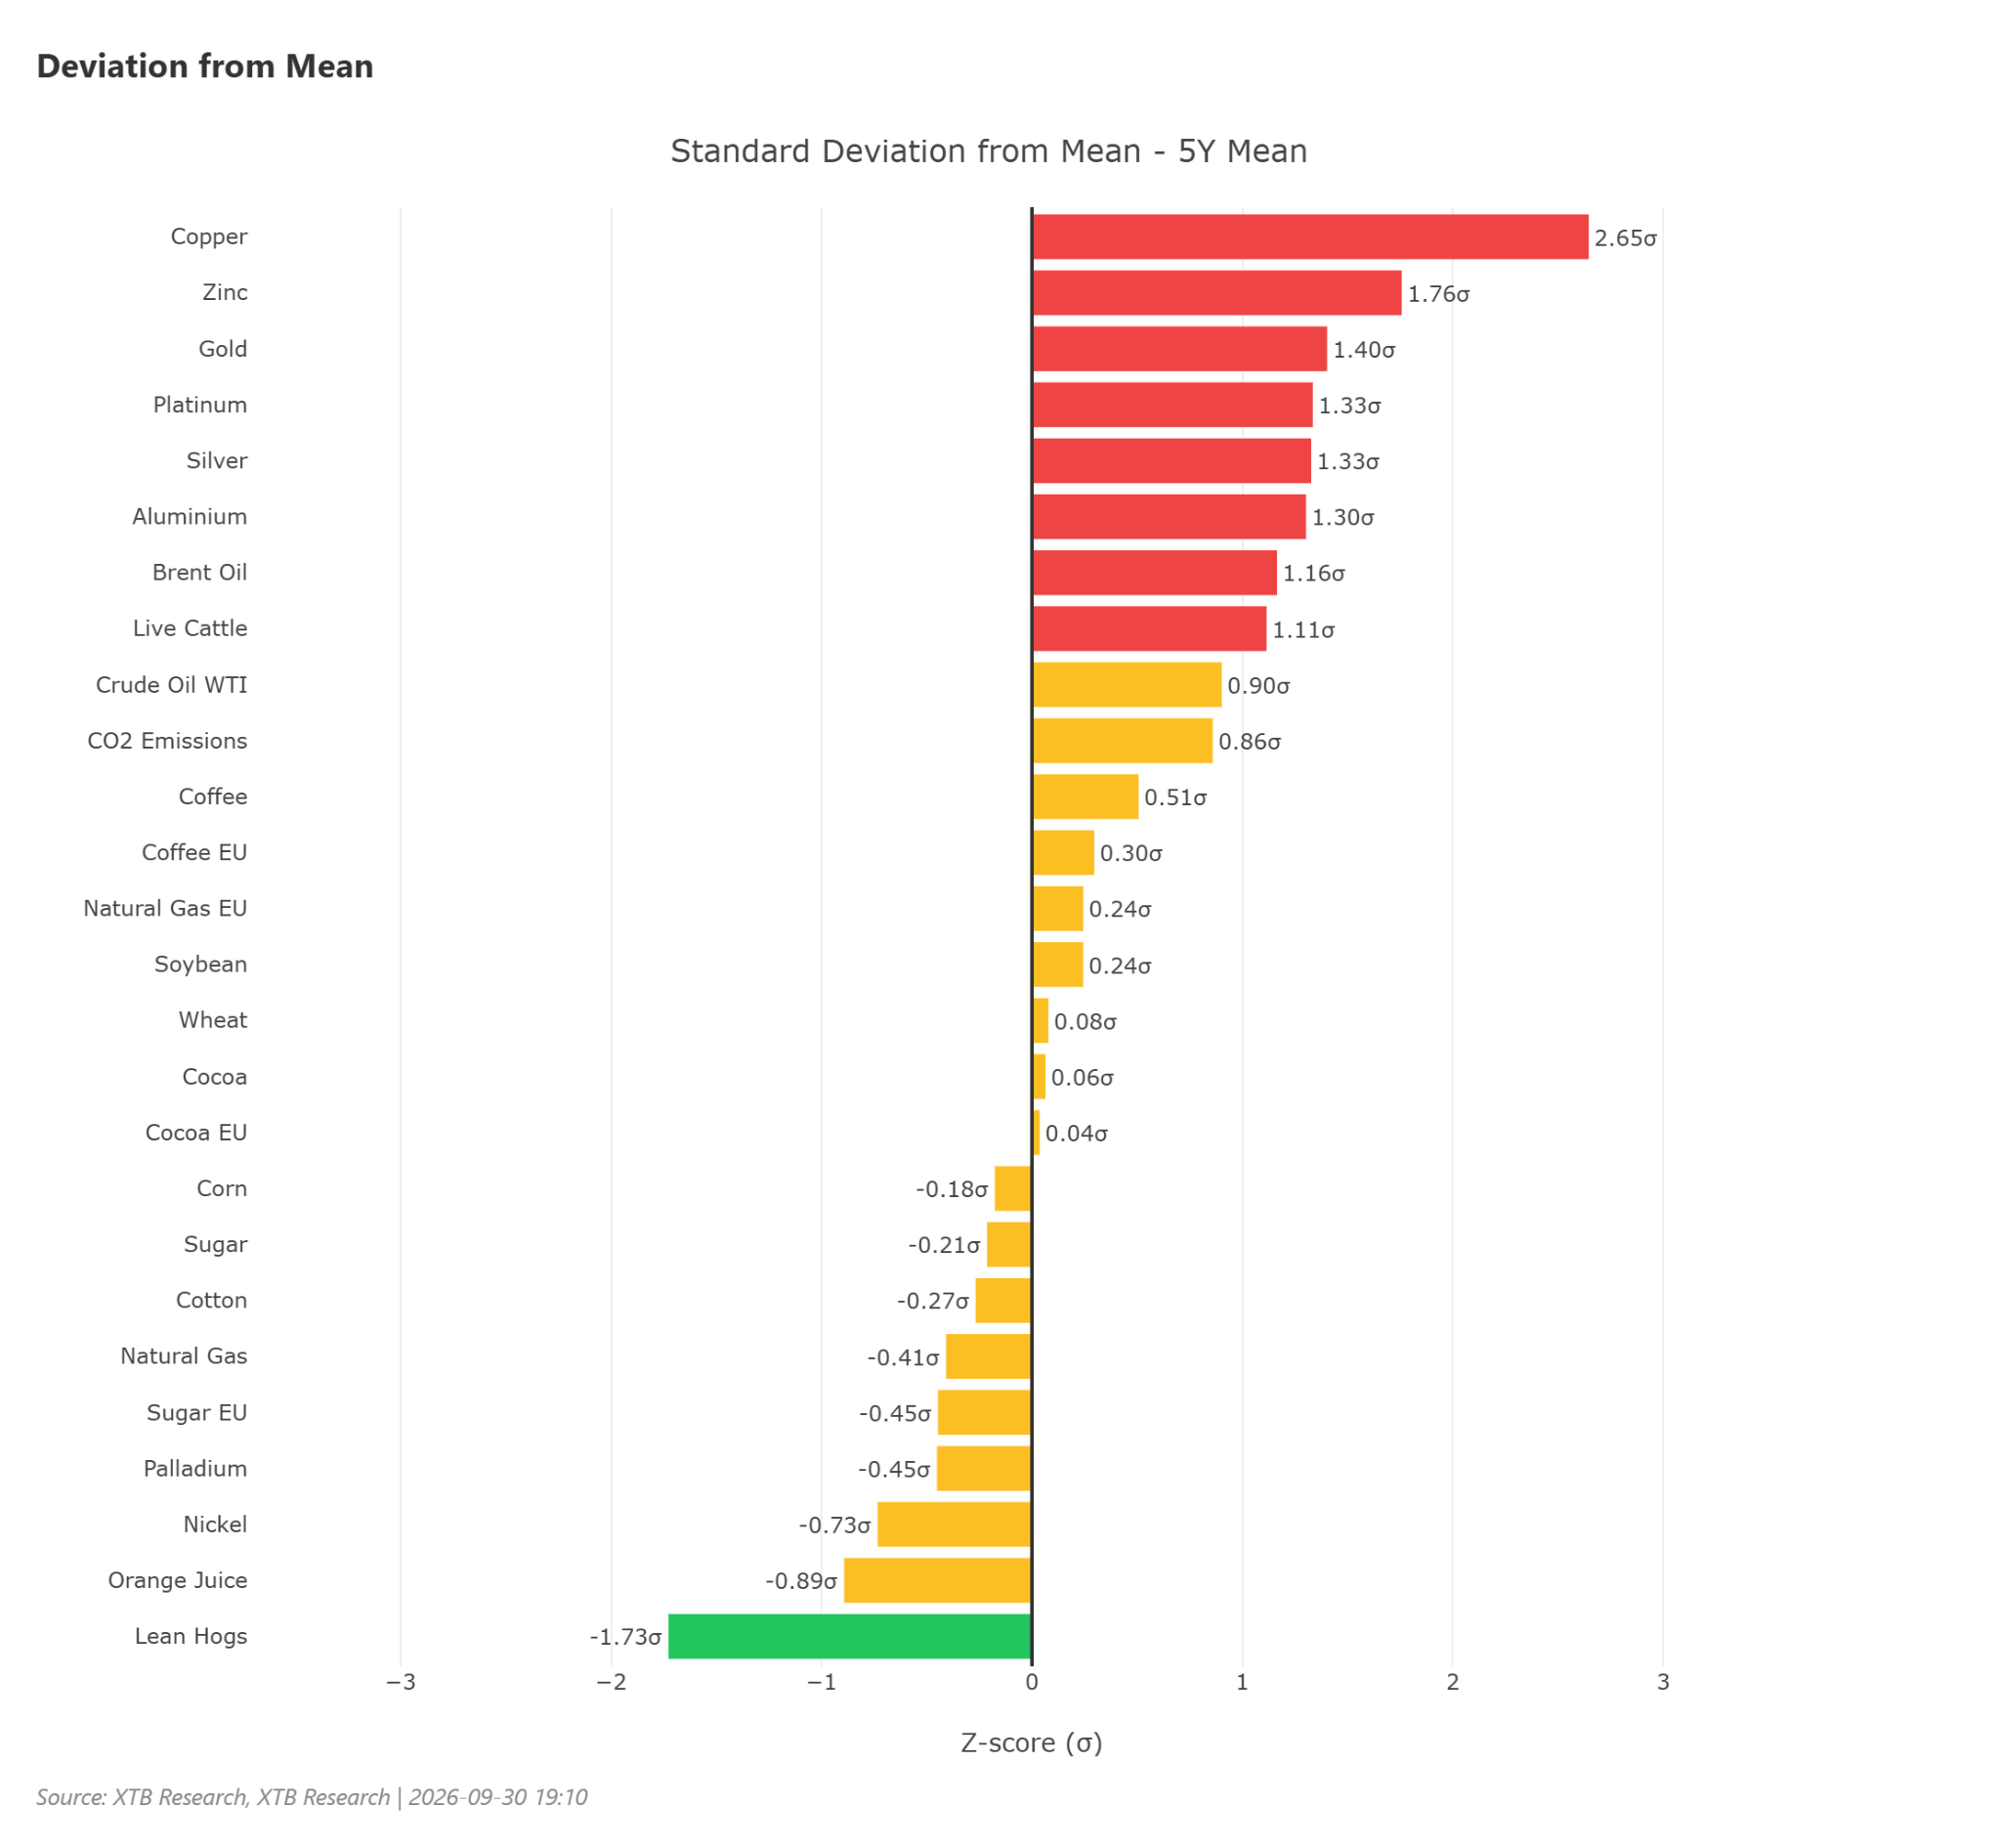
The most overbought relative to its average is copper: 2.65 sigma above the five-year average and 1.74 above the two-year average, at a price of USD 14,447. Zinc is at 1.76 sigma. Gold is at 1.41, silver at 1.33, and platinum at 1.33. None of these levels is a sell signal in itself, but combined with 5% yields in the US, it creates an unfavorable asymmetry for buyers. Copper is primarily a matter of recent supply disruption news rather than a temporary demand spike, though in the long term, copper certainly has strong fundamentals. The cheapest relative to history remain lean hogs at minus 1.75 sigma and orange juice at minus 0.89. US Natural Gas records minus 0.41 sigma, which, given the extremely negative positioning, creates one of the few setups where both valuation and market sentiment are at the same low level. Notable is the disparity in European gas: 2.61 sigma above the two-year average, but only 0.25 above the five-year average. In other words, the current price is extreme relative to the last two quieter years, but entirely normal in the context of the energy crisis Europe experienced earlier. This well reflects the nature of this market.
Technical Signals
The technical picture is consistent in a way that itself deserves comment. The MACD indicates a downward structure for twenty-one out of twenty-six instruments. For all energy commodities and most agricultural ones, moving averages remain bullish alongside a bearish MACD, indicating a correction within a trend rather than its reversal. The RSI signals oversold conditions in several places: lean hogs 17.3, cotton 20.3, EU sugar 21.6, wheat 23.0. Corn at 28.7 and aluminum at 29.5 are approaching this zone. On the opposite side, not a single instrument is overbought; copper is highest at 59.3 and live cattle at 60.1. This is the picture of a market after a wave of sell-offs, not before one.
What to Watch in the Fourth Quarter?
Hormuz and the War Premium. The return of exports to 98% of pre-war levels and the offer of 40 million barrels from the SPR work toward stripping away the premium. If negotiations led by Qatar yield a lasting solution, oil has significant downside room, and with it, inflationary pressure will ease. This in turn would support precious metals, so the correlation between these markets will be negative in the coming weeks. The Fed’s Path. The ten-year yield at 5.2% is the main drag on gold, silver, and platinum. August PCE data, weaker than forecasts, lowered the probability of an October rate hike from 64% to 34%. If this trend is confirmed, precious metals will get their first real breathing room in months. Heating Season in Europe. EU gas storage filled at around 65% compared to the norm reaching 82% and the 90% requirement is a setup that, at the first colder week, could trigger a sharp move. EU Gas is already the YTD leader and has the fundamentals to stay there. Liquidation of Long Positions in Agriculture. Corn, soybeans, and soybean meal at the 99th and 100th percentiles of historical positioning are an overhang that, upon any demand disappointment, could trigger a move much larger than fundamentals alone would justify. Copper at 2.65 Sigma. Demand from AI infrastructure and data centers is real and structural, but valuation has already priced in a great deal. With positioning at the 100th percentile, room for disappointment is wide.