




Market Situation
During today’s session on the commodities market, the agriculture and food sector is performing best, where orange juice (+3.18%) and sugar (+2.67%) continue strong weekly gains. Despite generally mixed sentiments – only 11 out of 26 observed assets are becoming more expensive – extremely high long-term valuations draw attention. Industrial and precious metals, led by copper (+3.19σ from the 5Y average) and gold (+3.11σ), remain drastically deviated upwards from their multi-year norms. In the short term, however, we are observing a slight correction in the precious metals segment (platinum -1.36%, silver -1.10%), mainly caused by the strengthening of the dollar and an increase in US Treasury bond yields. These factors pushed the price of gold below the level of 4400 USD per ounce, momentarily neutralizing the demand for safe havens. At the same time, rising geopolitical tensions in the Middle East, including reports of Houthi attacks on Saudi Aramco refineries, maintain a high risk premium in the fuel market. In the near future, observing further changes in the US debt market and the development of the situation around the Strait of Hormuz will be key for investors, which will directly affect the volatility of oil and bullion prices.
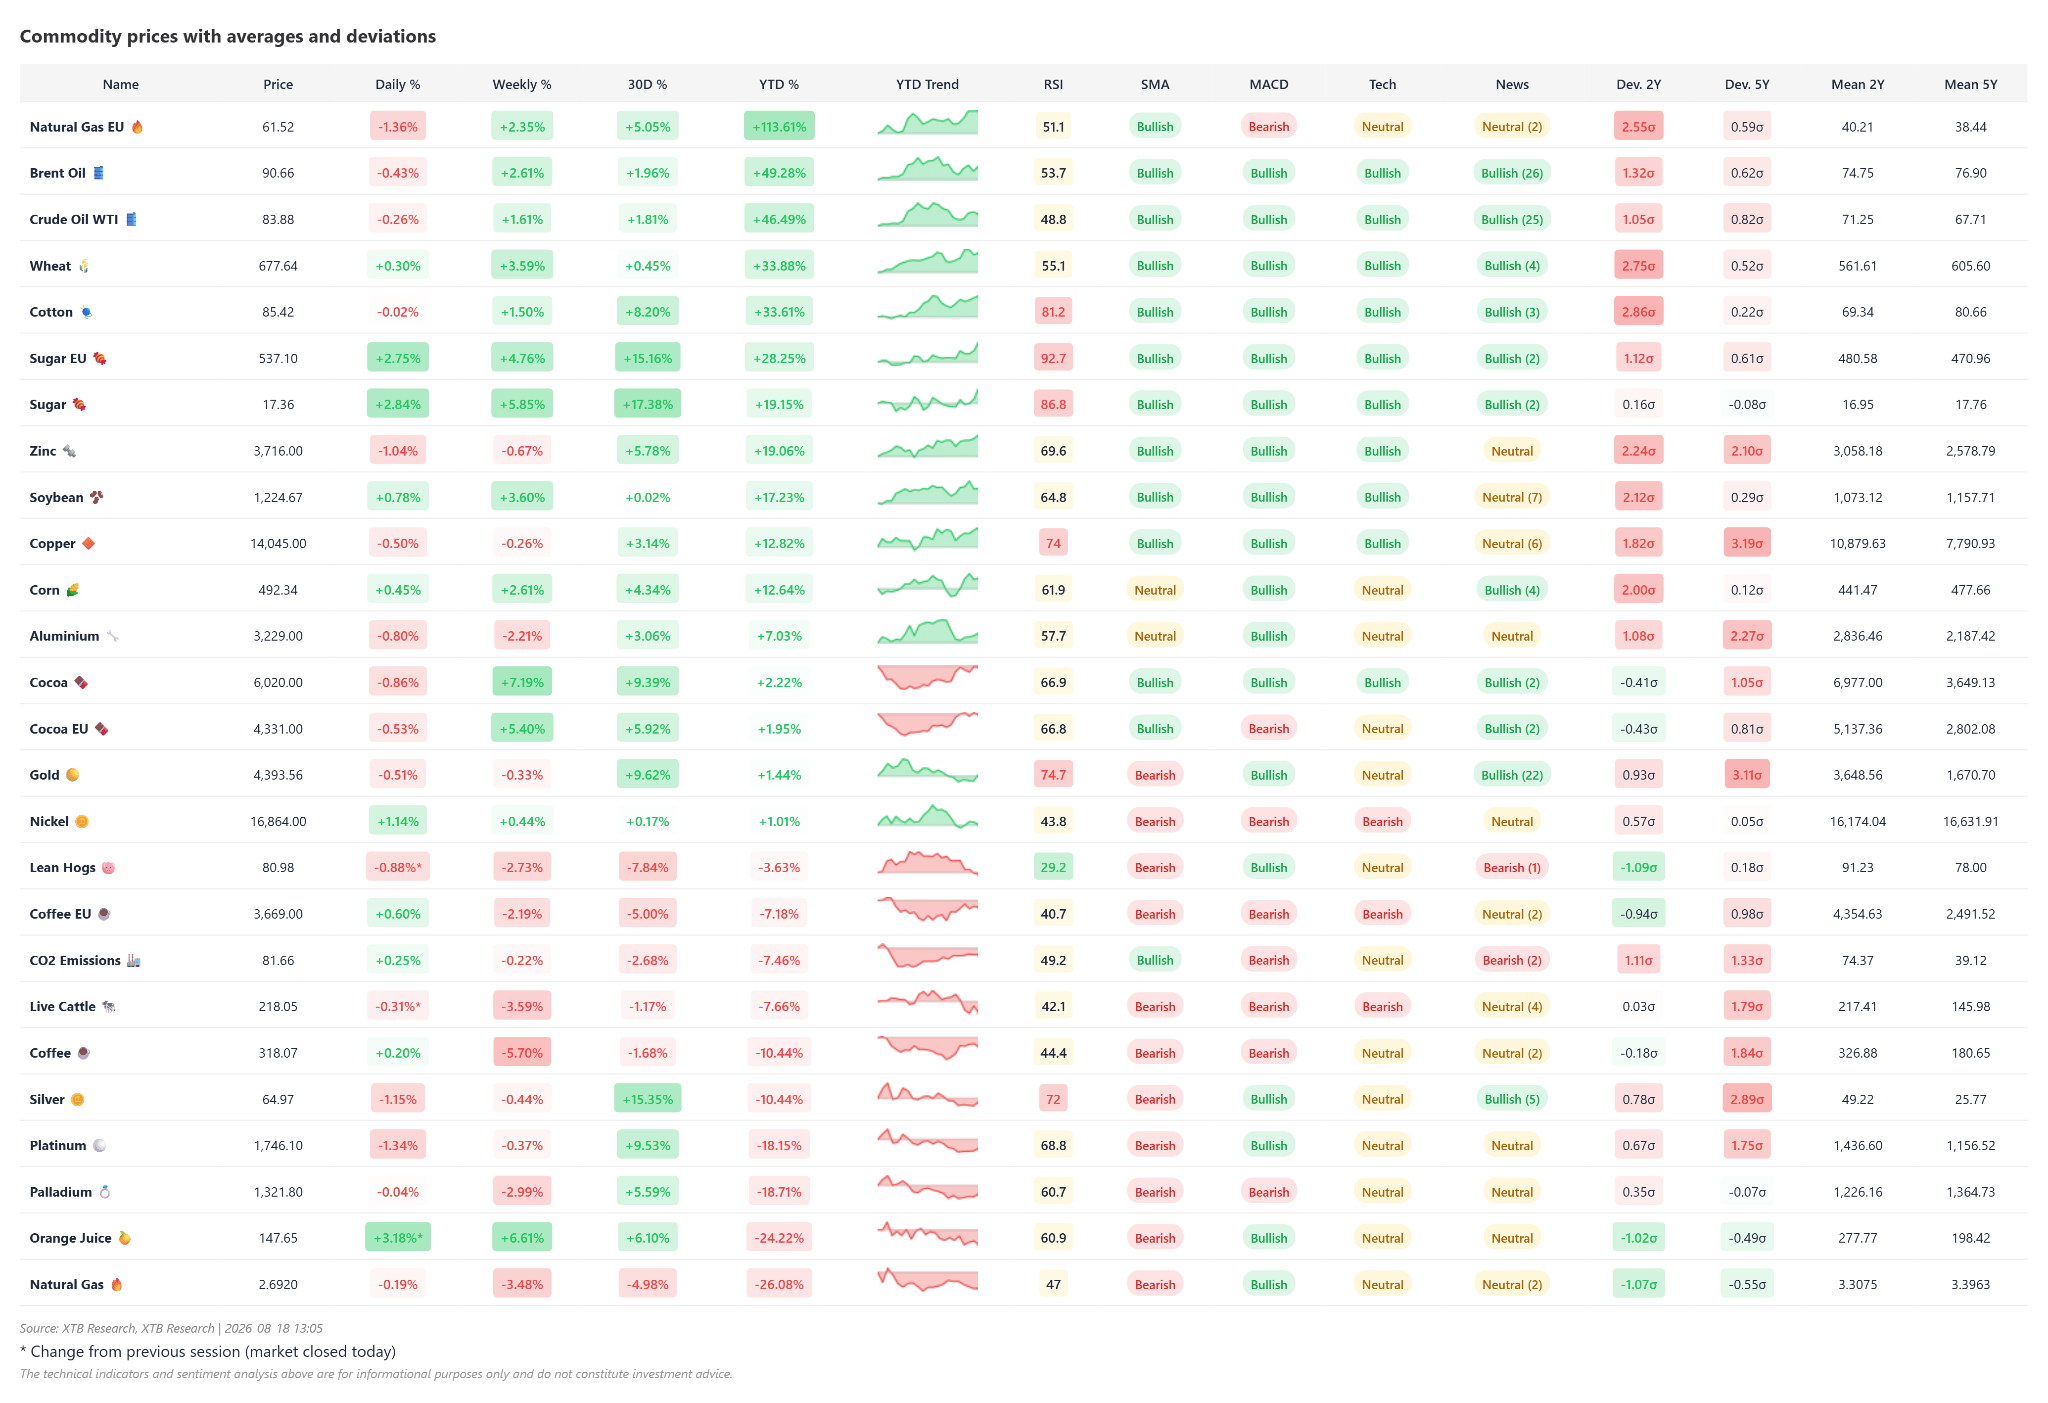
European gas, wheat, cotton, zinc, and soybeans remain clearly overbought relative to the 2-year average. Technically, precious metals other than gold remain quite clearly oversold. None of the commodities currently show extreme overselling in the medium term. Source: XTB
Copper
- Copper spot prices fell to 14008.0 USD per ton after an earlier test of around 14400 USD, reflecting an extremely strong market structure despite the slight current cooling.
- At the beginning of the new week, the price failed to close at a new historic high. The highest intraday level was 14515 reached on January 29, when we dealt with a metal market collapse (mainly gold and silver).
- On a daily basis, the price fell by 0.77%, and on a weekly scale, it slipped by 0.53%, which should be interpreted as natural profit-taking after previous dynamic increases. In the monthly horizon, copper gained 2.86%, has grown by 12.52% since the beginning of the year (YTD), and over the last twelve months, the rate of return is an impressive 44.68%.
- Such high annual dynamics confirm that this metal is in a structural bull market, driven by both macroeconomic factors and tensions in the physical supply chain.
- The Relative Strength Index (RSI) at level 71 signals copper’s entry into the overbought zone, which explains the minor downward correction observed in recent days. Moving averages (SMA) and the MACD indicator maintain strong bullish signals, and the price itself is 2.57% above its 50-day moving average (SMA50), confirming the dominance of buyers.
- Overall market sentiment remains bullish. The key resistance for further increases is the psychological barrier of 14200 USD and historical highs, while the most important technical support is placed in the SMA50 region at approximately 13650 USD, and in the case of a deeper retreat, at the round level of 13000 USD.
- The most important driver of current copper prices is the unprecedented tension in the physical market caused by the massive redirection of supplies to the United States. As reported by Bloomberg, importers and speculators are aggressively buying and shipping metal to the US, trying to get ahead of a potential decision by the Donald Trump administration to impose import tariffs on refined copper.
- This buying fever led to extreme market tightening (squeeze) on the LME exchange, where the spot price exceeded the three-month contract by as much as 400-500 USD per ton. Such a state of backwardation is the highest since the historic supply crisis of 2021 and clearly indicates the lack of physically available metal in warehouses.
- ING, in its latest commentary regarding copper, indicates that these supply constraints will strongly support prices in the near future. Long-term demand remains unshaken due to the energy transition, the expansion of data centers for artificial intelligence (AI), and difficulties in financing and launching new mining projects.
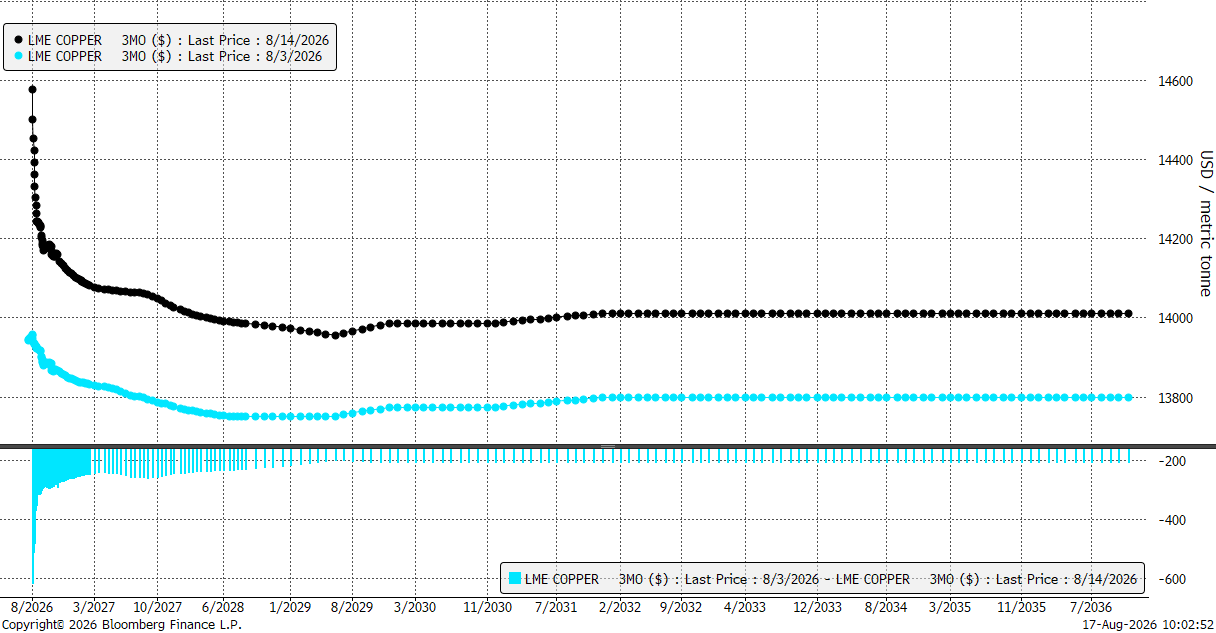
Forward curve from the copper market, where the spot market from a perspective of a few days is distant by as much as several hundred dollars on one ton. Source: Bloomberg Finance LP
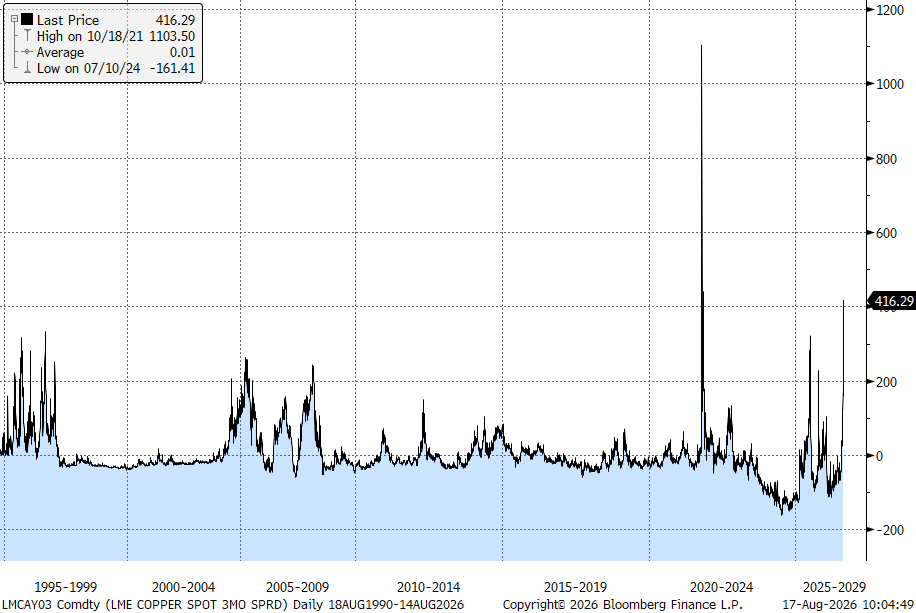
The difference between the spot price and the 3-month futures contract on the LME reaches over 400 USD. Source: Bloomberg Finance LP
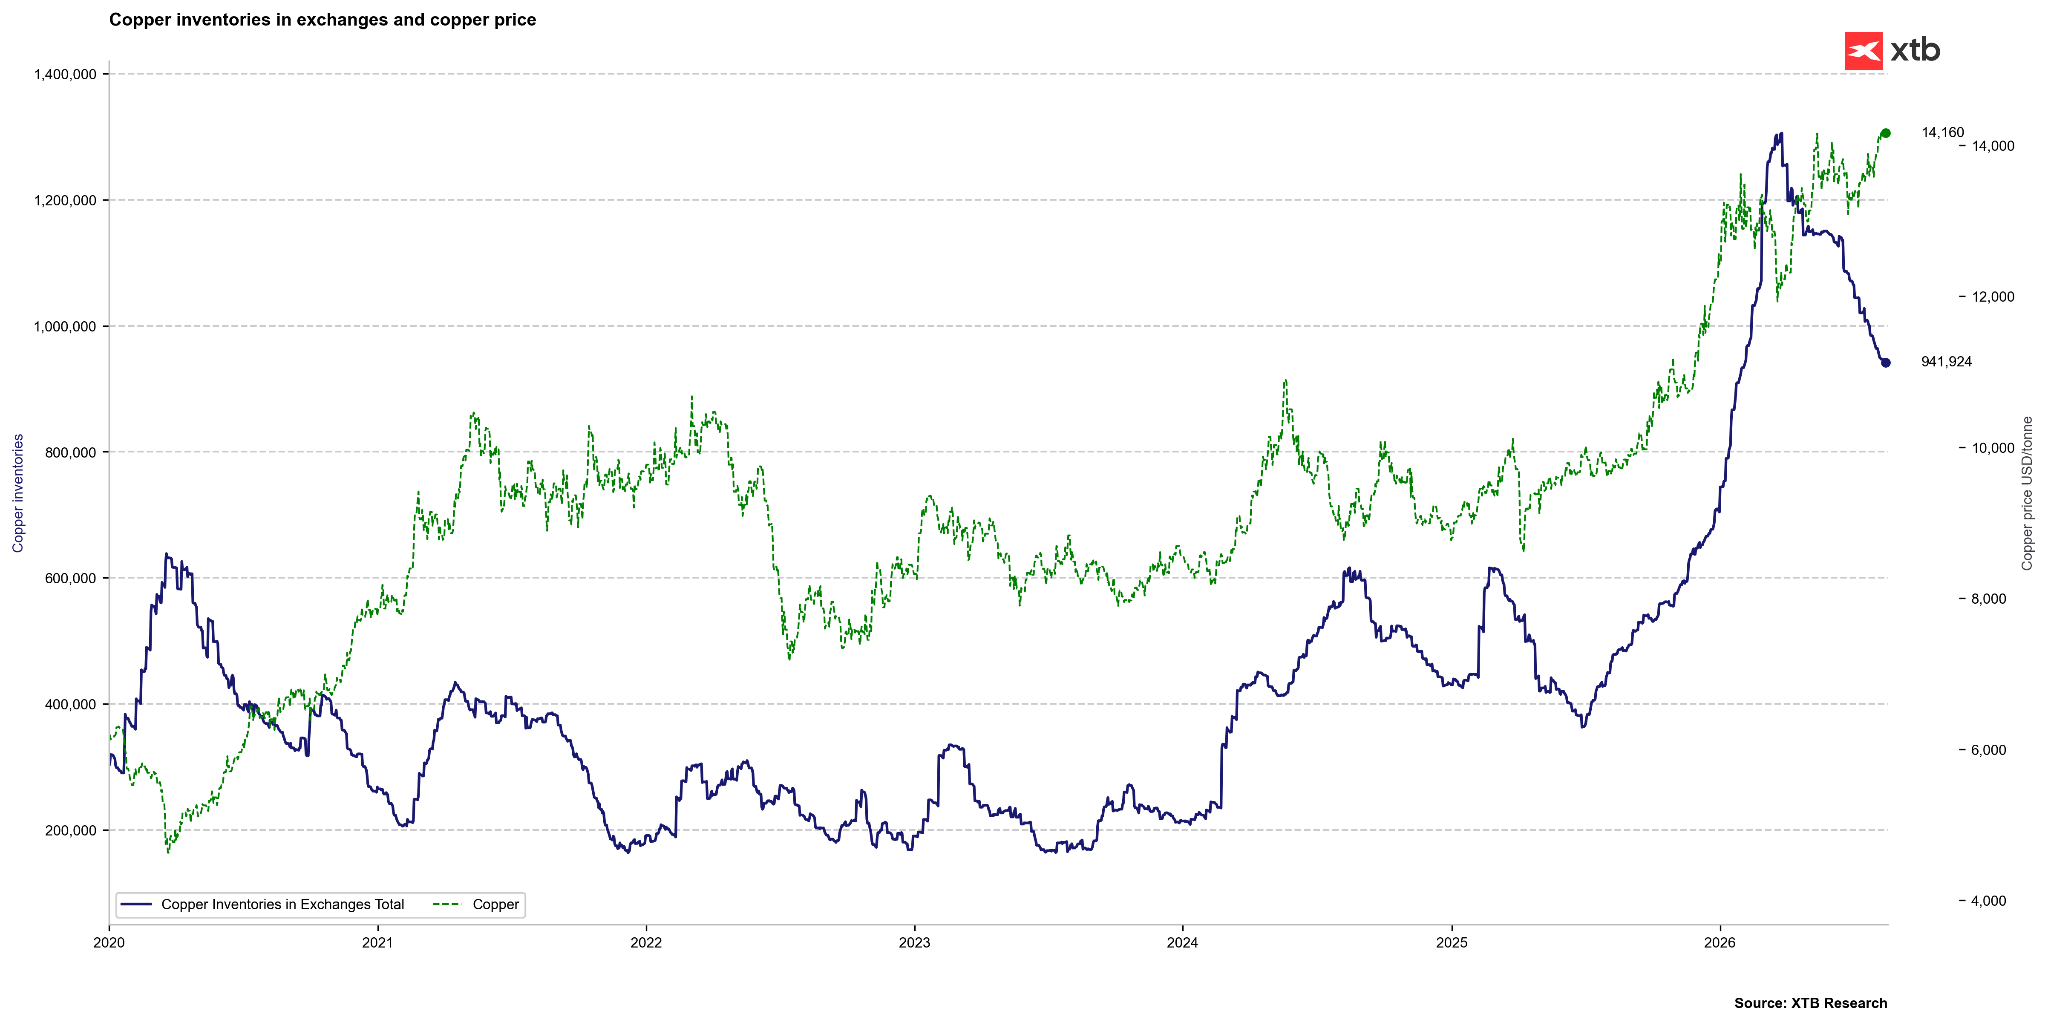
Inventories on the three largest exchanges are falling, which is primarily related to the shrinking of inventories in London and Shanghai. US inventories are growing all the time. Source: Bloomberg Finance LP, XTB
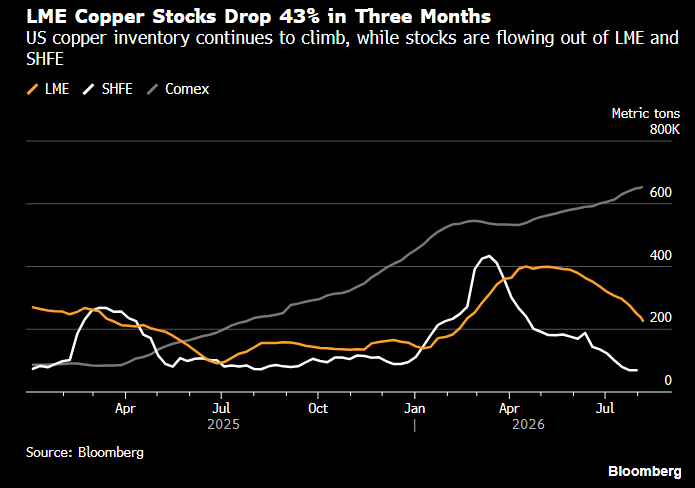
Copper inventories in China are extremely low, while almost the entire drop in London is related to the transfer of inventories to the US. Source: Bloomberg Finance LP
Historical Valuation (Z-score)
Analysis of standard deviation indicators (Z-score) indicates a significant historical overvaluation of copper, especially in the long horizon. The Z-score for the 1-year period (Z1Y) is +1.25, for the 2-year period (Z2Y) it reaches +1.80, and for the 5-year period (Z5Y) it stands at a very high level of +3.17. Analyzing the trajectory of the 5-year Z-score (currently +3.17, a month ago +3.01, three months ago +3.22, six months ago +3.34), we see that after a period of slight cooling of valuations from late spring and summer, the pressure on overvaluation in the last month has again begun to mount (increase from +3.01 to +3.17). This is a clear warning signal for medium-term investors, suggesting that the market is currently paying a high premium for the risk of physical shortage of the raw material.
Scenarios
- Bullish Scenario: Breaking resistance at the level of 14200 USD will open the way to a rally towards 14800 USD. The technical condition is for the price to stay above the SMA50, while the fundamental one in the medium term is the official introduction of tariffs by the US and further deepening of backwardation on the LME, testifying to the lack of real deliveries.
- Bearish Scenario: Breaking support at the level of 13650 USD (SMA50) may trigger cascading profit-taking with a target around 13000 USD. This scenario will materialize if the US administration withdraws from tariff rhetoric, leading to the resolution of logistical bottlenecks and the return of copper to LME warehouses.
Gold
- The price of gold on the spot market currently stands at 4391 USD per ounce (Source: xStation5). On a daily basis, the bullion is recording a drop of 0.61%, and on a weekly scale, it is losing 0.43%, which constitutes a momentary breather after the extremely dynamic rally of recent weeks.
- On a monthly basis, gold is recording a spectacular increase of 9.51%, contrasting with the relatively flat result since the beginning of the year (YTD +1.33%). An annual return at the level of +32.38% confirms, however, that gold remains one of the most desired hedging assets in 2026, reacting to a sudden jump in global geopolitical risk.
- After a highly speculative beginning of the year and an increase in negative correlation with US yields, investors are again turning to gold in the context of hedging against risk, both geopolitical and market-related associated with high valuations in the market.
- The RSI for gold is 74, which means the market is technically overbought and susceptible to short-term profit-taking. Interestingly, despite the MACD generating bullish signals and the price being as much as 5.77% above its 50-day moving average (SMA50), the long-term SMA arrangement is described as bearish, which may result from previous multi-month consolidation. Market sentiment is currently neutral. The key resistance level remains the psychological boundary of 4450-4500 USD per ounce, while the most important support is the SMA50 level, located around 4150 USD.
- The main driver of gold as the “most effective commodity investment of 2026” is a combination of macroeconomic and geopolitical factors. Yields on 30-year US Treasury bonds rose to their highest levels since 2007 (just before the outbreak of the global financial crisis), which usually weighed on non-interest-bearing gold. However, in current conditions, investors treat this increase in yields as a warning signal against entrenched, high inflation caused by the Middle East crisis and rising US debt.
- The ongoing conflict around the Strait of Hormuz and the failure of peace talks between the US and Iran build a powerful fear premium. Additionally, market attention is focused on the upcoming FOMC meeting, which will determine further dollar movements, while silver consolidates around 65 USD, waiting for an impulse from the gold market.
- Apart from strong demand from central banks in Q2 (almost 300 tons), we currently observe a clear return of speculative and long-term capital: the former in the form of an increase in long positions on COMEX and in Shanghai, and the latter in the form of a recovery on the side of ETF funds.
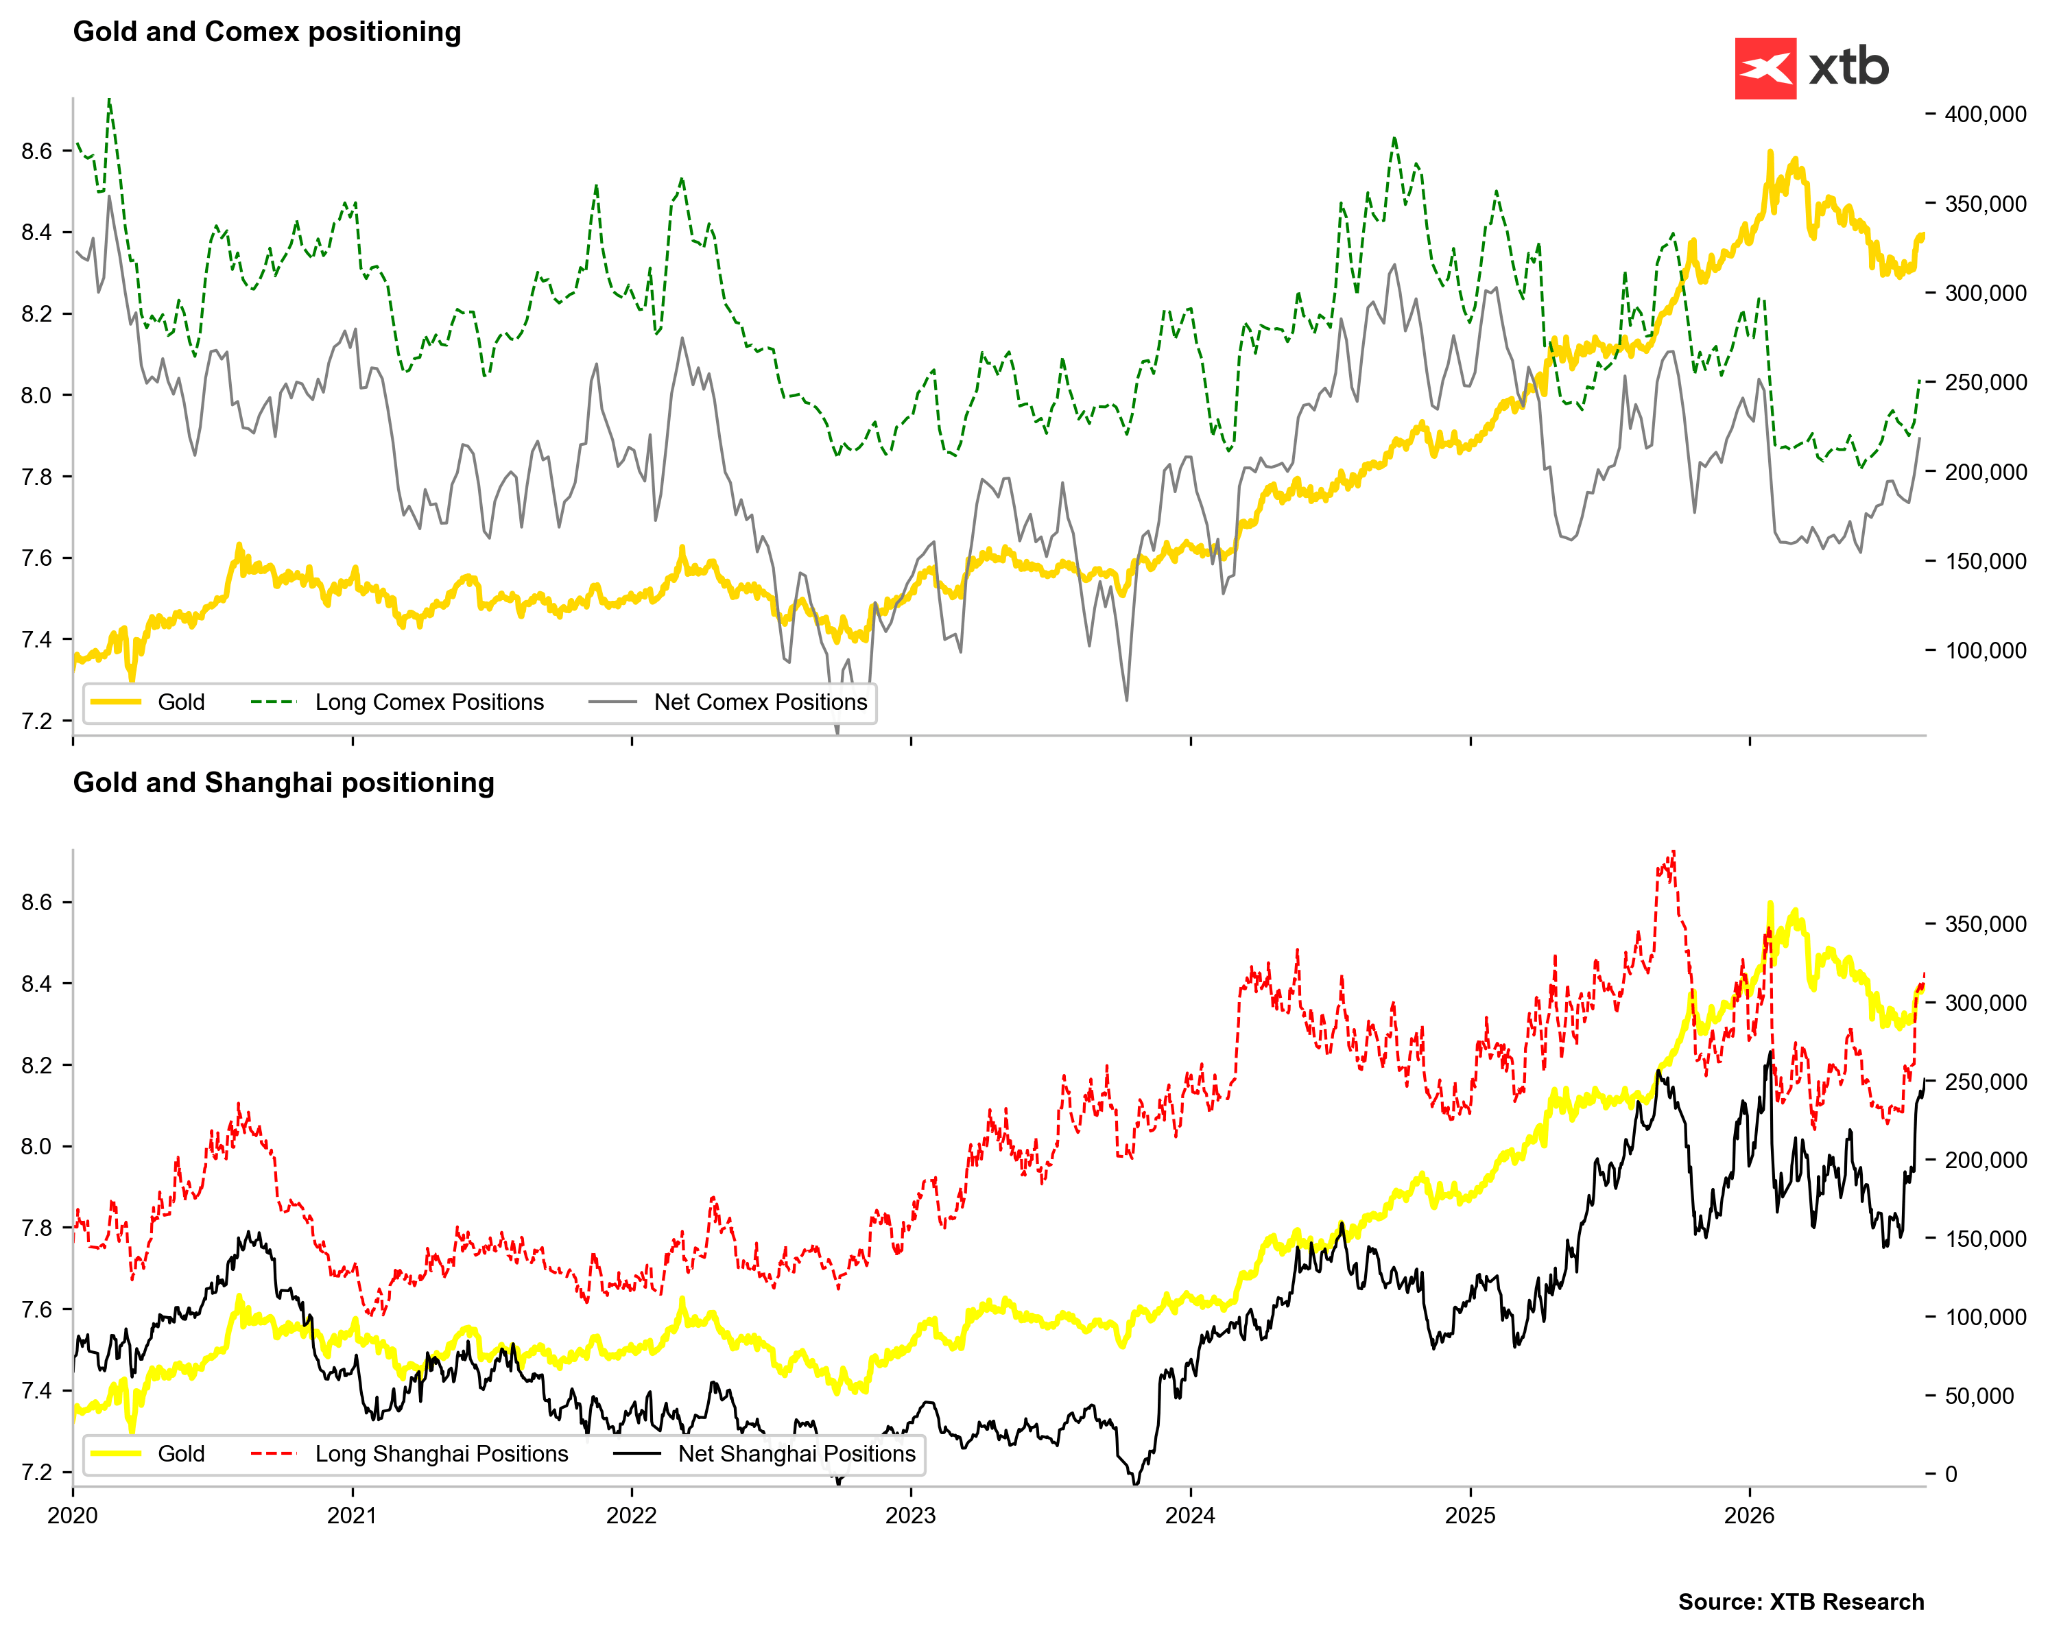
We continue to observe a recovery from buyers in China, but long and net positions on the American COMEX have also started to rebound. Source: Bloomberg Finance LP, XTB
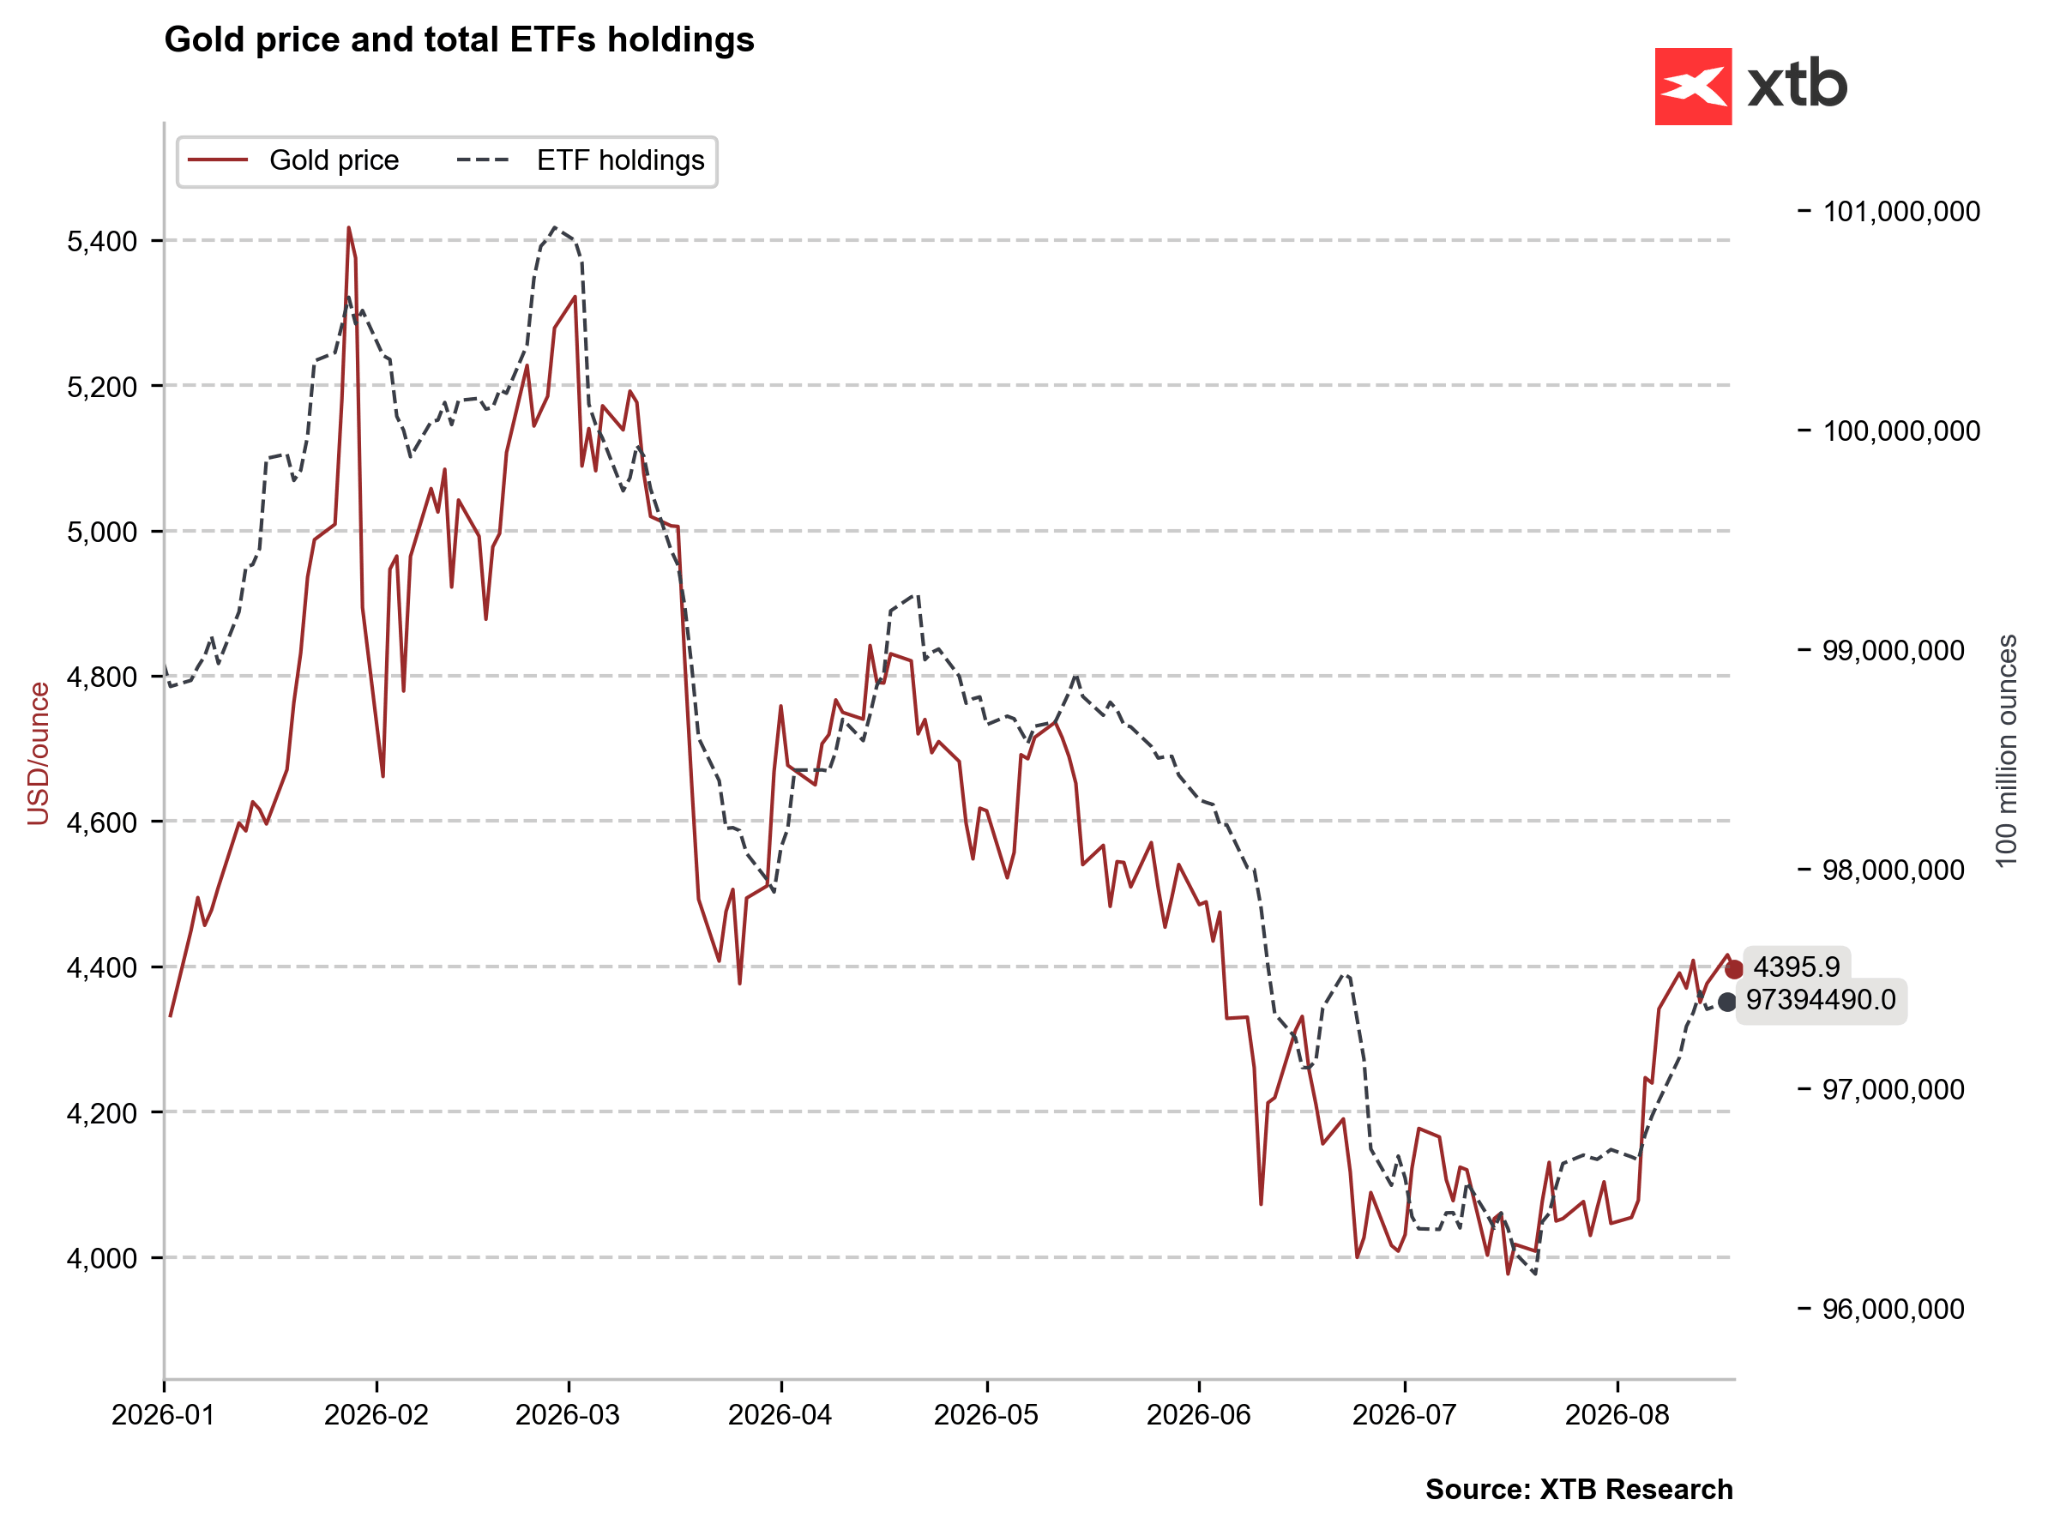
ETF funds continue to buy gold and the current rebound from mid-July is already greater than that recorded in April. Source: Bloomberg Finance LP, XTB
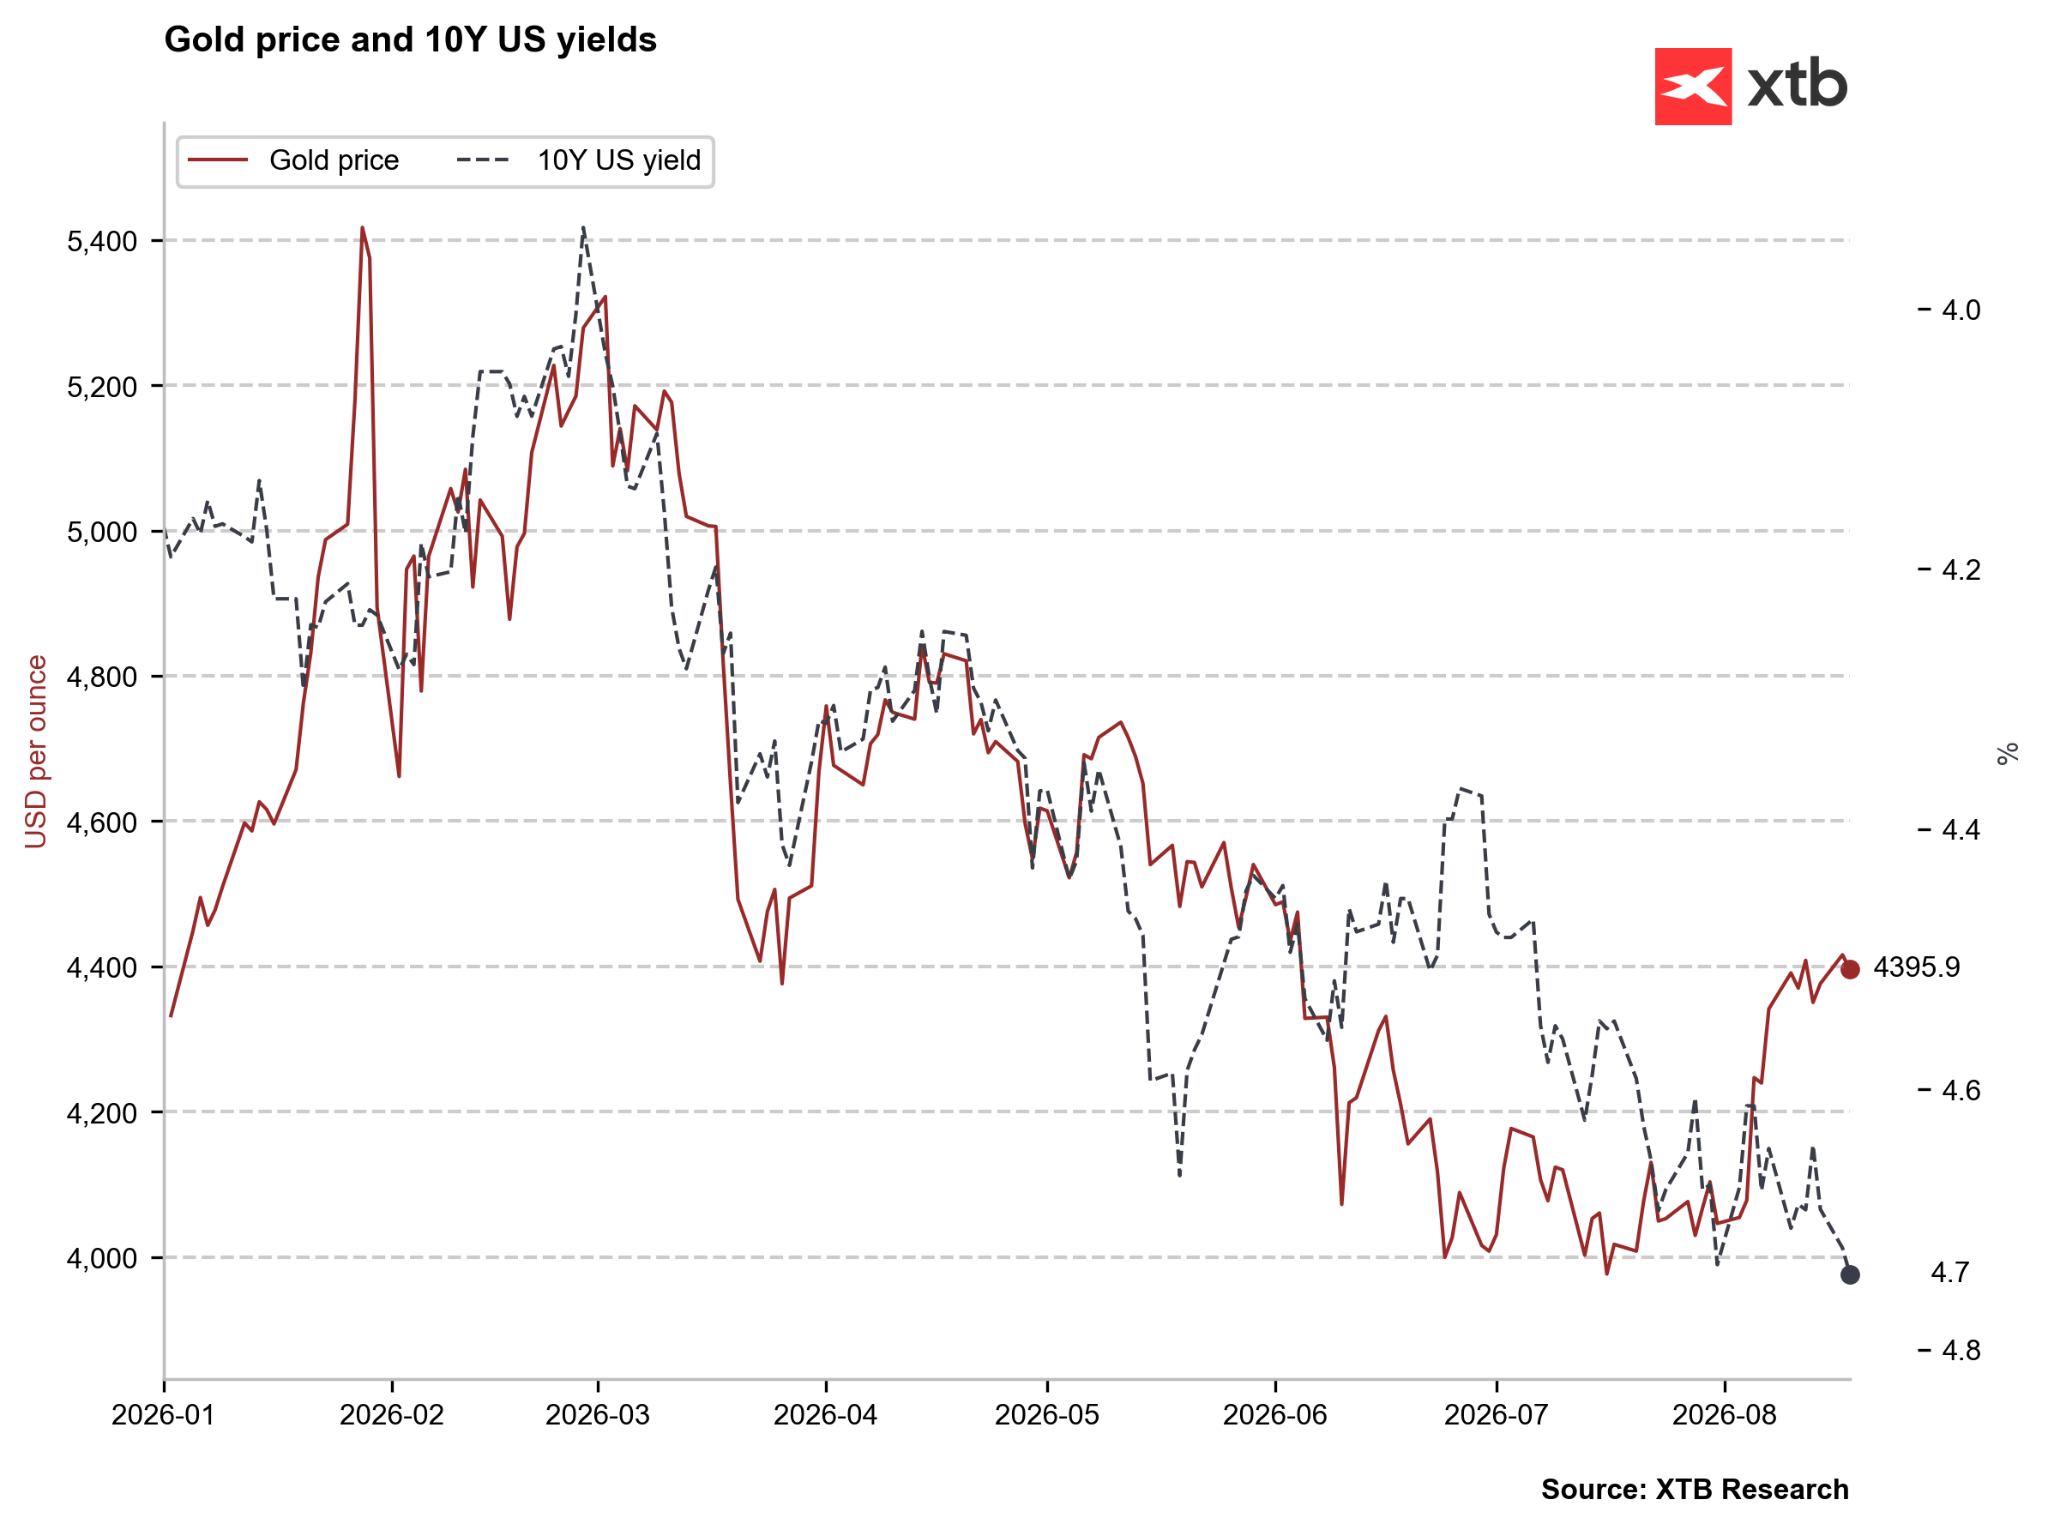
A weighing factor for gold may be the recent increase in yields, although at the same time it may result from long-term concerns about inflation (gold in the long term is positively correlated with inflation) and concerns about the fiscal situation in the USA. Source: Bloomberg Finance LP, XTB
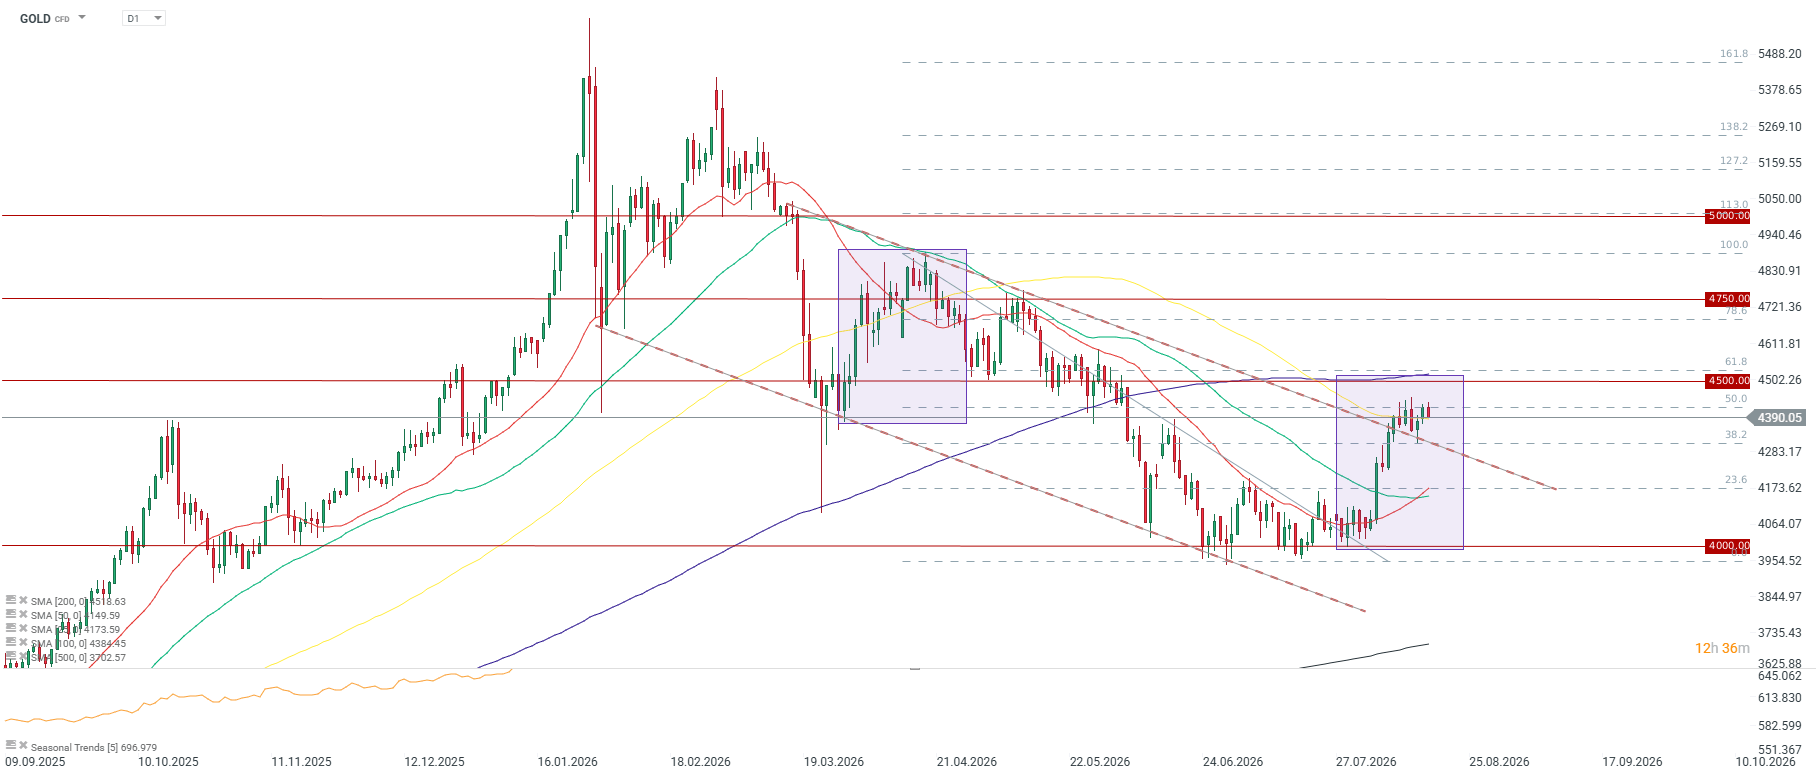
Gold is currently around the 100-period average, still resisting the resistance at the 50.0 retracement, which is at the level of 4400. The range of the rebound from April would indicate the possibility of testing around 4500 USD per ounce. Source: xStation5
Historical Valuation (Z-score)
Z-score indicators for gold appear ambiguous depending on the time horizon. The short-term Z1Y is only +0.08, suggesting a valuation close to the annual average, while Z2Y is +0.92. The true deviation is seen in the 5-year view, where Z5Y is as high as +3.11. Analysis of the historical Z5Y trajectory (currently +3.11, a month ago +2.75, three months ago +3.57, six months ago +4.54) provides key conclusions: after a sharp drop in overvaluation from an extreme level of +4.54 half a year ago to +2.75 a month ago, in recent weeks overvaluation has begun to grow again (+3.11). This means that after a period of summer normalization, the market is again entering a phase of slight overheating.
Scenarios
- Bullish Scenario: A breakout above 4450 USD will open the way for a test of the 4600 USD level, although there is also an important resistance zone at 4500 USD ahead of us. The fundamental condition is further long-term concern about inflation and a lack of reaction from the American Fed, which may affect the weakening of the dollar.
- Bearish Scenario: A drop below support at the 4300 USD level could bring the price towards the SMA50 (4150 USD). The condition for such a development of events would be a sudden agreement between Washington and Tehran and a hawkish surprise from the Fed, raising real interest rates.
Oil WTI
- The price of WTI oil is slightly above 84 USD per barrel. On a daily basis, the commodity was rising by about 0.3%, but just before 12, almost the entire upward move was neutralized. Nonetheless, since Monday, we have still been observing a large upward move related to the escalation of the situation in the Middle East. On a weekly scale, it brought an increase of 2.14%, and on a monthly scale by 2.34%. Crude oil is one of the unquestionable leaders in rates of return in 2026, as since the beginning of the year (YTD) its price has risen by 47.26% (nominal rate of return not including futures contract rollovers), while in annual terms it has gained 36.04%. These data show that the oil market has permanently broken out of previous low oscillation ranges and moved to higher price levels, reacting to geopolitical supply blockades.
- The RSI indicator for WTI oil is 50, which indicates full market neutrality and a lack of signals about overbuying or overselling. Both moving averages (SMA) and MACD generate bullish signals, and the current price is 7.51% above its 50-day moving average (SMA50). Technical market sentiment is described as bullish. The nearest and key resistance is the zone around 88.00-90.00 USD per barrel, which has been preventing stronger increases for a long time. Key support is at the SMA50 level (approx. 78.40 USD) and at the psychological boundary of 80.00 USD.
- The fundamental situation in the oil market is dominated by a geopolitical impasse in the Middle East. According to the AFP agency, hopes for a quick agreement between the US and Iran on opening the Strait of Hormuz collapsed after Donald Trump refused to extend the 60-day truce, and Tehran considered the current memorandum dead.
- Additional tension was triggered by Trump’s threats regarding a possible strike on Oman if it interfered with American plans for control of the strait.
- US Treasury Secretary Scott Bessent announced for next week the imposition of sanctions on Iran on a scale “the world has not seen yet.” On the demand-supply side, JODI/OPEC data indicate some cooling of domestic demand in China, which forced local refineries to increase fuel exports by 6.7% m/m (although y/y exports fell by 12.9% due to swelling domestic inventories). Despite this, concerns about a physical blockade of deliveries through Hormuz prevail over weaker data from Asia.
- In the United States, we still see huge tension in the fuel market. The spread between diesel and oil already reaches 100 USD on a barrel and equals the levels observed in 2022.
- An important factor in the context of fuels is the ongoing El Niño, which statistically led to less intense hurricanes in the autumn period in the United States, which may mean normal fuel production in the coming weeks.
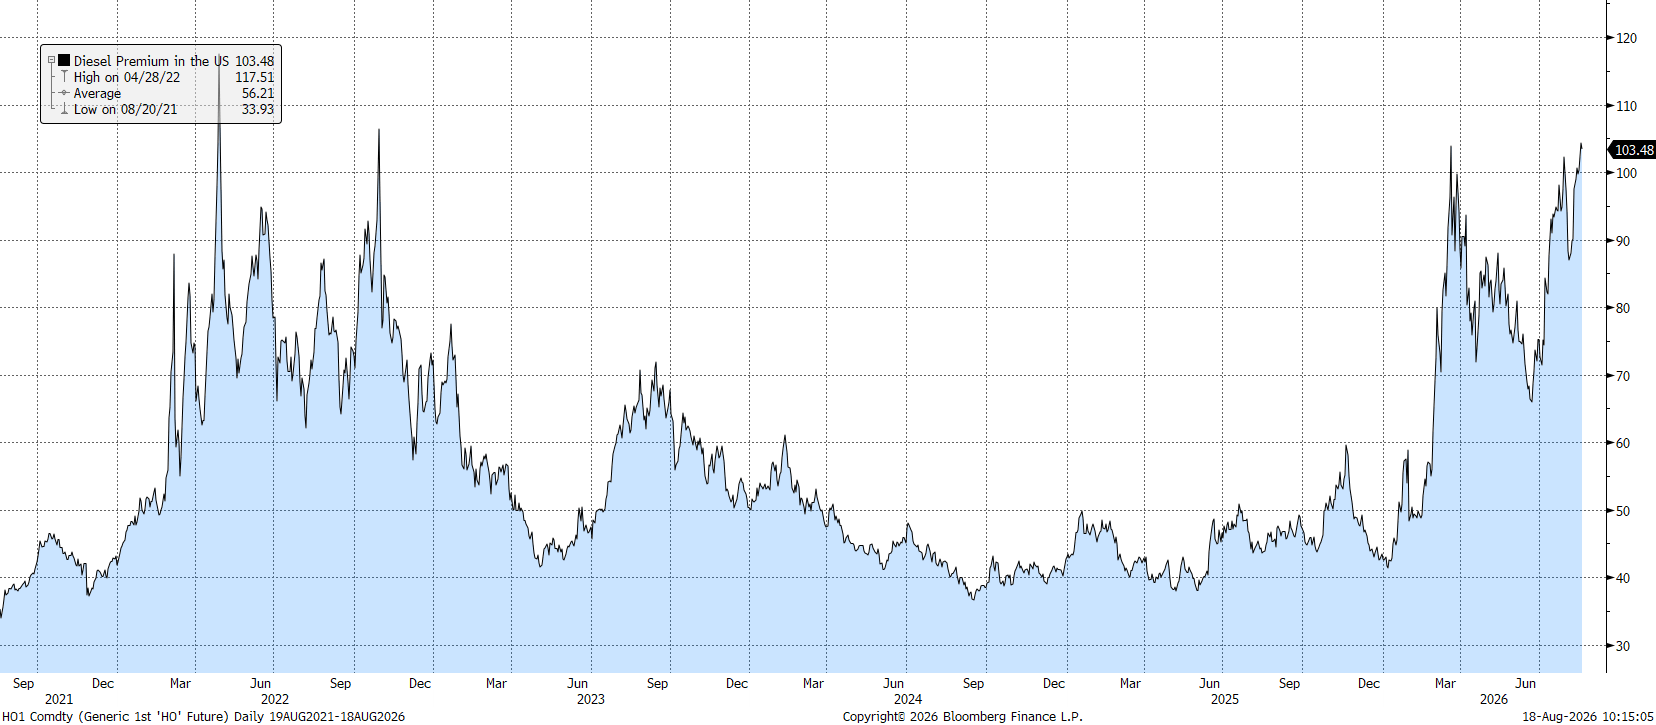
The diesel premium over the oil price in the US rose above 100 dollars per barrel. Source: Bloomberg Finance LP, XTB
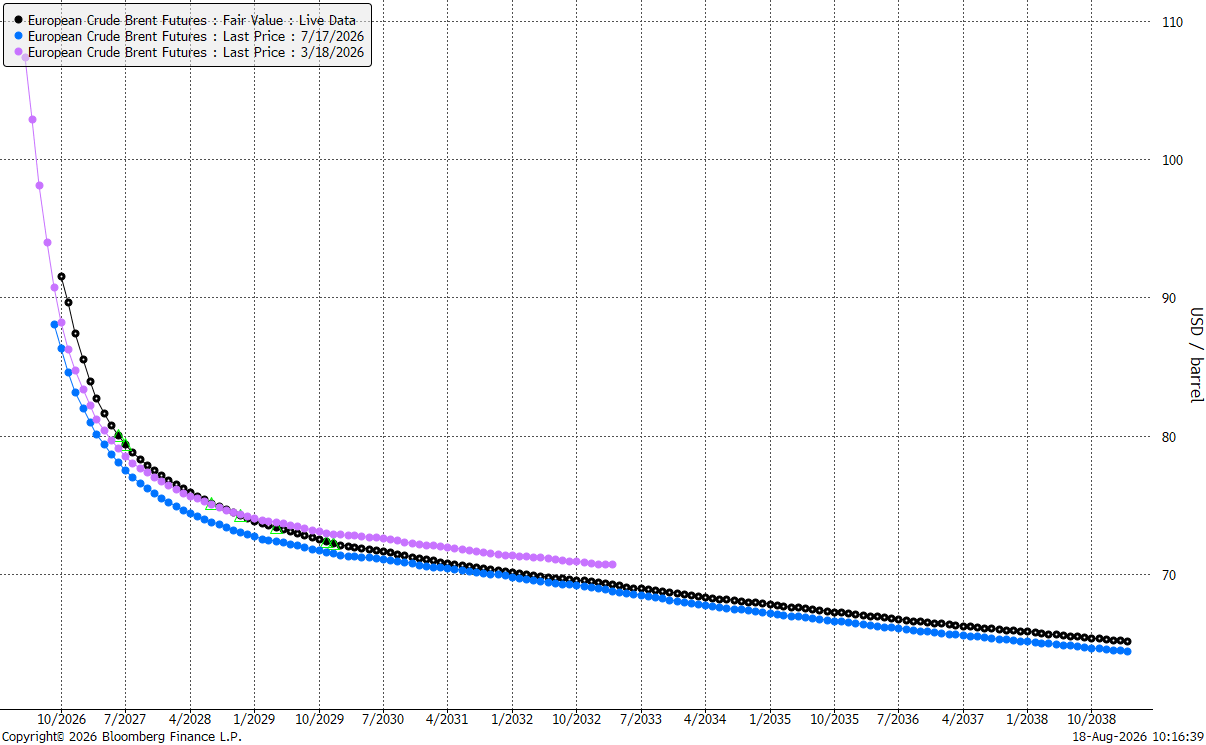
The current forward curve resembles the shape of the curve from 4 months ago, which may mean that with the current status in the Middle East maintained, the current curve may be an important determinant. Brent oil is valued at 80 USD per barrel in July 2027. Source: Bloomberg Finance LP
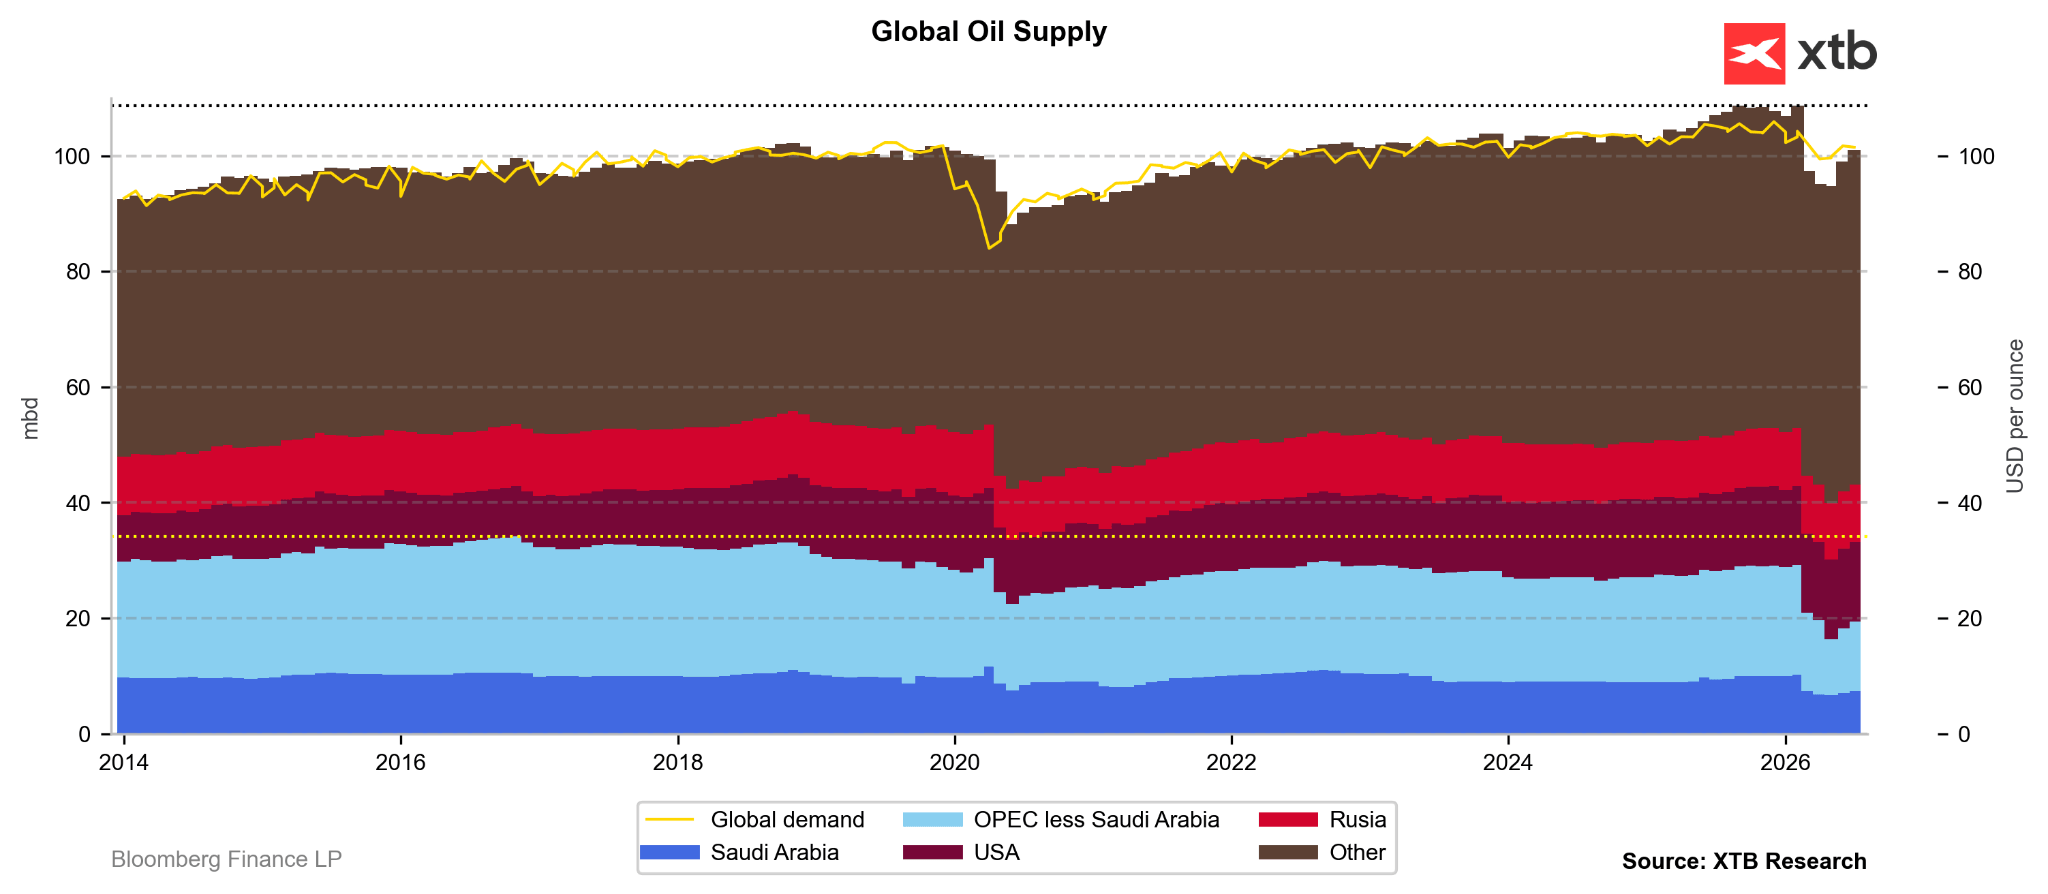
The crude oil market in July was relatively balanced, which was possible thanks to a rebound in production in the Middle East and demand destruction in Asia. A price increase to 100 USD could lead to a further drop in demand. Source: Bloomberg Finance LP, XTB
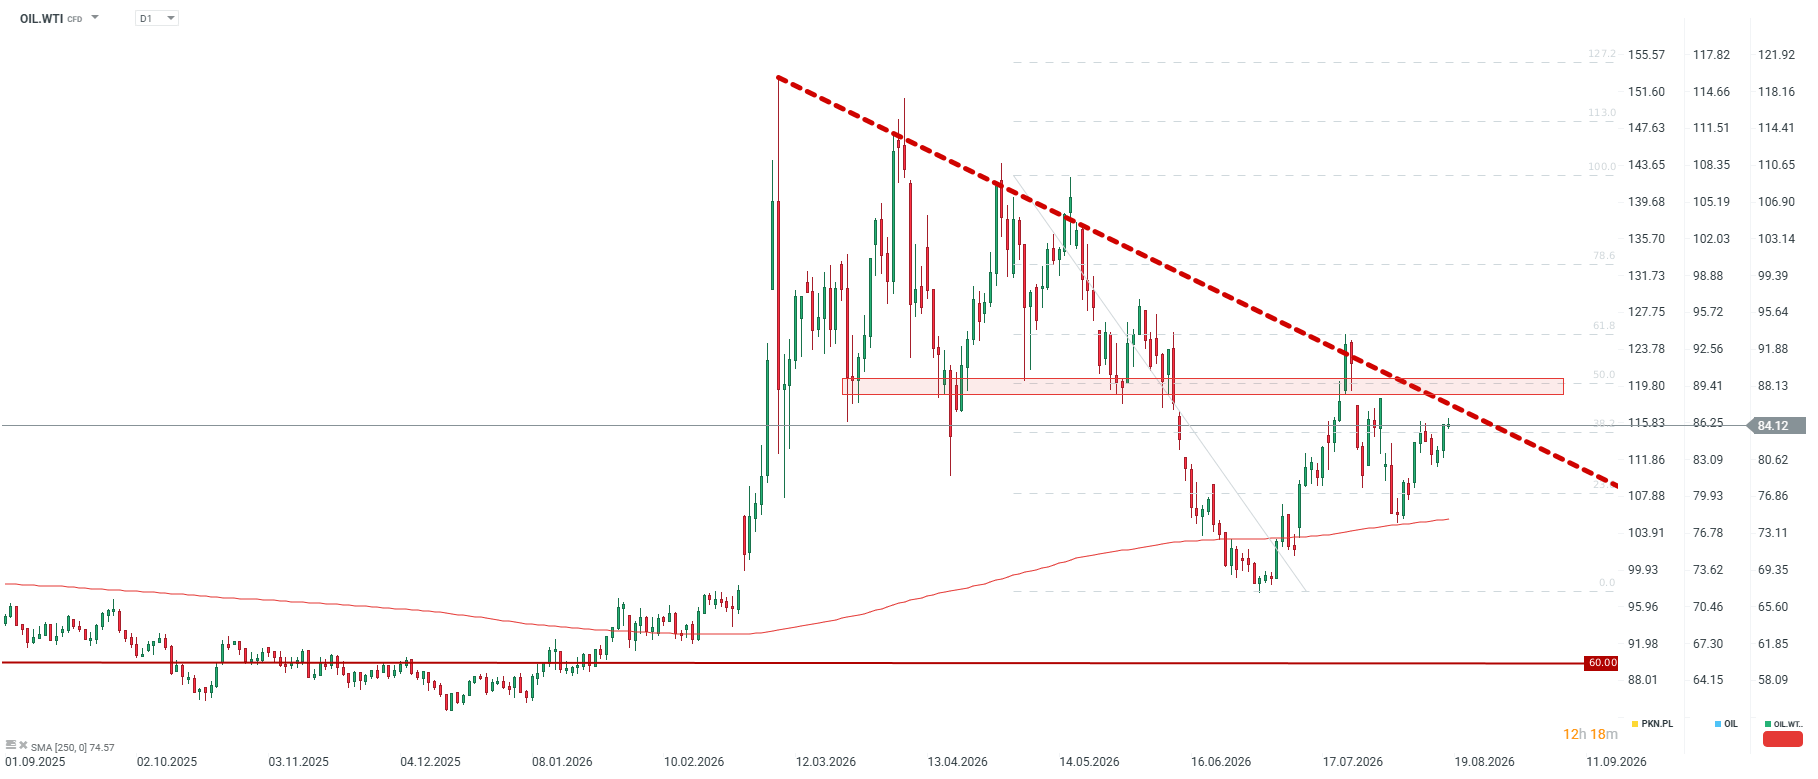
WTI oil pulls back slightly from its highest levels since the end of July. However, the price remains below the key resistance zone at 88-90 USD and below the downward trend line. Source: xStation5
Historical Valuation (Z-score)
Z-score indicators suggest that despite strong YTD gains, the valuation of WTI oil in a broader time horizon remains relatively moderate. The 1-year Z-score (Z1Y) is +0.65, 2-year (Z2Y) is +1.09, and 5-year (Z5Y) stands at +0.84. Analysis of the Z5Y trajectory (currently +0.84, a month ago +0.72, three months ago +2.02, six months ago -0.24) reveals interesting dynamics. After a sudden jump in valuation 3 months ago (+2.02), which was a reaction to the outbreak of the crisis, the market underwent a deep normalization to the level of +0.72, and is currently showing a delicate upward trend (+0.84). This means that the current price is stabilizing close to historical averages, which reduces the risk of a sudden speculative bubble burst.
Scenarios
- Bullish Scenario: Breaking resistance at the 88.00 USD level and moving towards 95.00 USD per barrel. This scenario will materialize in the event of further escalation of the situation in the Middle East, and above all an American strike on oil infrastructure in Iran.
- Bearish Scenario: Falling below support at the 80.00 USD level with a target at the SMA50 (78.40 USD). The technical condition is a permanent break of the 80 USD barrier, and the fundamental one – de-escalation of the conflict through Oman’s diplomacy and further growth of commercial inventories in the USA and China, with a simultaneous slowdown in global demand.
Natgas
- As of August 18, 2026, natural gas prices in the US (NATGAS) are at 2.692 USD/MMBtu.
- On a daily basis, the commodity records a cosmetic loss of -0.19%, fitting into a broader, strongly downward trend observed in recent weeks. On a weekly scale, gas is becoming cheaper by 3.48%, and in a monthly perspective, the drop already reaches almost 5%.
- The most telling, however, is the rate of return from the beginning of the year (YTD), which amounts to as much as -26.08%, which clearly testifies to the structural weakness of this market in 2026. Compared to the same period last year, the price is lower by 2.39%.
- These data show that the natural gas market in the US is under high supply pressure, even though during the winter period stocks fell clearly below the 5-year average.
- From a technical perspective, the NATGAS market image remains under the dominant influence of the bears. The price of the instrument is as much as 9.45% below its 50-day moving average (SMA50), confirming a strong, medium-term downward trend. Nevertheless, some short-term indicators are starting to send warning signals for sellers. The MACD indicator generated a bullish signal, which may herald an attempt to determine a local bottom or transition into a consolidation phase. The RSI oscillator is at 47, which means neutral territory and leaves space for movement in both directions without the risk of immediate overbuying or overselling of the market.
- Overall market sentiment is described as neutral. The key support level for market bulls remains the psychological barrier of 2.50 USD/MMBtu, while the nearest important technical resistance is the region of 2.95 USD/MMBtu (coinciding with the SMA50) and the 3.00 USD/MMBtu level.
- The fundamental situation in the natural gas market is torn between record-high domestic supply in the US and growing global geopolitical tension, which indirectly affects the global LNG market. According to current reports from the US Energy Information Administration (EIA), the high level of shale gas production in the United States and high stock levels (significantly exceeding the 5-year average for this time of year) effectively suppress demand pressure.
- The situation is also not favored by seasonality: in the second half of August, the market enters the so-called shoulder season, when the demand for energy for air conditioning begins to fall, and the heating demand has not yet appeared. This will lead to a clear increase in inventories again.
- On the other hand, the global energy landscape is extremely tense due to events in the Middle East. The price of Brent oil exceeded the barrier of 91 USD per barrel, and TTF gas, whose price is linked to the global LNG market, rose to 62 EUR/MWH after an unidentified missile hit a commercial ship passing through the strategic Strait of Hormuz.
- Although this incident directly hits the oil market (WTI consolidates below 84.50 USD, showing a strong upward structure), it is of colossal importance for gas. The Strait of Hormuz is a key artery for Qatari LNG.
- As indicated by the latest Bloomberg Intelligence report, the so-called “Hormuz Strait shock” forces Gulf countries to deeply revise investment plans towards building infrastructure resilience.
- ADNOC (UAE national concern) is considering building an LNG terminal on the east coast so as not to be dependent on the flow of gas carriers through the strait.
- A possible blockade or further escalation in the region could cut off a significant part of global liquefied gas supplies to Europe and Asia, which would trigger a rapid increase in LNG gas prices. Theoretically, natural gas prices in the USA could also react upwardly, despite clearly supply-side foundations in the USA.
- Additionally, improving economic sentiment in Europe (the German ZEW institute index rose in August to 34.2 points, outperforming forecasts at 30.0 points) may, in the long term, herald a stronger recovery in industrial demand for blue fuel on the Old Continent.
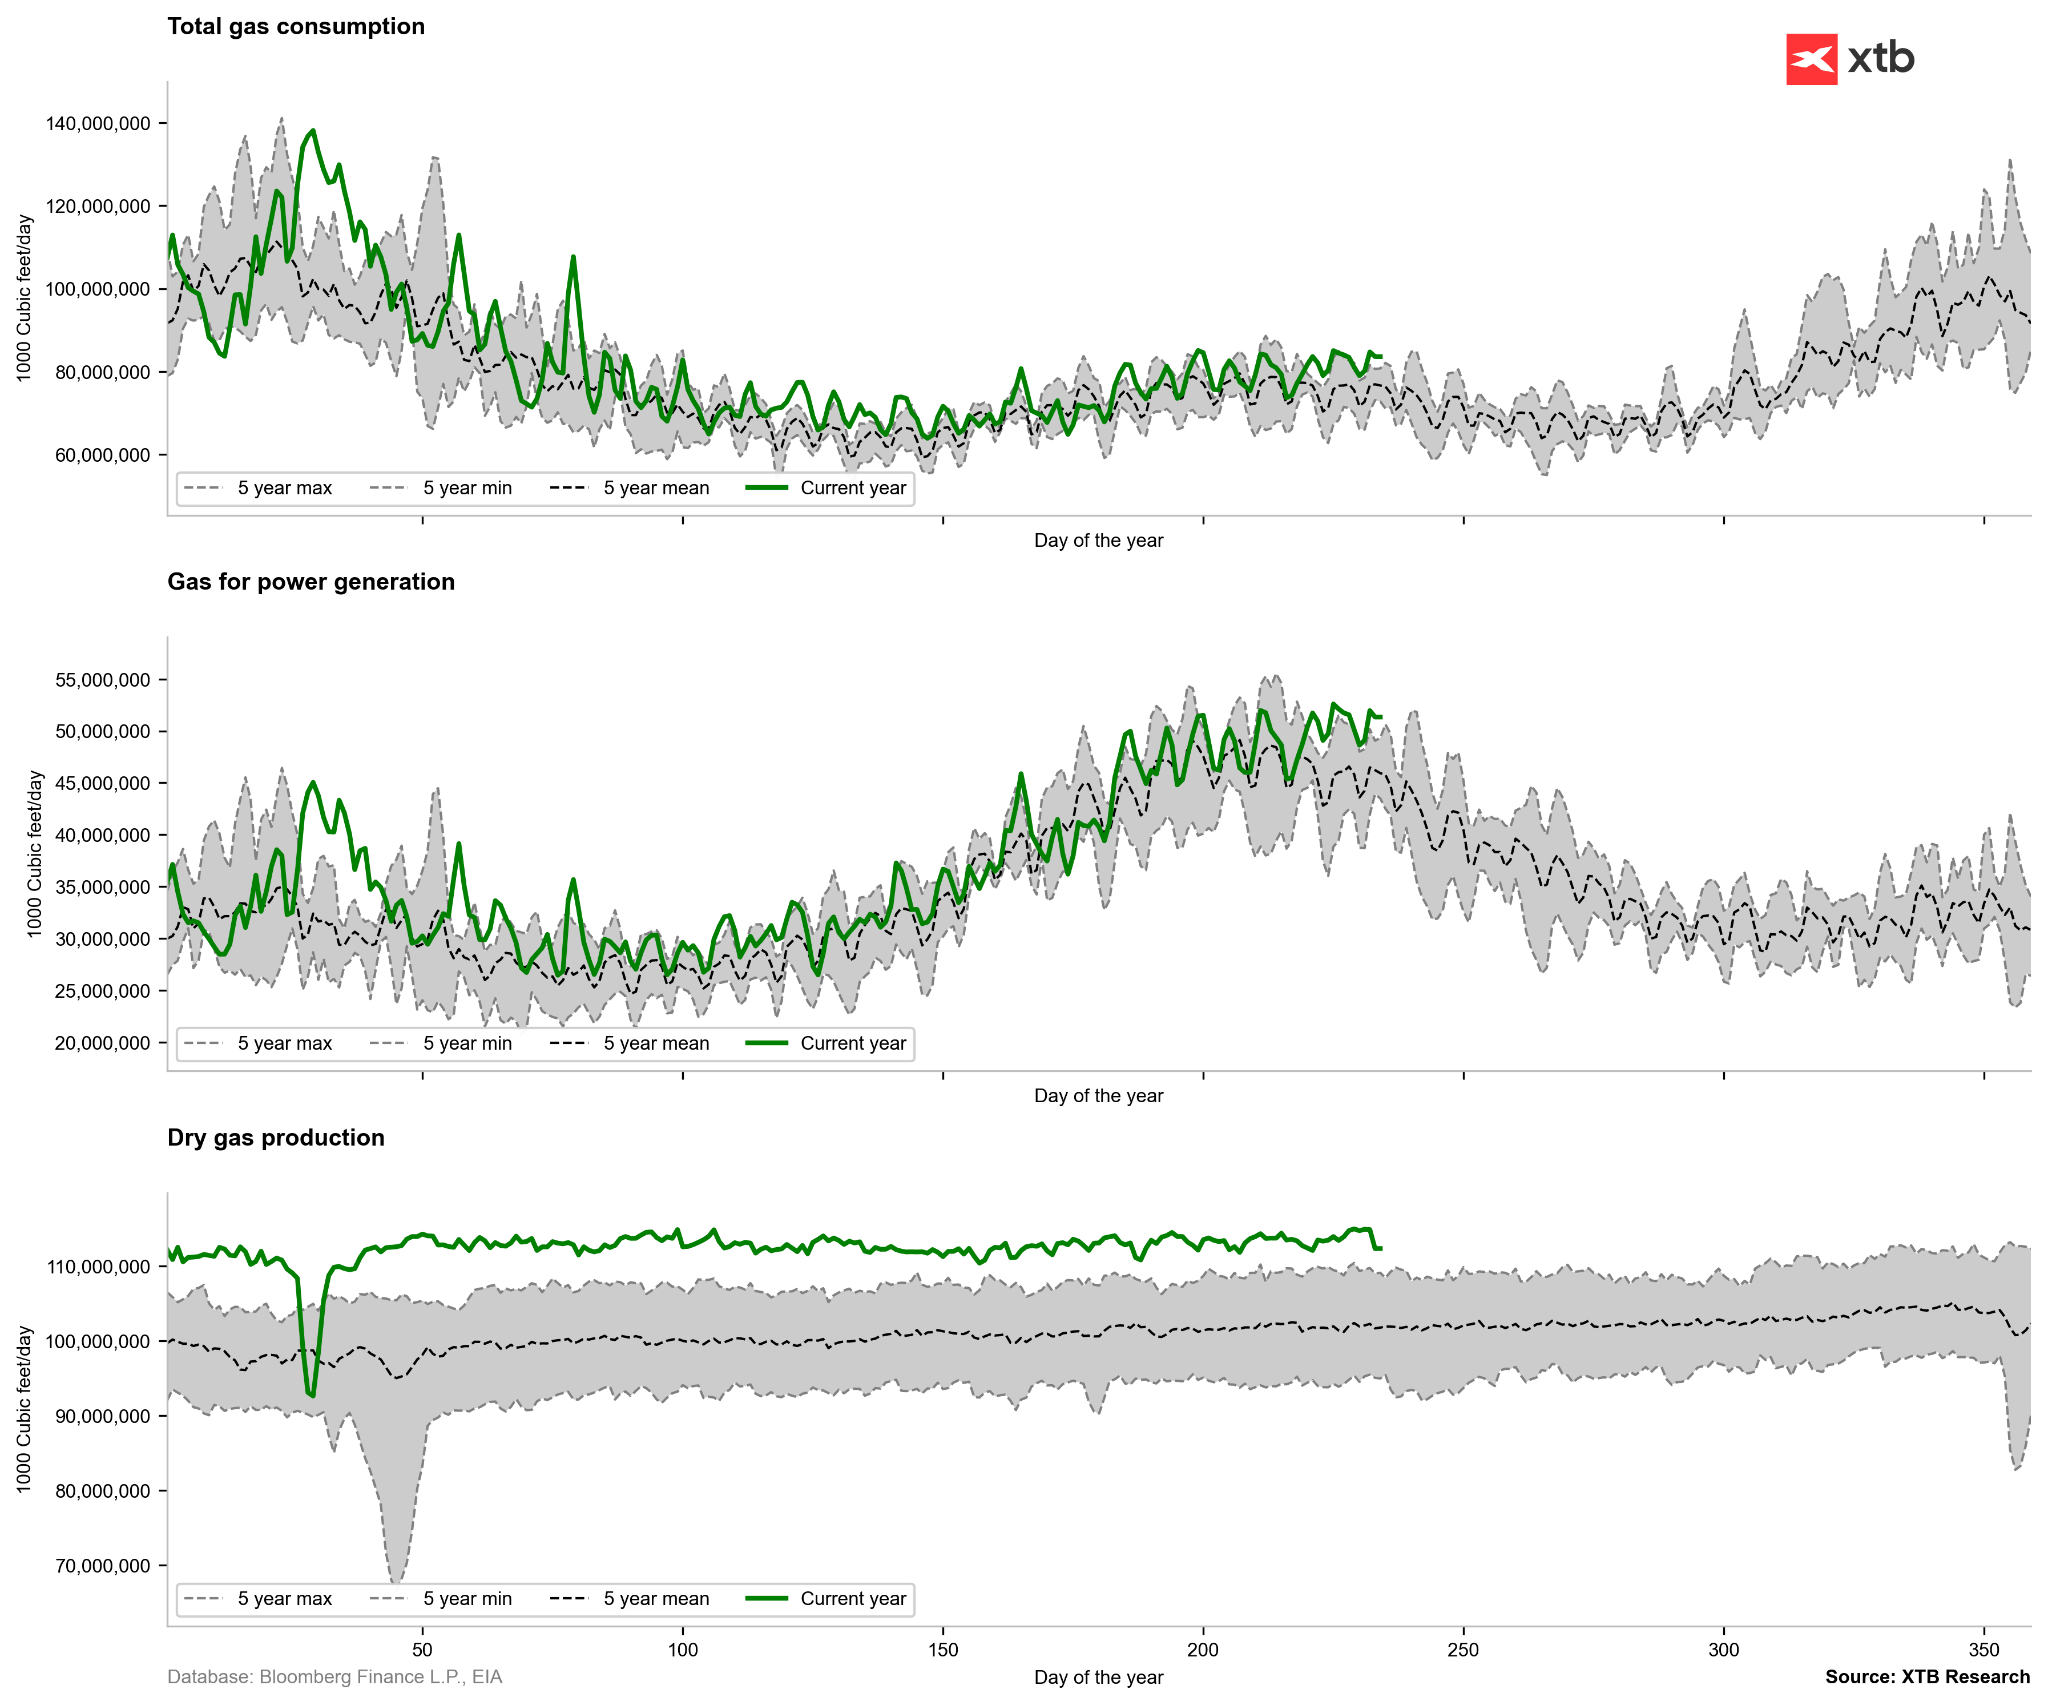
Gas demand remains at a high level, while prices continue to fall. Source: Bloomberg Finance LP, XTB
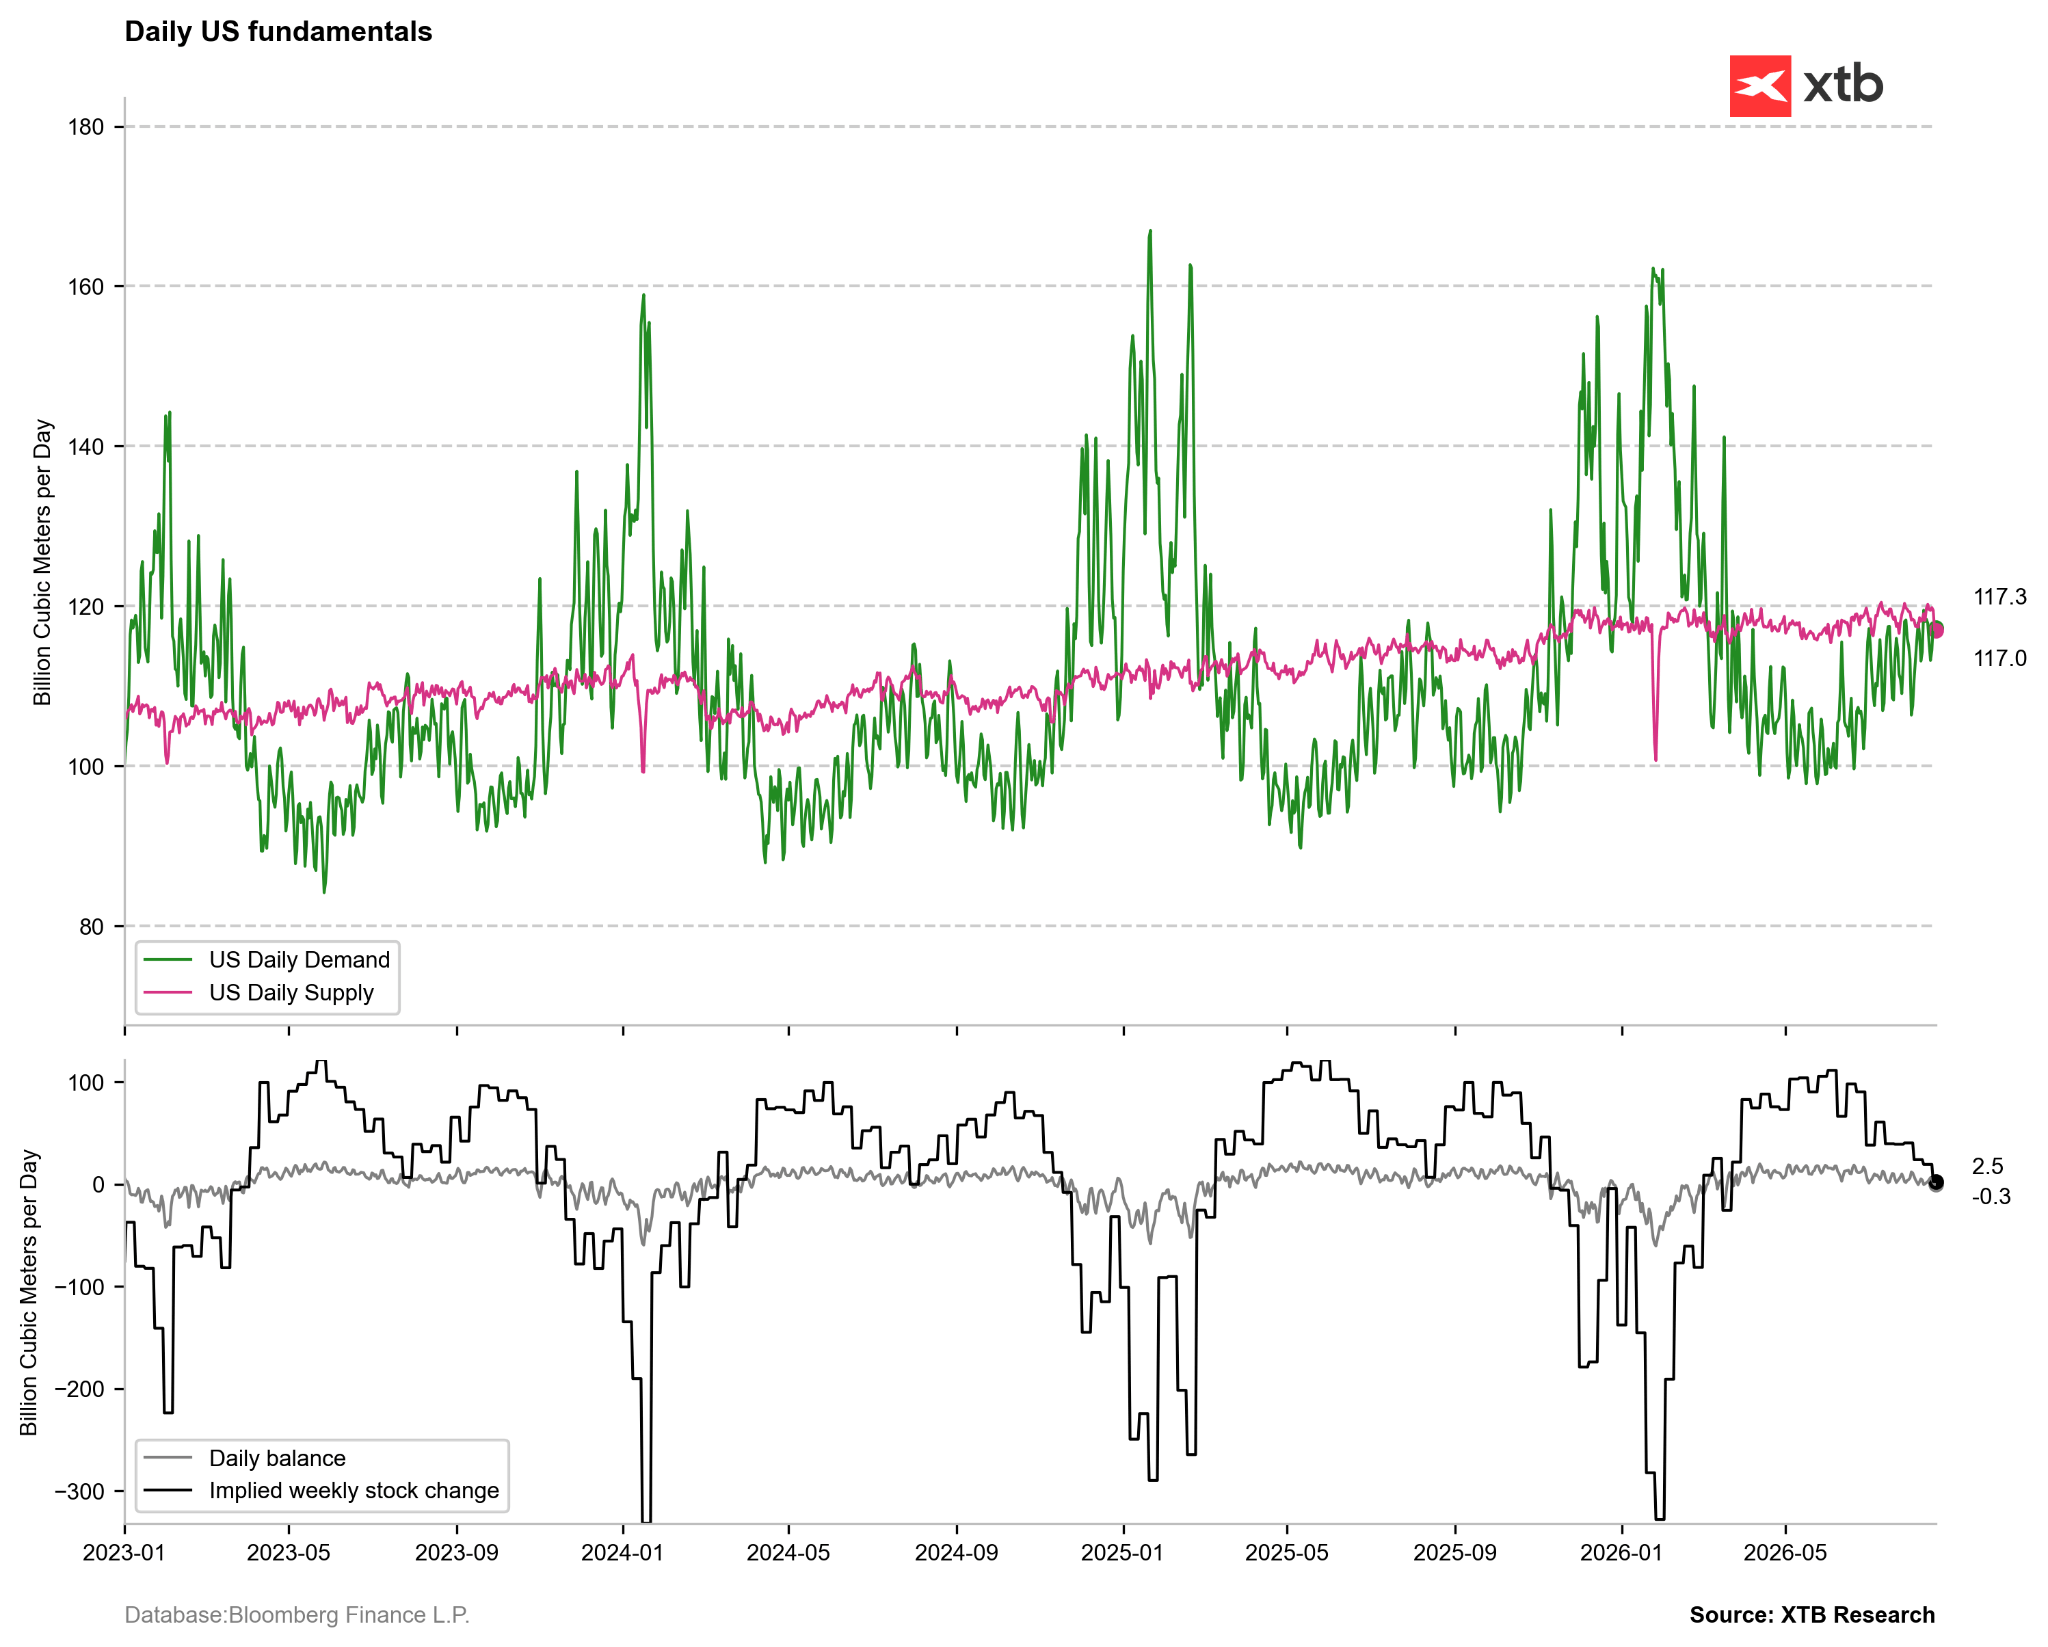
The implied change for inventories this week indicates balanced supply and demand. Standardly, however, already in the second half of August we have a clear drop in short-term demand. Source: Bloomberg Finance LP, XTB
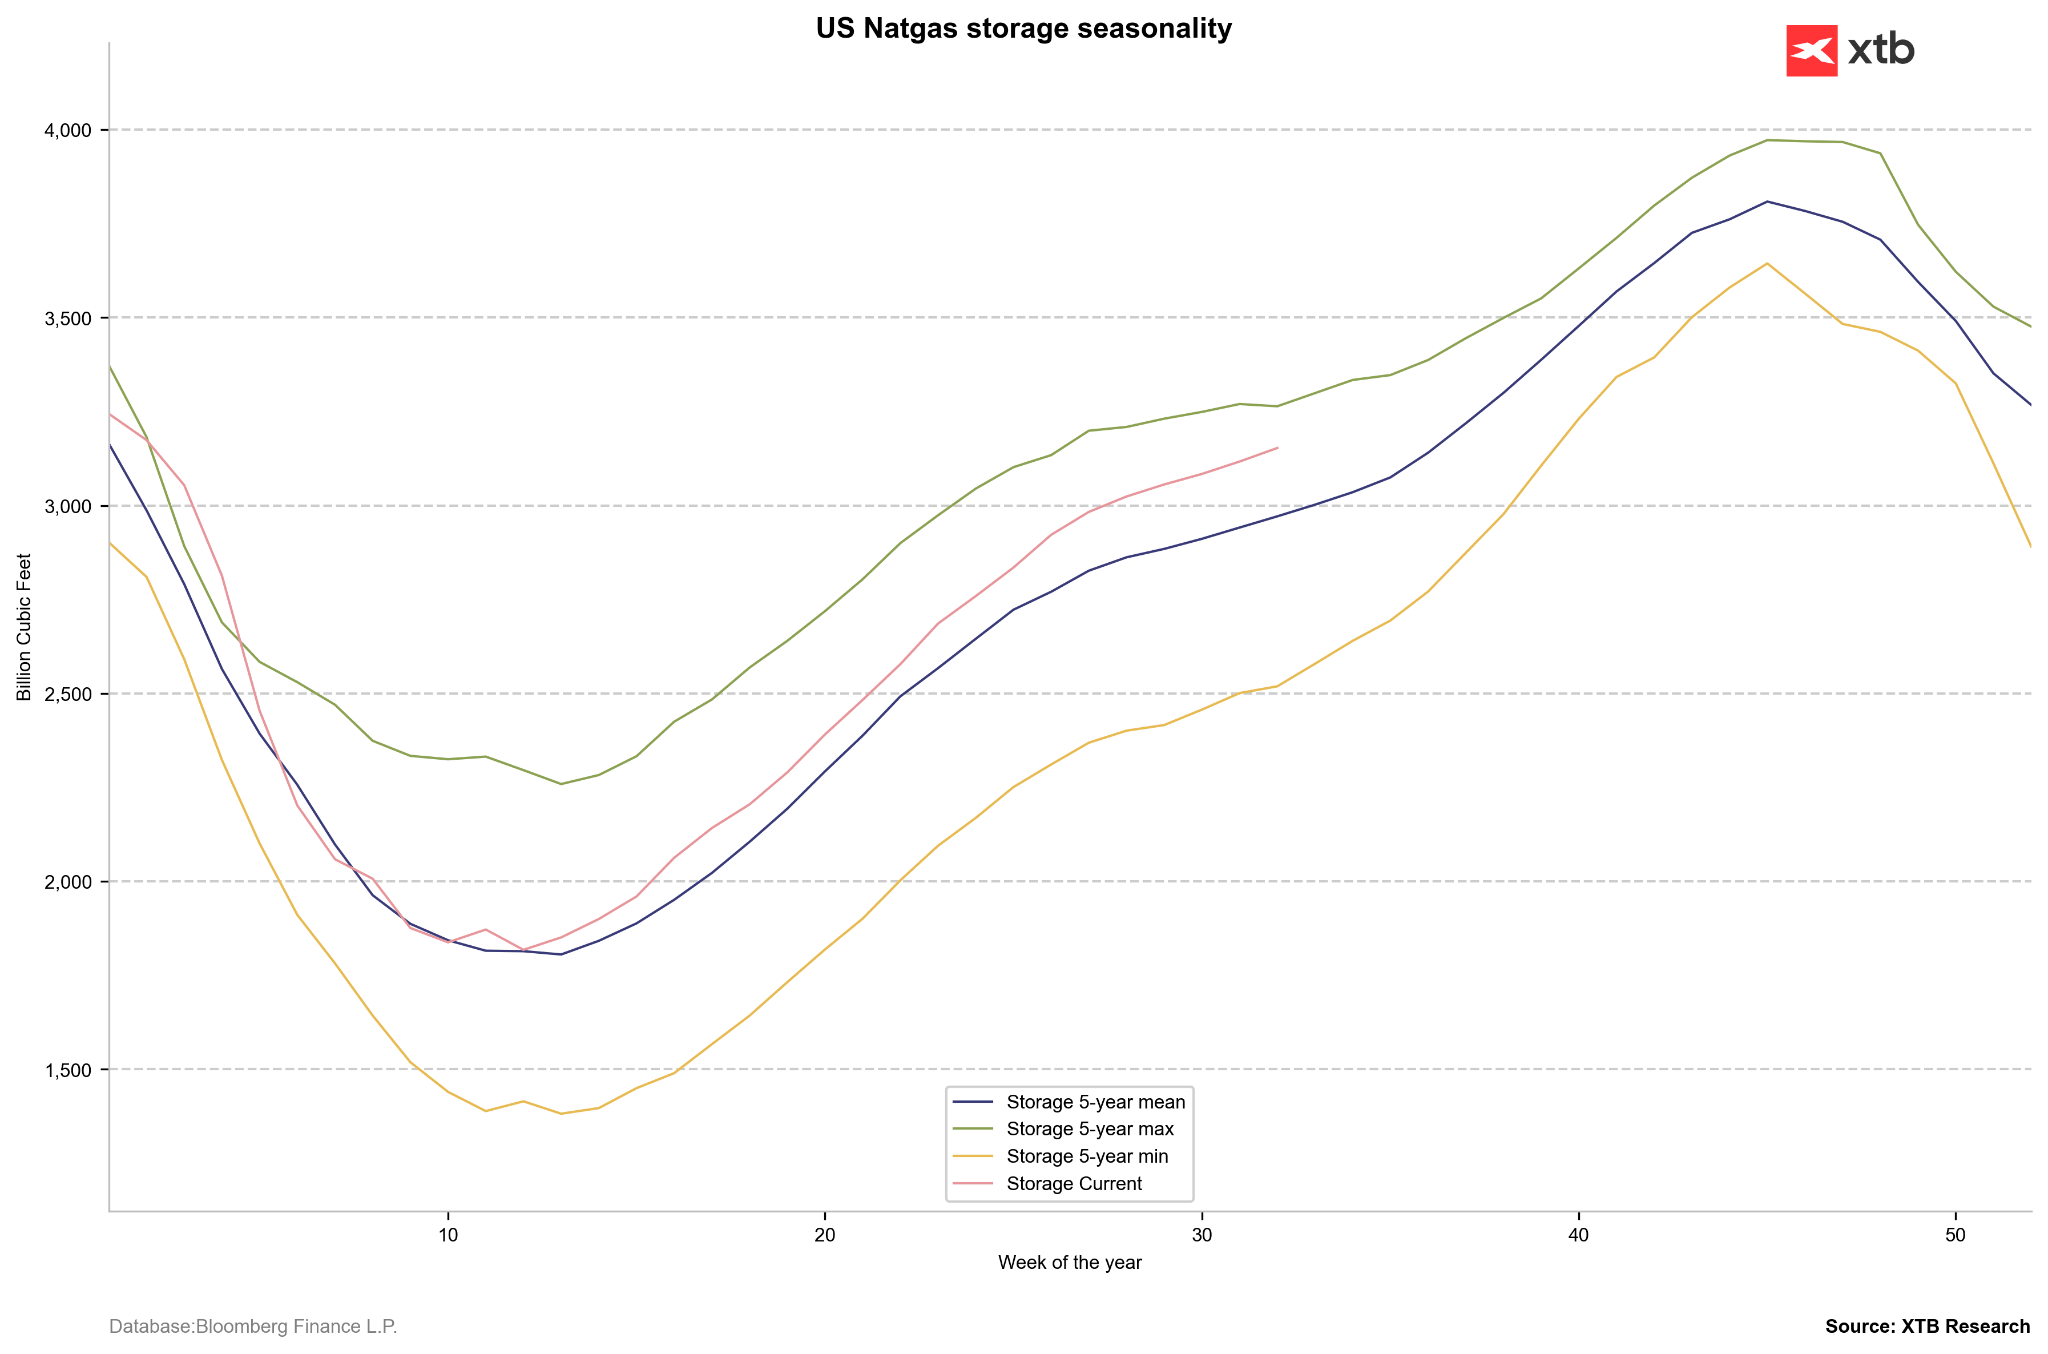
Gas stocks in the USA are above the 5-year average. High production, which already reaches 114 bcfd with limited demand in subsequent weeks, may cause stock replenishment to end close to 4000 BCF. Source: Bloomberg Finance LP, XTB
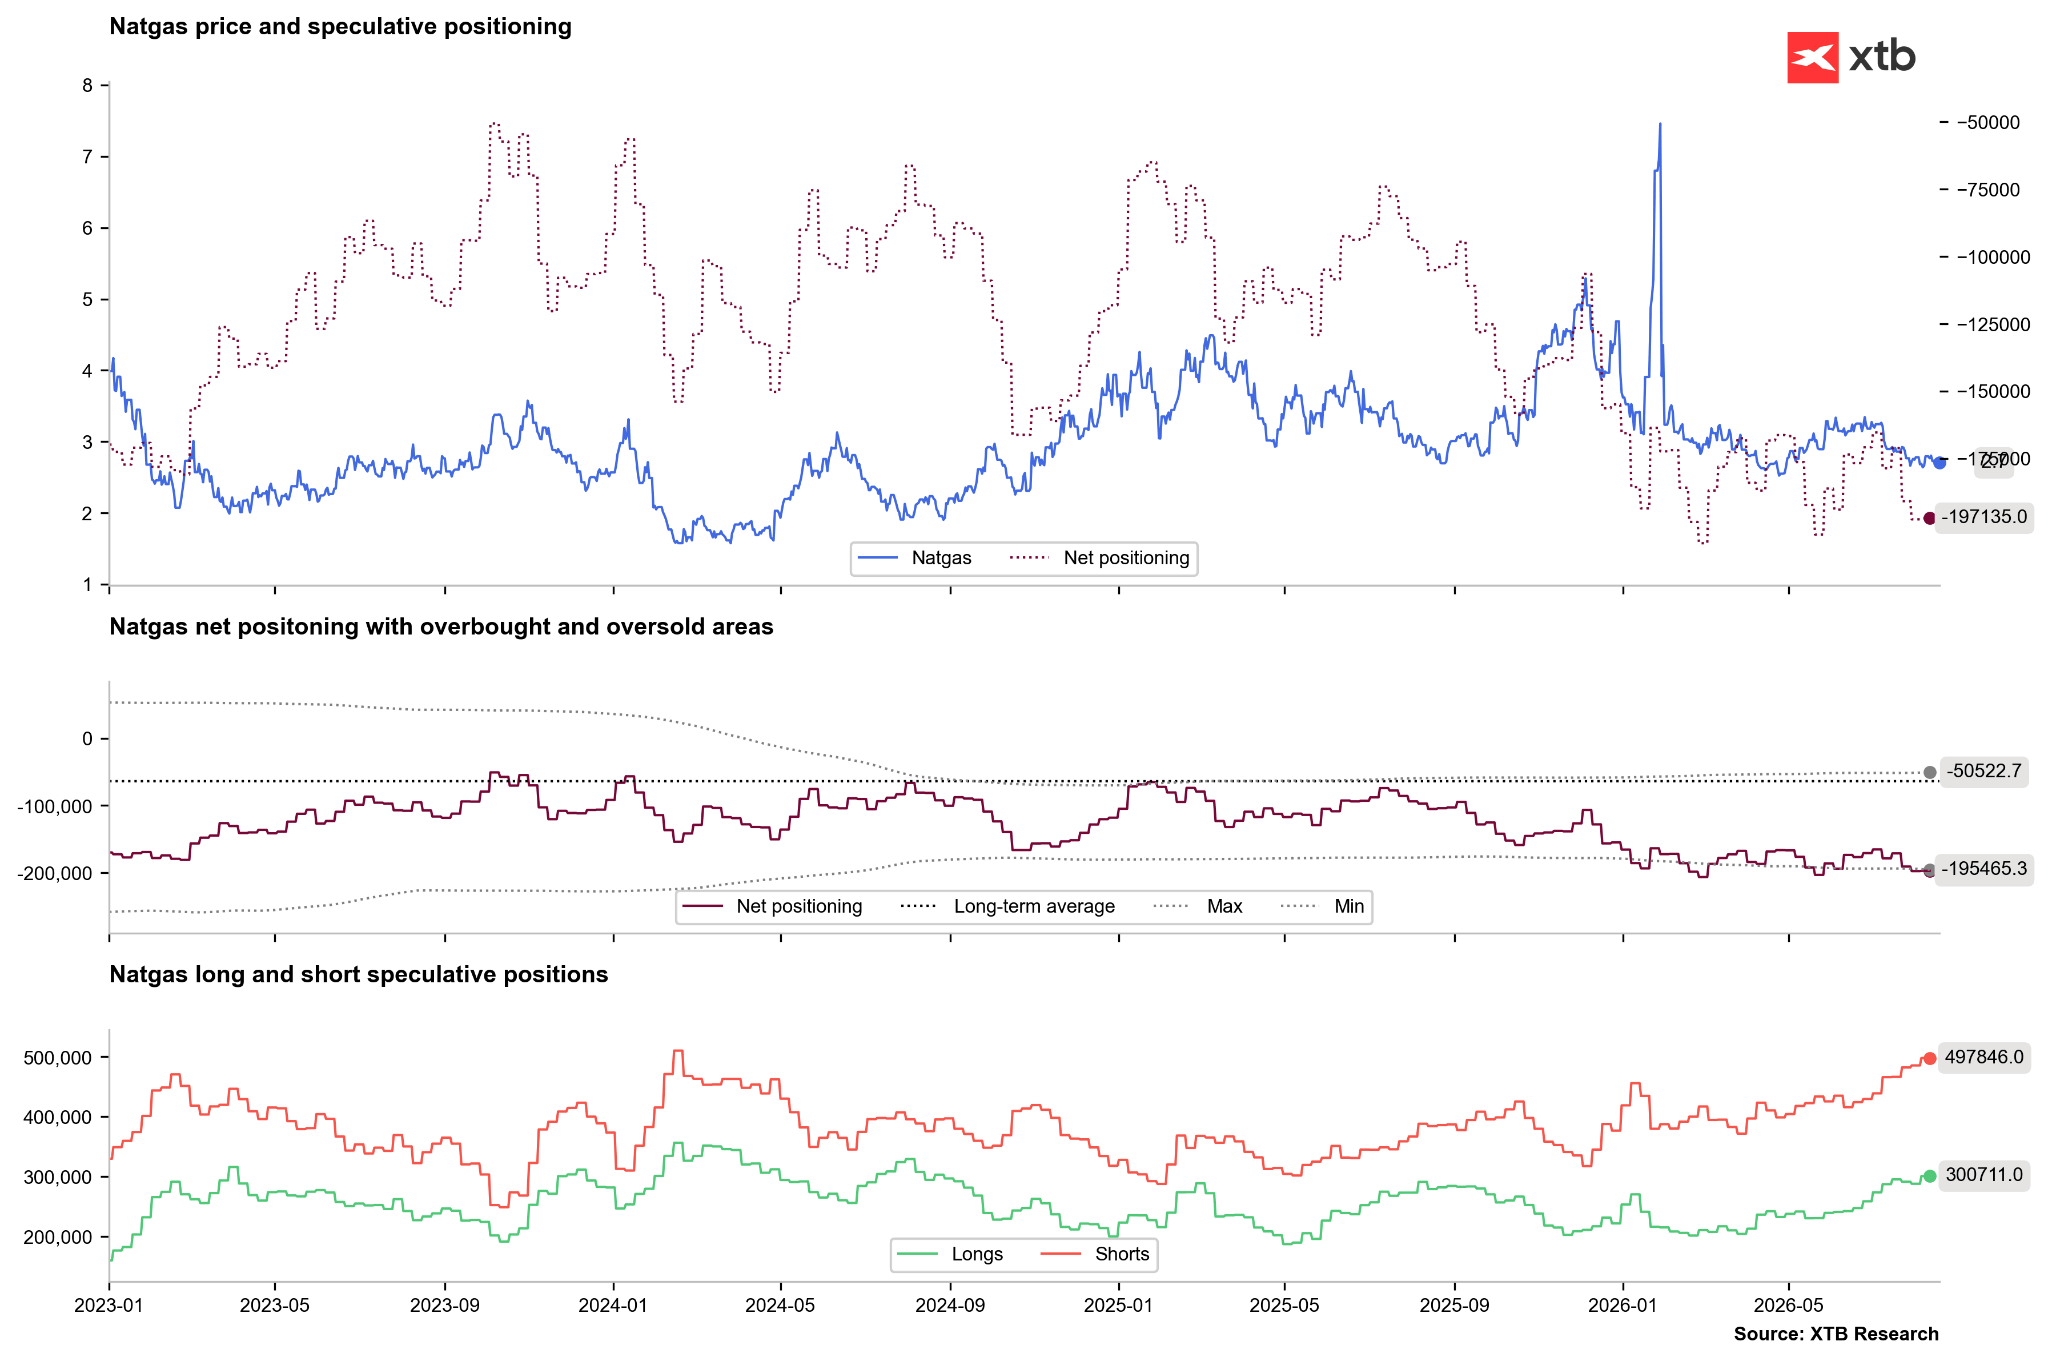
The number of short positions on American gas has risen to an extremely high level. Source: Bloomberg Finance LP, XTB
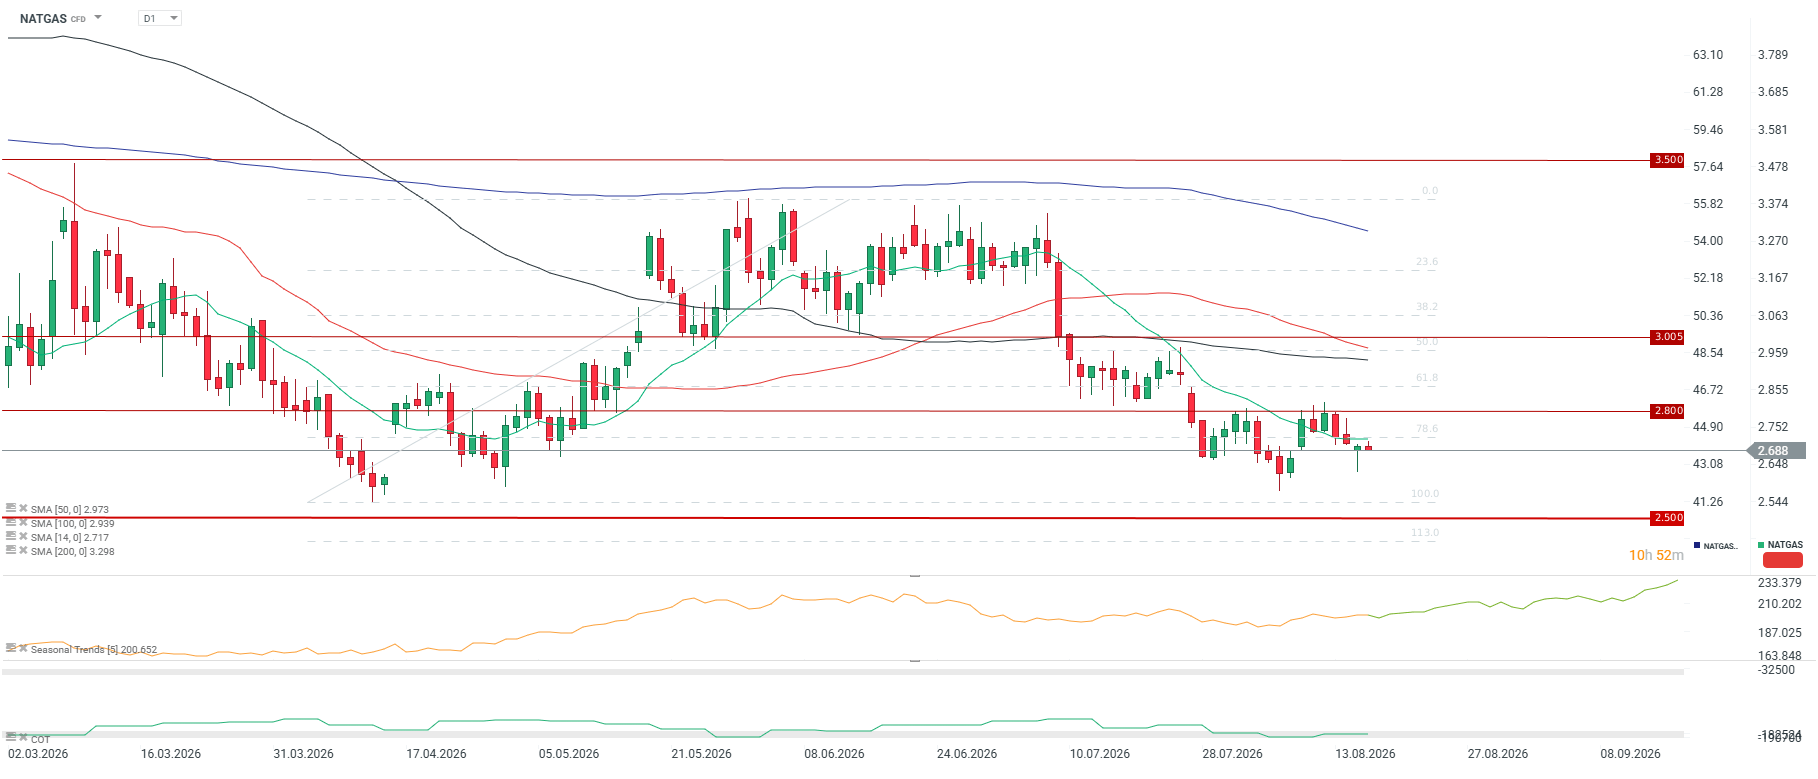
If temperatures in the USA fall, a return of downward pressure will be possible after the next futures contract rollover. At the same time, we observe the potential formation of an inverted head and shoulders (iH&S) formation with a neckline around 2.8. Source: xStation5
Historical Valuation (Z-score)
Statistical analysis based on standard deviation indicators (Z-score) clearly indicates that natural gas is currently valued significantly below its historical averages. Short-term Z-score indicators for the annual period (Z1Y: -1.04) and two-year period (Z2Y: -1.07) suggest a clear undervaluation of the commodity. Key conclusions, however, are provided by the analysis of the trajectory of the 5-year Z-score indicator (Z5Y). It currently stands at -0.55, while a month ago it was at -0.39, three months ago it was -0.30, and half a year ago -0.28. Such dynamics mean that the negative deviation from the 5-year average is systematically growing (undervaluation is deepening). This is a strong warning signal that shows that the market does not show a tendency to return to the mean (mean reversion), but undergoes further price degradation, which historically often heralded an extension of the bear market period.
Scenarios
Bullish Scenario
- Fundamental conditions: To realize this scenario, it is necessary to have an even greater disruption of LNG supplies from the Middle East or a sudden appearance of forecasts heraldings an extremely frosty start to winter in the USA and Europe, which with the ongoing El Niño is currently unlikely. An additional impulse would be the limitation of production by American shale producers, confirmed by EIA stock reports showing a decrease.
- Price levels: Breaking resistance at 2.8 USD/MMBtu, and later at the level of 2.95 USD/MMBtu (SMA50) will open the way to a quick test of the psychological barrier of 3.00 USD/MMBtu. A permanent breakout above this level could fuel a short-squeeze rally towards 3.40–3.50 USD/MMBtu.
Bearish Scenario
- Fundamental conditions: Maintaining the current record-high gas production in the US while at the same time a lack of weather anomalies in the autumn (warm September and October). A quick de-escalation of the conflict in the Middle East and a return to safe shipping in the Persian Gulf region would eliminate the geopolitical premium, leaving the market under the pressure of local oversupply.
- Price levels: Falling below key support at the 2.50 USD/MMBtu level. Breaking this technical barrier will open the way to deepening the historical undervaluation (in accordance with the Z5Y indicator trend) and testing lows in the 2.20 USD/MMBtu region, and in extreme cases even the psychological 2.00 USD/MMBtu level.