





- Silver price capitalizes on a lower US Dollar, US Treasury Yields.
- Investors keenly await the US PPI and CPI data for August.
- The US headline CPI is expected to remain stronger due to elevated energy prices.
Silver price (XAG/USD) is up 1.25% to near $67.00 during the Asian trading session on Tuesday. The white metal strengthens as the US Dollar (USD) and United States (US) Treasury Yields come under pressure, with investors shifting their focus to the Consumer Price Index (CPI) data of August scheduled for Friday.
As of writing, the US Dollar Index (DXY), which gauges the Greenback’s value against six major currencies, trades 0.1% lower to near 98.83 even after recovering some of its early losses. 10-year US Treasury Yields are down 0.17% to near 4.77%.
Lower US bond yields result in an improvement in the appeal of non-yielding assets, such as Silver.
Investors will pay close attention to the US CPI data to get fresh cues regarding the Federal Reserve’s (Fed) monetary policy outlook.
TD Securities sees core inflation contained even as headline CPI firms
According to TD Securities, the August CPI report is likely to show that “underlying inflation stayed under control,” with core prices “rising 0.19% m/m (2.3% y/y).” The bank expects the “services segment” to be the main driver of gains, while “core goods prices likely acted as a drag by posting a modest m/m drop.”
In contrast, TD looks for “headline CPI” to post “a stronger 0.37% m/m (3.4% y/y) due to rising energy prices and a slight pickup in food inflation.” The bank also cautions that “risks to our forecasts” are “skewed to the upside,” noting that its projections assume “a number of large price declines in tariff-exposed goods categories, including apparel and household goods.”
Before the US consumer inflation data, investors will focus on the Producer Price Index (PPI) data of August, which will be released on Thursday.
Silver Technical Analysis
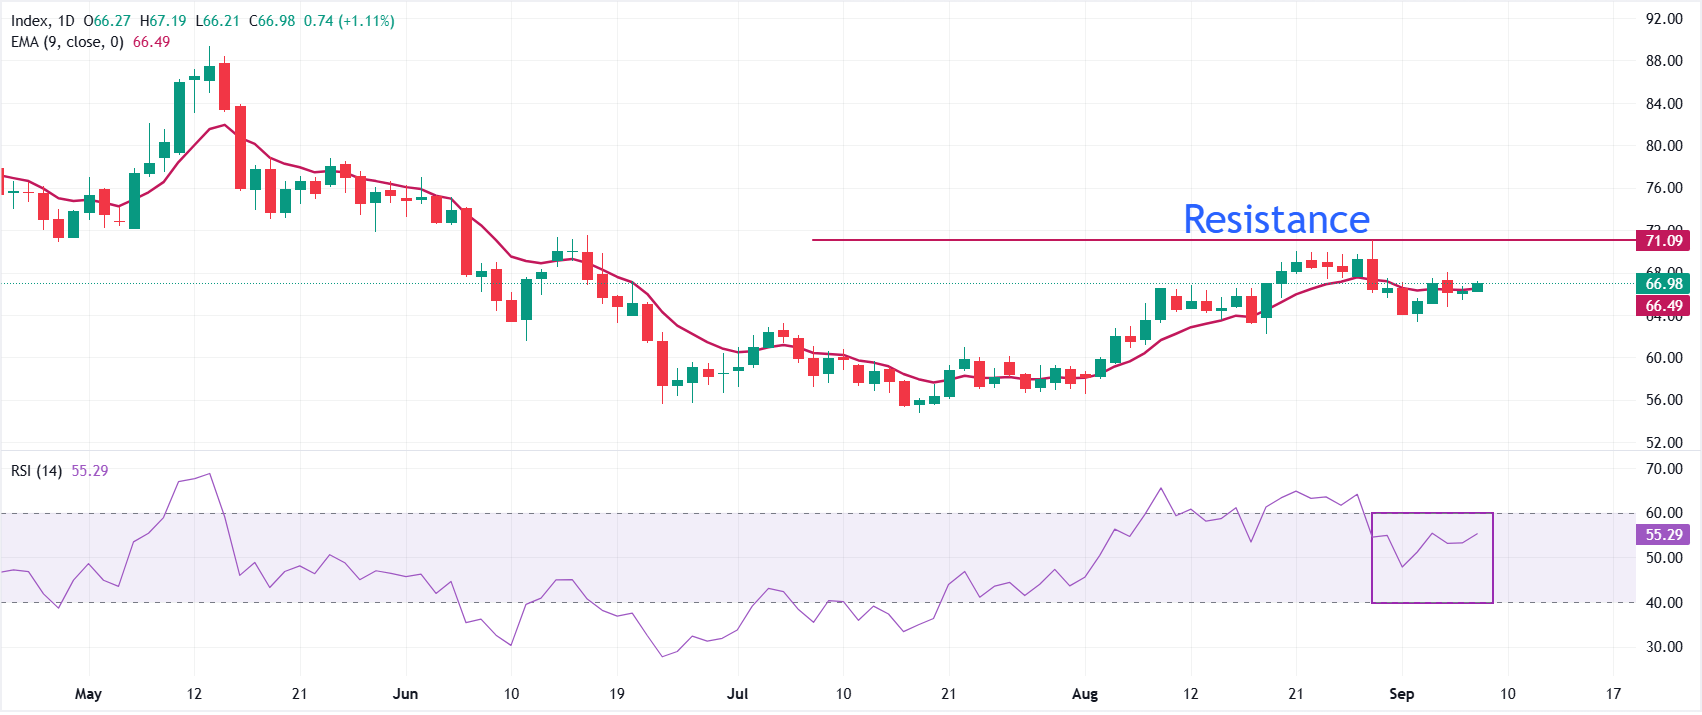
In the daily chart, XAG/USD trades at $66.97. The pair holds a constructive near-term bias as price remains above the nine-day Exponential Moving Average (EMA) at $66.49, suggesting the recent pullback is being supported rather than reversed. The Relative Strength Index (RSI) around 55 keeps a mildly positive tone, hinting that bullish momentum is still intact without yet pushing into overbought territory.
On the downside, initial support is aligned with the nine-day EMA at $66.49, where a daily close below would hint at a deeper consolidation toward lower levels not yet defined by the present indicators. Looking up, the August high at $71.12 could act as key hurdle.