





Facts:
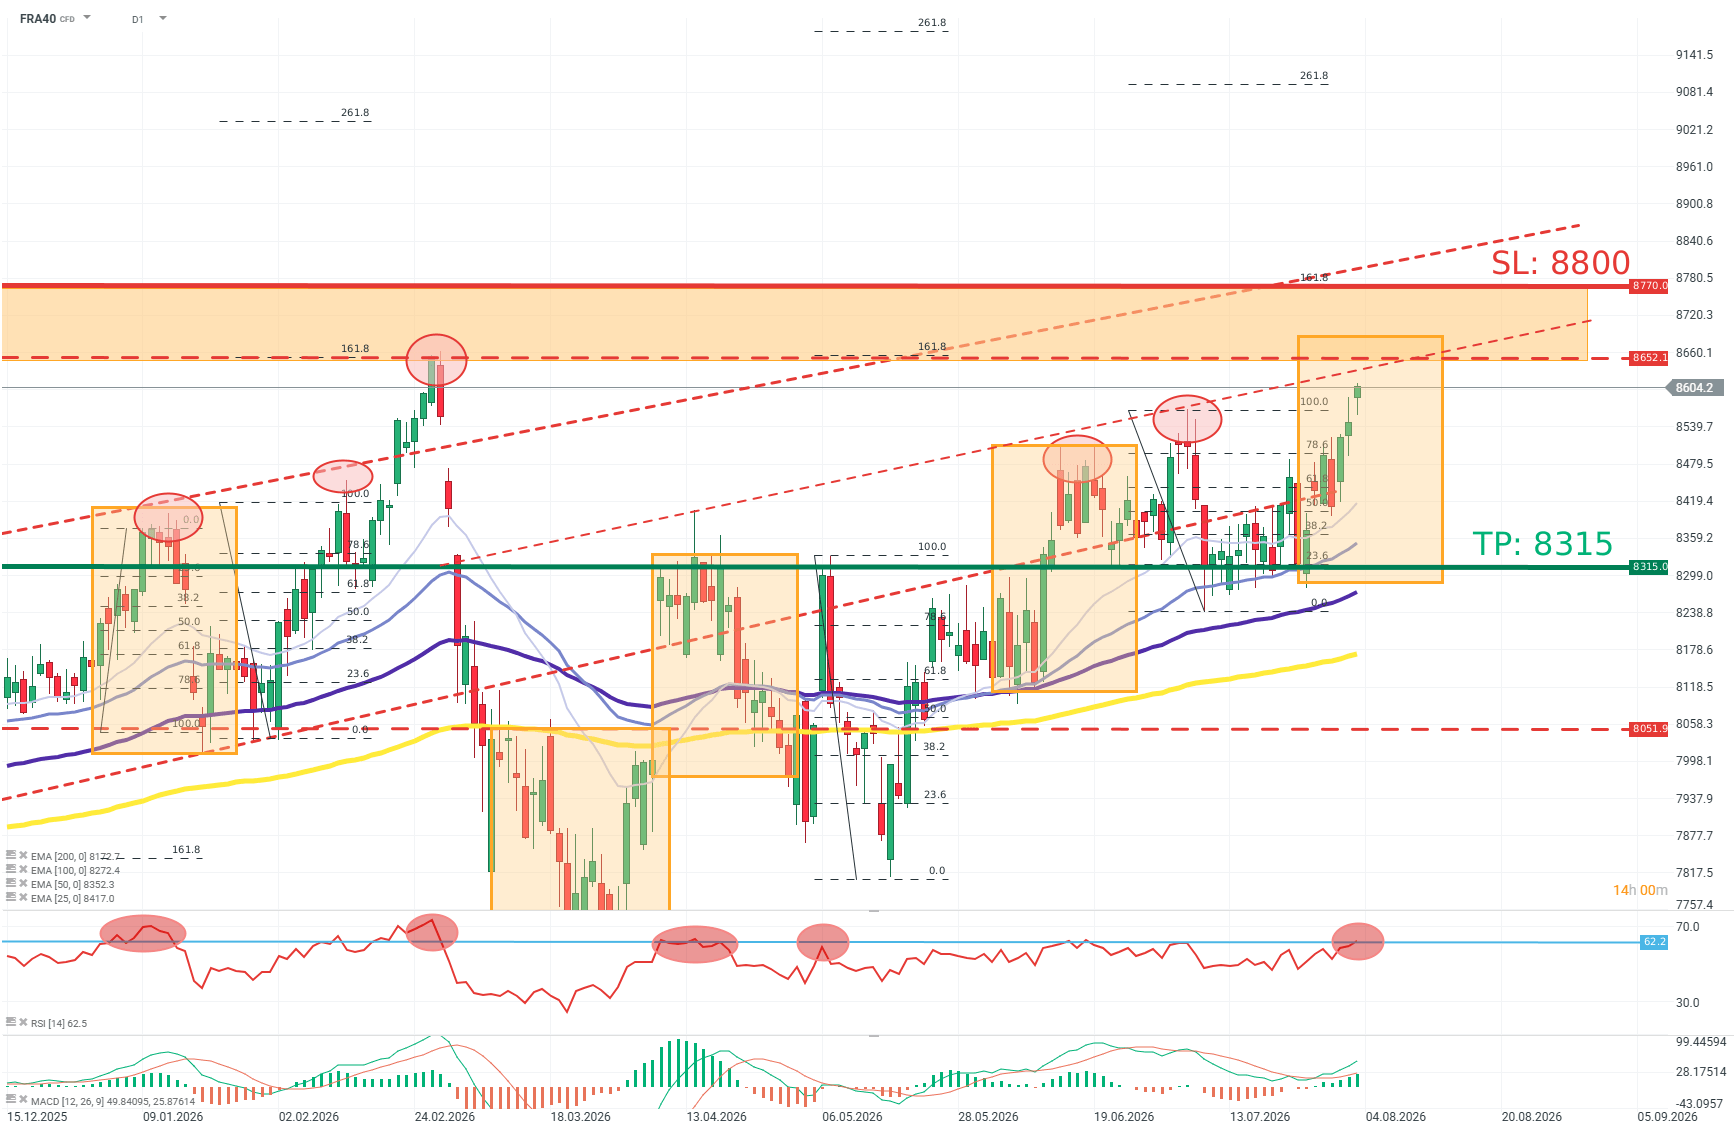
- RSI[14] reached 62.2
- The price is approaching the previous peak (around 8630)
- The previous peak stalled at the FIBO upswing around 161.8
Recommendation: Short position (Sell) on FRA40 at market price
- Target price (Take Profit, TP): 8315
- Stop Loss (SL): 8800
FRA40 (D1)
Source: xStation5
OPINION:
The upward momentum suggests conditions favorable for a downward correction and an attempt to complete a double-top pattern. The RSI indicator is particularly important, as it has reached a level above which the price has regularly undergone downward corrections over recent months. Methodology and assumptions:
- The recommendation is based on technical chart analysis, in particular EMA moving averages and Fibonacci levels.
- The target level was determined based on Fibonacci levels, EMA moving averages, and the historical size of corrections.
- The protective stop loss order was set based on a favorable risk-to-reward ratio and with reference to a Fibonacci level.