
 EUR /
EUR /  USD — Euro / US Dollar
 JPY — US Dollar / Japanese Yen
 GBP /
GBP /  AUD /
AUD /  CAD — US Dollar / Canadian Dollar
 CHF — US Dollar / Swiss Franc
 NZD /
NZD / Trade of The Day – US100
- May 6, 2026
- Posted by: Today Markets
- Categories: Competitive research, Markets, Technical Analysis
No Comments

Facts
- US100 has kept RSI above 65 for 17 sessions.
- The current RSI stands at 78.3.
- Price has reached the 161.8 Fibonacci level, plotted based on the lows from 31/03/2026 and the highs from 29/01/2026.
Trade: Short position on US100 at market price.
- Target: 26,700
- Stop: 29,715
US100 (D1)
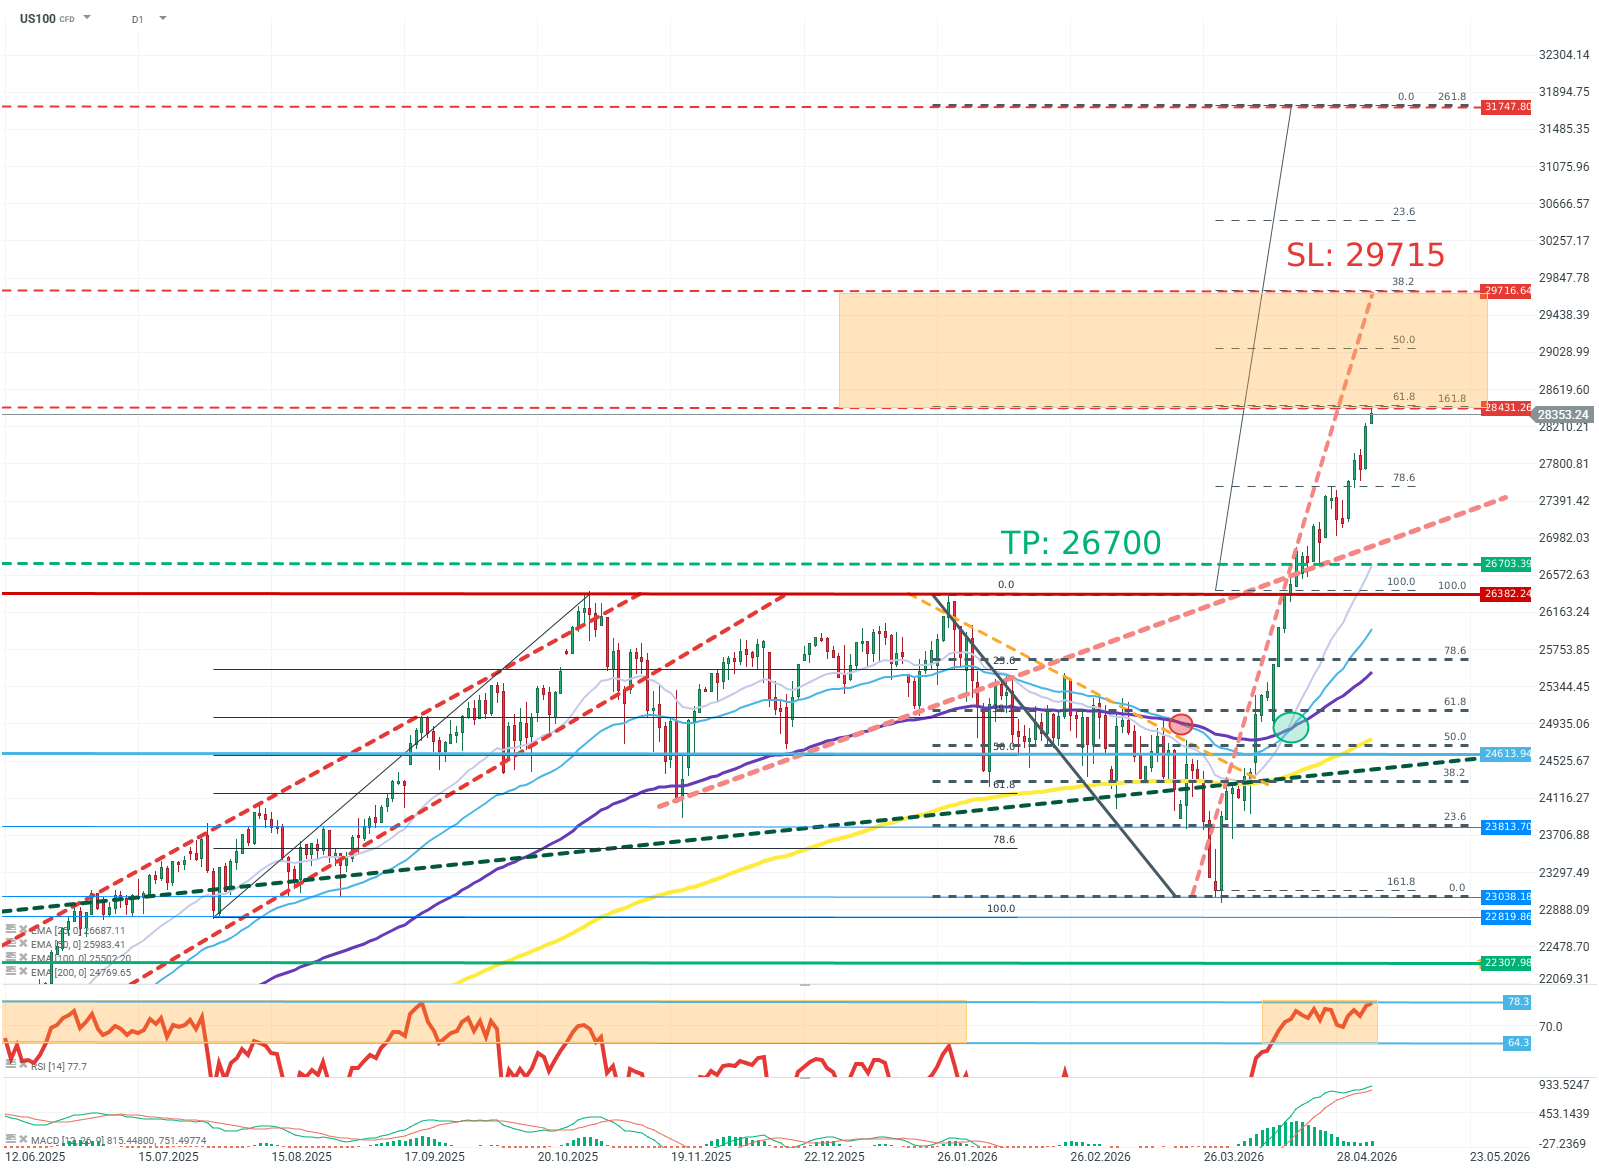
Source: xStation5 Opinion: The gains achieved by the technology index over the past few months constitute a historical anomaly, which should ultimately result in an upcoming downward correction. The tail end of the earnings season means that most positive information is already priced in, while potential market risks stemming from the conflict in the Middle East remain unaddressed. Methodology and assumptions
- The recommendation is based on technical analysis of the chart, in particular RSI and Fibonacci levels.
- The target level was determined using Fibonacci levels.
- The protective stop-loss order was set based on a favorable risk-to-reward ratio and aligned with a Fibonacci level.


