




- Silver price trades sideways near $53 in the countdown to the US CPI data.
- Both the US headline and the core CPI are expected to have at a faster pace on an annualized basis.
- The US Dollar is broadly under pressure due to lower oil prices.
Silver price (XAG/USD) consolidates at around $53.00 during the early European trading session on Tuesday. The white metal flattens as investors await the United States (US) Consumer Price Index (CPI) data for October, which will be published at 13:30 GMT.
According to estimates, the US headline CPI grew at a faster pace of 3.9% Year-on-Year (YoY), higher than the previous reading of 3.7%. The core CPI – which excludes volatile food and energy items – is also seen higher, arriving at 2.8% YoY against the prior release of 2.6%.
On a monthly basis, both the headline and the core inflation growth remained moderated at 0.3% and 0.2%, respectively.
The inflation data is expected to have a significant impact on Federal Reserve’s (Fed) interest rate expectations. Currently, traders are confident that the Fed will hike interest rates in the December policy meeting, according to the CME FedWatch tool.
Higher interest rates by the Fed bode poorly for non-yielding assets, such as Silver.
Ahead of the US CPI data, the US Dollar is under pressure as global inflation expectations have anchored due to falling oil prices. Energy prices have faced a setback as hopes of a US-Iran deal have increased.
As of writing, the US Dollar Index (DXY), which gauges the Greenback’s value against six major currencies, holds onto its previous day’s losses near 101.67.
Silver Technical Analysis
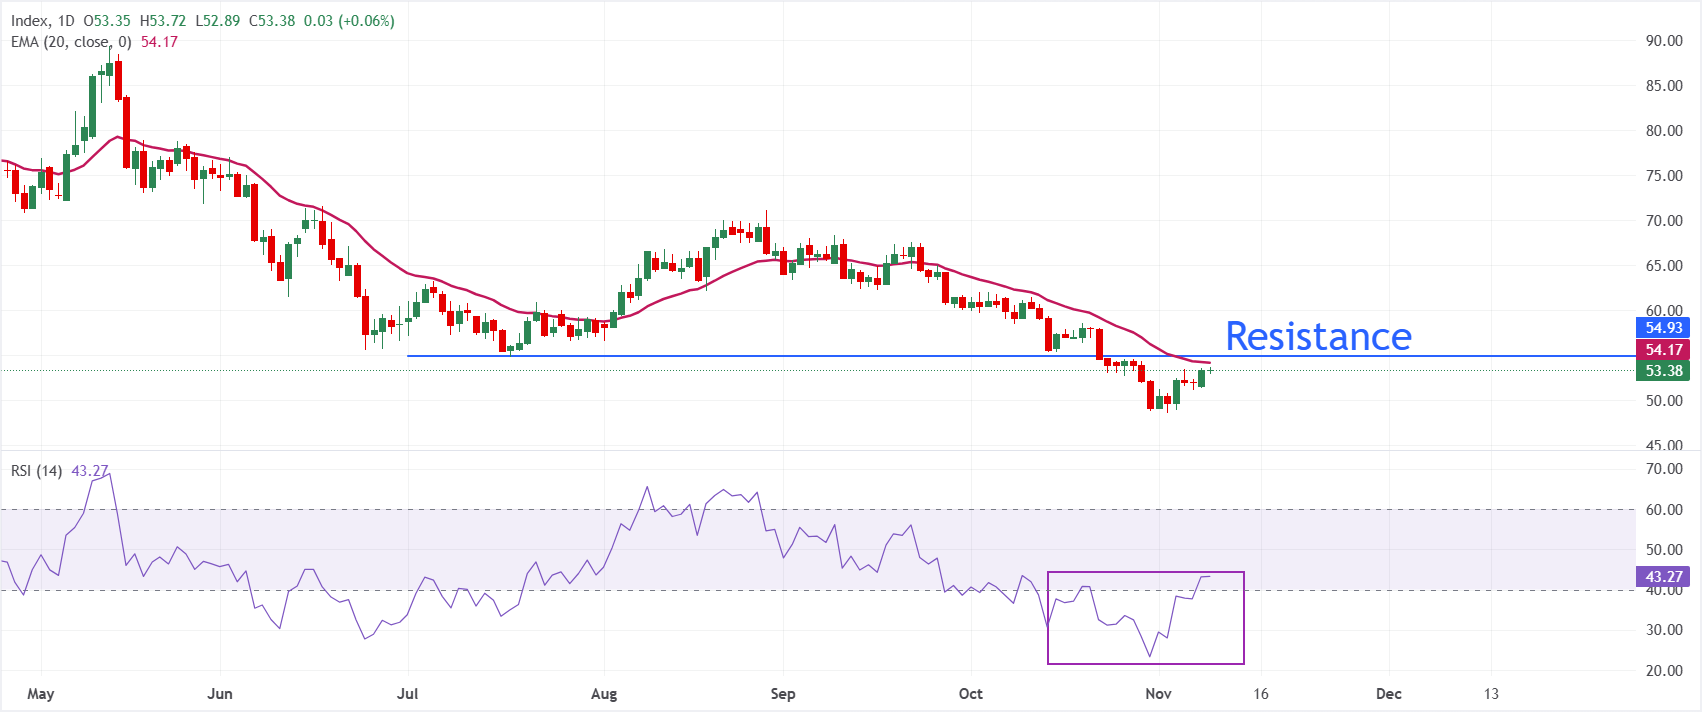
In the daily chart, XAG/USD trades at $53.39. The pair holds in a bearish near-term bias as price remains below the 20-day Exponential Moving Average (EMA) at $54.17, suggesting rallies are still being capped by this dynamic barrier. The Relative Strength Index (RSI) at 43 remains below the midline, hinting that downside pressure persists despite a modest recovery from recent lows.
On the topside, initial resistance is located at the 20-day EMA around $54.17, and a daily close above this level would be needed to alleviate immediate bearish pressure and open the door to a more sustained rebound. On the downside, the absence of nearby confirmed support levels on the daily chart underscores the risk of renewed weakness if sellers regain control, with traders likely to rely on intraday structure and prior swing lows to gauge where buying interest may next emerge.